Year 11 pupils will collect their GCSE results tomorrow.
For a second year, grades have been awarded by teacher assessment rather than by public examinations. However, there are important differences in the awarding process compared to last year.
In this blogpost, we look at how 2021 grades might compare to previous years.
Differences in how grades were awarded in 2020 and 2021
In 2020, pupils in Year 11 had largely completed their Key Stage 4 study when the first national lockdown occurred in March 2020. GCSEs were awarded by centre assessment grades (CAGs), which were based on the grades schools believed pupils would achieve had they sat the exams. There were plans to moderate these grades to bring them in line with results from previous years using an algorithm but these were subsequently abandoned [1].
FFT 2021 Secondary Results Service
Aspire schools can access a full national analysis of this year’s KS4 and KS5 results as well as future KS5 estimates for Y12 students. Simply upload your grades to Aspire before 3 September.
Not an FFT Aspire user?
In 2021, teacher assessed grades (TAGs) are based on performance in content studied during Key Stage 4. These try to recognise that pupils have suffered different amounts of learning disruption, even those in the same school, whilst also requiring the assessment to be similar for all students.
The implicit assumption within the guidance on awarding grades produced for schools by JCQ seems to be that pupils may have covered less content than previous cohorts, but that they would have achieved the same standard in what they had covered.
The guidance also suggests that schools review their grades against results from 2017 to 2019 when exams took place. In a previous blogpost, we showed that schools’ overall results (all subjects combined) for the current year are strongly correlated with those from two to five years earlier, but there is much less correlation in individual subjects.
Awarding bodies have been undertaking external quality assurance of these grades, using samples of evidence collected from schools, although details of exactly how they have been doing this have been scant so far.
What might 2021 results look like?
Prior to schools submitting their TAGs, we offered a benchmarking service that provided schools with analysis to help them compare their preliminary TAGs with data on historic performance.
Over 1,600 state-funded mainstream secondary schools participated in the service, together with a small number of special and alternative provision schools. For over 1,300 schools this data can be linked with 2019 exam grades and 2020 final grades.
We make the important caveat here that the 2021 grades we have are not necessarily those that schools submitted.
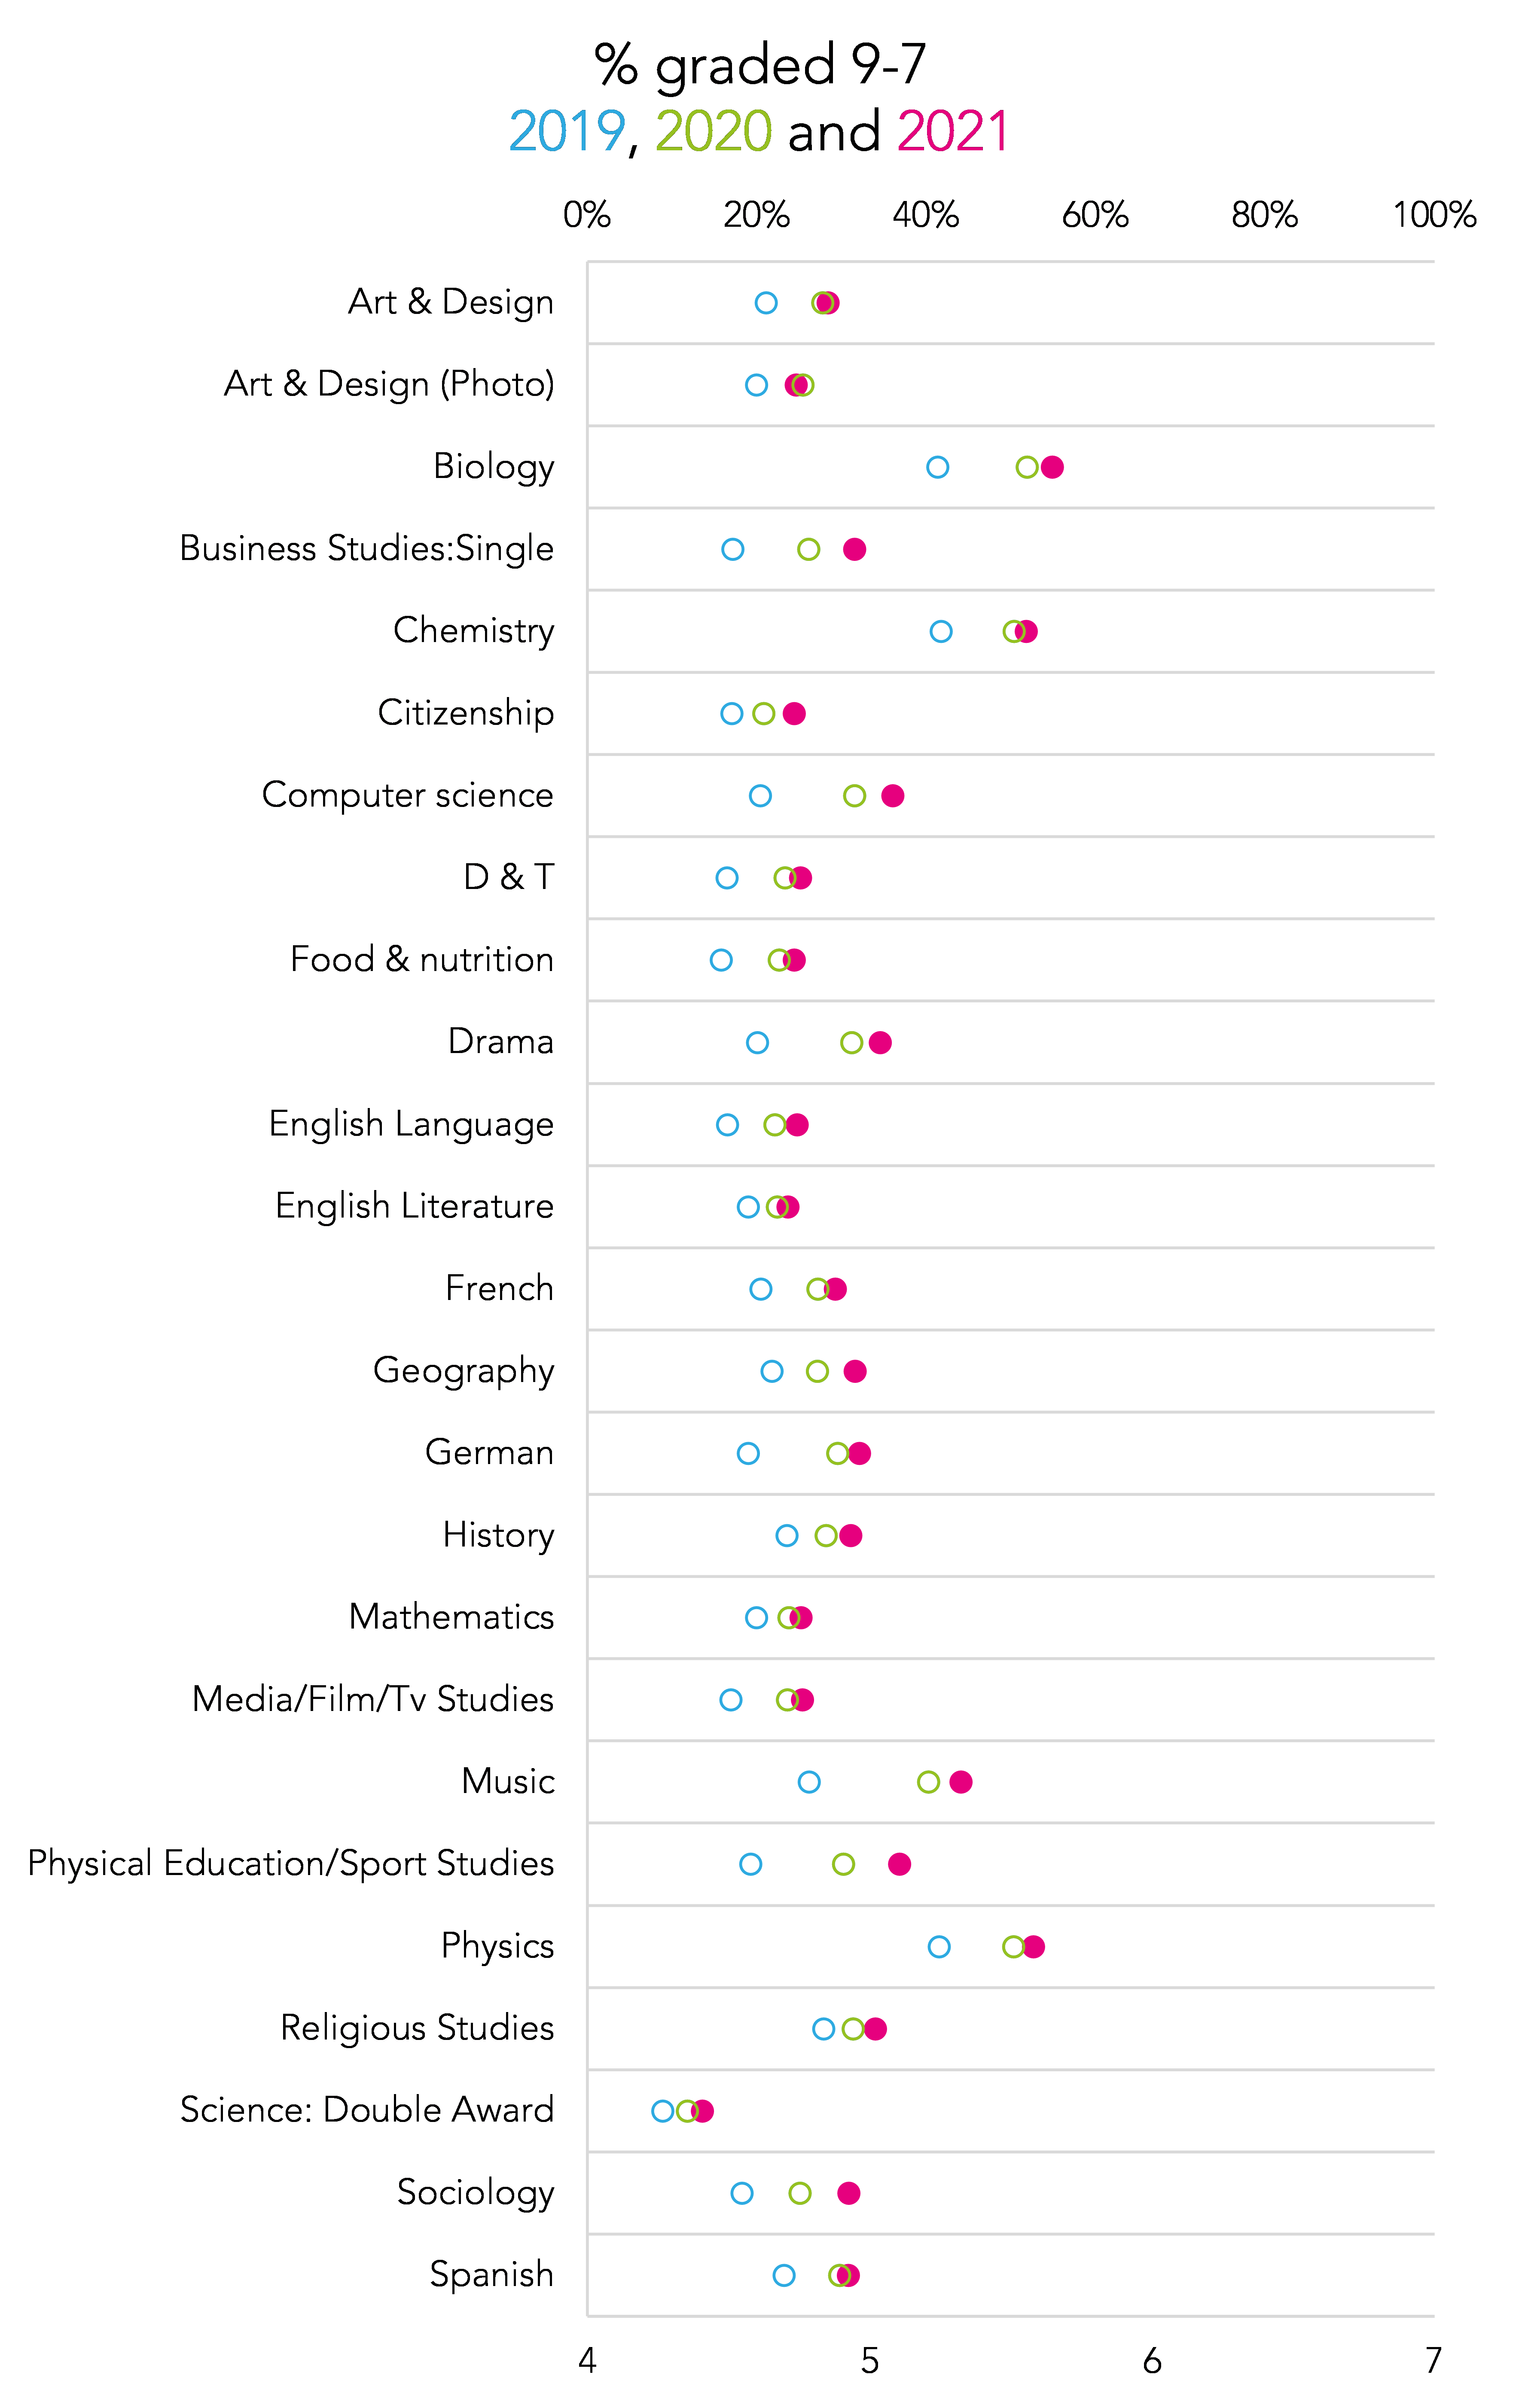
First of all, we show the differences in average point score (the average grade) by subject. We restrict our analysis to subjects with at least 7,000 entries across the 1,300 schools.

This shows that 2021 grades are slightly higher than those from 2020 in most, but not all, subjects. The chart below shows the differences between 2019 and 2021 more clearly.

Compared to 2019, 2021 grades are at least a grade higher on average in computer science and music. This compares to between 0.3 and 0.4 of a grade in art and design (photography), English literature, mathematics and double award science. Bear in mind that in some subjects, such as business studies, there was only one year of results for the reformed specifications to go on. So even if teachers had been in post then, there will only be limited familiarity with the grading standards.
In our sample, attainment was higher in German than in French and Spanish. It will be interesting to see how grades compare nationally on Thursday. Recently, grades in Spanish have tended to be higher and pre-pandemic there were plans to bring French and German grades in line with Spanish.
The percentage of 9-4 grades in 2021 was broadly similar to 2020 in most subjects. Attainment tended to increase by several percentage points in 2020.

However, the percentage of 9-7 grades in 2021 tended to increase in most subjects. Compared to the 9-4 chart, there were smaller increases in attainment between 2019 and 2020. Among these schools, there was a 2 percentage point increase in GCSEs graded 9-7 in all subjects combined compared to last year.
Variation between schools
Finally, we calculate the average point score (APS) per entry across all subjects for schools in 2021, which we compare to results from 2019 when public examinations last took place. We only include common subjects for each school, i.e. subjects for which there were entries in both 2019 and 2021.
In the chart below, we plot schools’ 2019 and 2021 APS per entry values. Schools with exactly the same APS in 2019 and 2021 will be plotted along the dashed diagonal line.
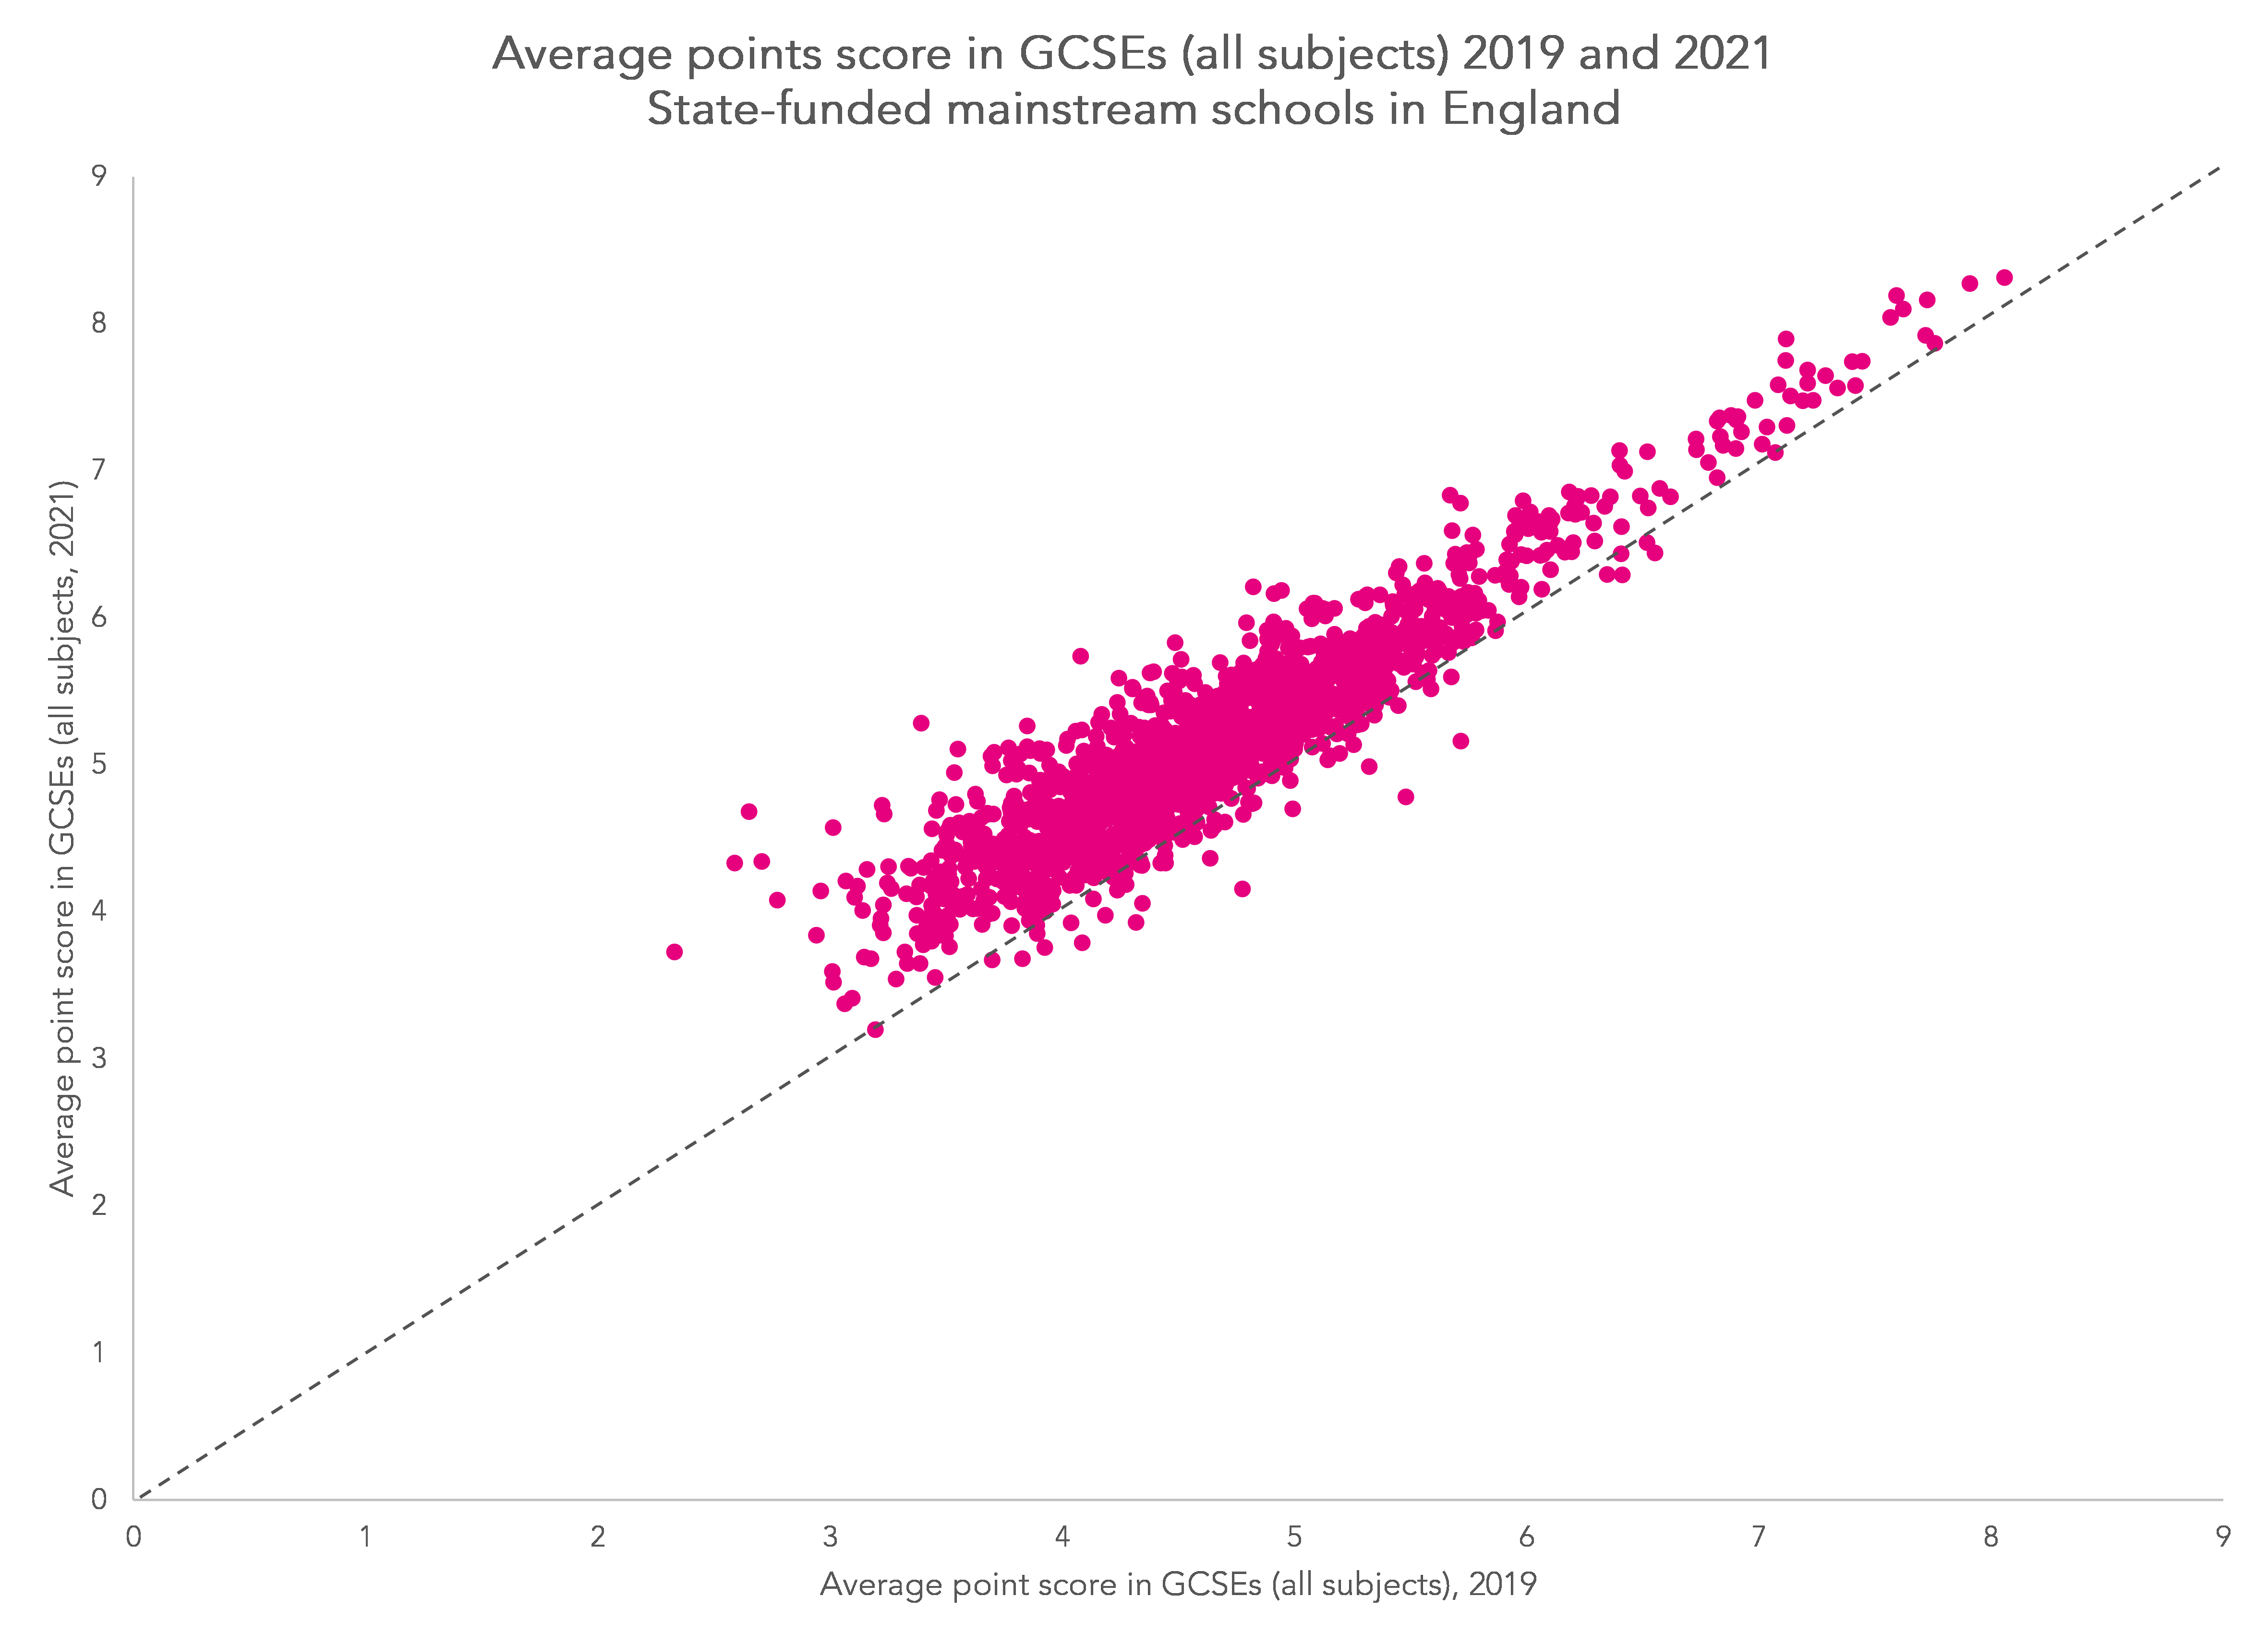
2021 results are strongly correlated with 2019 results (r=0.92). With a handful of exceptions, 2021 results are higher across the board. There is also some (slight) evidence of lower attaining schools in 2019 tending to have larger increases. This “regression to the mean” is to be expected.
As the chart below shows, the modal increase was between 0.4 and 0.5 points (i.e. between 40% and 50% of a grade). There was a change of more than one point in 6% of schools.

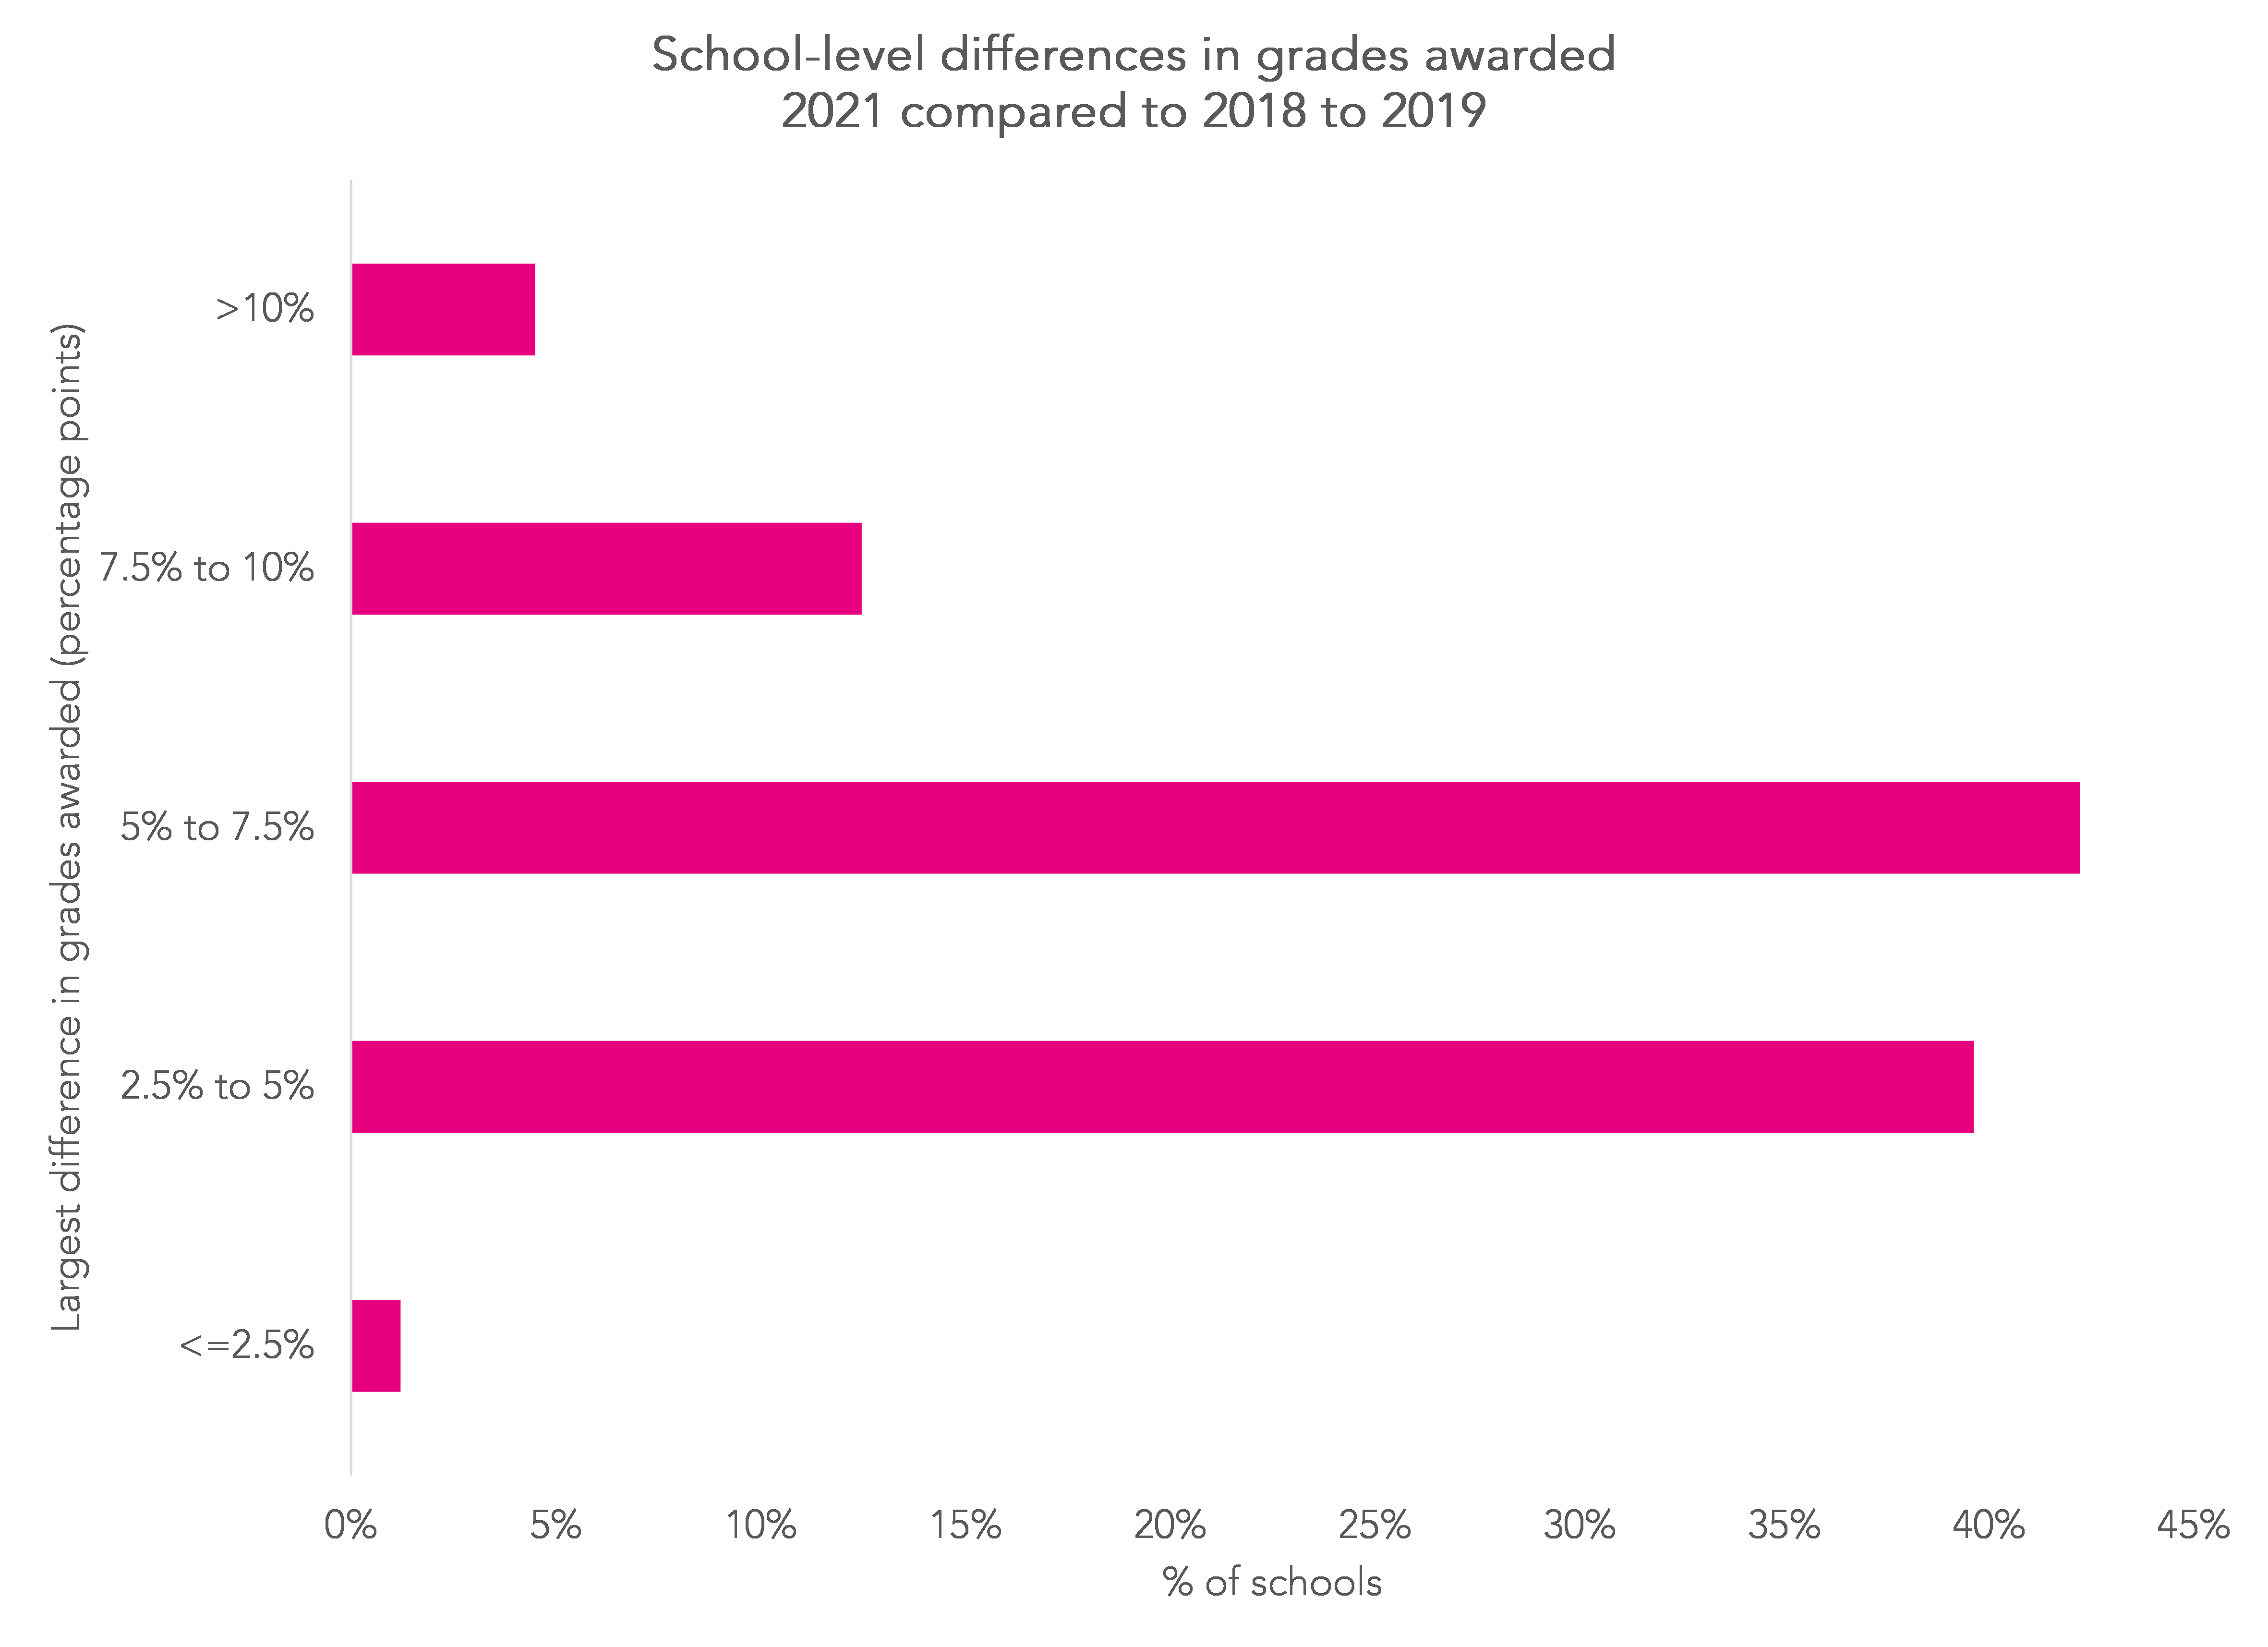
We know that the awarding bodies used a risk-based approach to their quality assurance. This included comparing the overall percentage of pupils at each grade in all subjects in 2021 to that in all reformed subjects in 2018 and 2019 combined. For example, comparing the percentage of entries graded 5 in 2021 with the percentage of entries graded 5 from 2018 and 2019.
This measure was calculated for each grade, and the largest difference found for each school.
Using the data we collected for 2021, we find that at most schools, the largest difference is between 2.5% and 7.5 percentage points. However, there were differences of more than 10 percentage points at 4% of schools.
Of course, we don’t know how this would have looked had we done a similar exercise and compared 2019 exam results to those from 2016 to 2017.
Summing up
If the preliminary TAG data we collected is indicative of the results submitted by schools, then we might expect this year’s results to be slightly higher than last year.
We know from yesterday’s coverage of A-level results that fewer than 1% of TAGs submitted were subsequently revised following external quality assurance undertaken by exam boards.
Larger numbers of changes would have been extremely unlikely since the amount of content covered will have varied from school to school. Similarly, the evidence collected from schools would have been produced at different times and under different circumstances. There probably wouldn’t have been much appetite to lower grades in any event following the experience with the algorithm last year.
Not only that, our analysis of attendance data shows that some pupils have missed far more than others in the same school. Consequently, the evidence on which grades are based may also vary from pupil to pupil in the same school. Some may have covered the content taught in greater depth than others.
There will be plenty time for a thorough post-mortem later. The aftershocks of the increase in results over the last two years will be felt for some time to come and there are already rumblings that grading may have to change in 2022.
The most important thing tomorrow is that pupils who have faced two years of learning disruption get the grades that enable them to move into appropriate post-16 study. Those who were unable to cover the full curriculum at Key Stage 4 deserve all the additional support they need over the next couple of years to compensate for the disruption.
We also owe teachers a huge debt of gratitude for the significant additional workload they took on this year in designing assessments, marking them, documenting what they did and finally awarding grades.
- Although some pupils were awarded their algorithmically determined grade if it was higher than their CAG
We’ll be publishing analysis of this year’s GCSE results on Thursday morning. Sign up to our mailing list to be notified about these blogposts, or check back here on the day.
In the meantime, take a look at our microsite, which allows you to explore trends in GCSE entries and attainment yourself.


Leave A Comment