Last week, the Department for Education published statistics on school absence in the Autumn term.
They corroborated what we said about attendance in secondary schools and in primary schools earlier in the term using data collected through FFT Aspire Attendance Tracker: older pupils and disadvantaged pupils had been particularly badly affected.
Aspire Attendance Tracker
Schools can track, analyse and compare their attendance data against 1,000s of other FFT schools using Aspire Attendance Tracker.
Log in to Aspire to access Attendance Tracker – log in here.
Not an FFT Aspire user? Learn more here.
Using data collected from 2,000 secondary schools we can now examine just how much school Year 11 pupils missed during the 2020/21 academic year. This may well have implications for the awarding of teacher assessed grades (TAGs) at GCSE this year.
And we can also show the variation in absence rates among Year 11 pupils this year. Some have missed a lot of school.
Absence levels have, unsurprisingly, been much higher than usual this year
First a definitional note. In the DfE stats, COVID absences are reported separately from other absences. We don’t make this distinction here, we look at all absences.
To set the scene, we first compare absence for 2020/21 up to May half-term with absence in all state-funded secondary schools in 2018/19. We exclude the period of national lockdown from January to March in the 2020/21 data.
 Across the board, we see absence of around double the 2018/19 rates, with Year 11 pupils absent for an average of almost 15% of sessions, the most of any year group.
Vulnerable pupils have higher levels of absence, on average…
We showed in our previous blogpost that disadvantaged pupils in Year 11 had missed more school in the Autumn term than their peers, and this remains true when we extend the time period to look at the full academic year. We now also look at pupils identified as having special educational needs (SEN.)
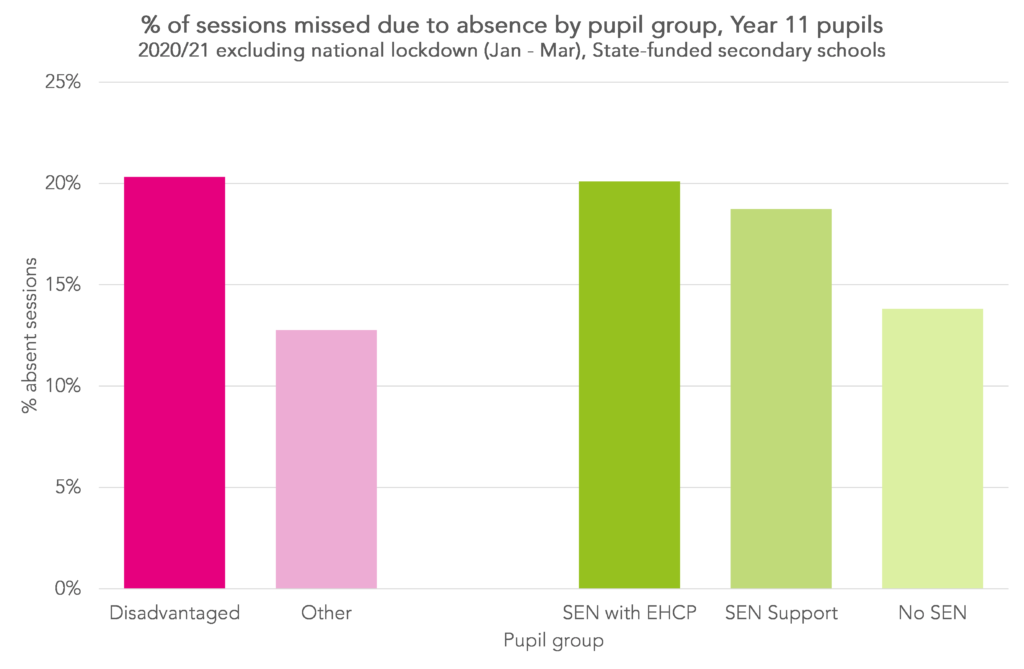
We find that Year 11 pupils with an education and health care plan (EHCP) missed around 20% of sessions, and those who receive other SEN support missed 19%, both more than the 14% of sessions missed by pupils with no SEN identified.
… and it’s not because they attend schools where absence is higher overall
We know that in any year, there is some variation in attendance levels between individual schools, and we’d expect this to hold true this year, if not increase.
The chart below shows variation in Year 11 absence rates between schools. A handful managed rates below 5% but the majority had absence rates between 5% and 20%. However, there were 17% with rates above 20%.

An important question which arises, then, is whether the gaps in absence levels we observe between vulnerable groups of pupils and their peers can be explained by these pupils disproportionately attend schools with higher rates of absence overall.
We find this to be somewhat true for disadvantaged pupils, though only around a tenth of the gap between them and other pupils can be explained by the absence rates of the schools they attend (so the vast majority of the gap is due to differences in absence rates between pupils in the same schools).
However, almost none of the gap for pupils receiving SEN Support can be explained this way, and pupils with an EHCP actually attended schools with lower rates of absence overall. All this is to say that virtually none of the gap in absence rates between pupils with SEN and their peers is due to the absence rates of the schools they attend, it is all due to pupils within the same schools missing more school, on average, if they have SEN than if they don’t.
Looking behind the averages: lots of vulnerable pupils have missed lots of school…
Up to now we have looked only at average absence rates but, as with all averages, these figures hide a lot of variation: some pupils in Year 11 this year have missed lots of school, and some hardly any.
Partitioning the variance in pupils’ absence rates, we find that 35% of the variance is between schools and the remaining 65% is within schools.
To dig into this further, we look first at pupils who have missed a lot of school and how this varies by disadvantage.

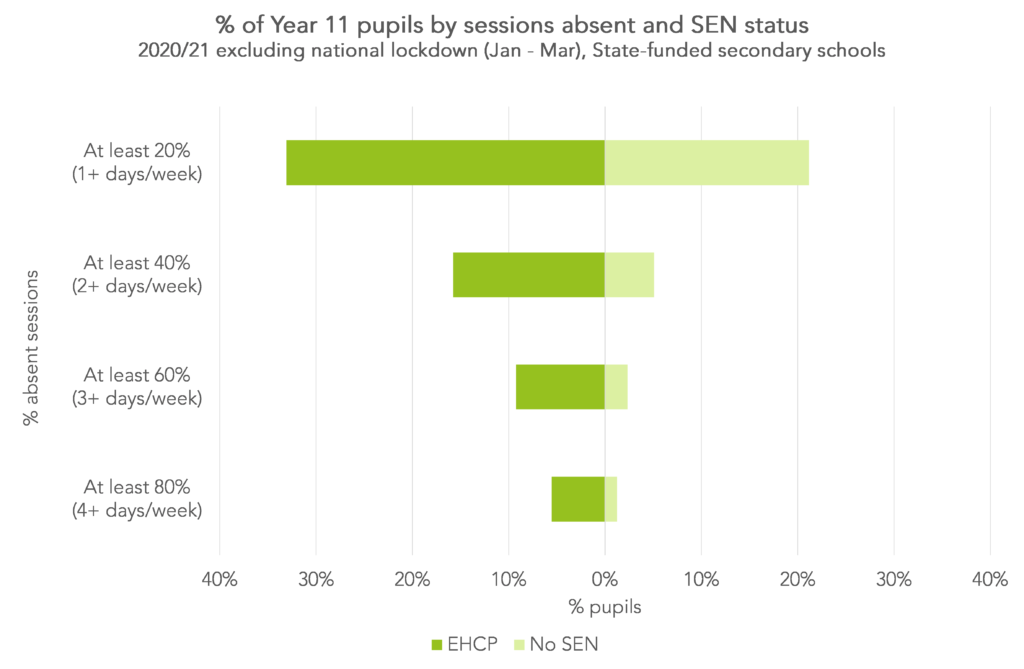
We find that, in general, disadvantaged pupils were much more likely to have missed a lot of school: twice as many disadvantaged pupils missed the equivalent of at least one day a week of school, on average, than their peers (37% vs 18%). Around one in eight disadvantaged pupils missed the equivalent of at least two days a week of school compared with one in 25 other pupils.
We see a similar pattern for pupils with an EHCP compared to those with no SEN, though the difference in pupils missing the equivalent of at least one day a week is smaller: those with an EHCP were around 1.5 times more likely to miss this much school than pupils with no SEN. The difference with the comparison group for at least two, three and four days a week is greater for pupils with an EHCP than for disadvantaged pupils, however.
For pupils who have missed the equivalent of at least two days a week, around a third of their absences were explained by illness or absences coded explicitly as COVID-related, with the rest a mixture of authorised and unauthorised absences. Pupils with an EHCP had a greater proportion of authorised absences, perhaps reflecting a greater need to shield, while the majority of disadvantaged pupils’ absences were unauthorised.
… but some have missed very little
Looking now at the other side of the coin: pupils who have missed very little school, which we define here as missing fewer than 5% sessions.
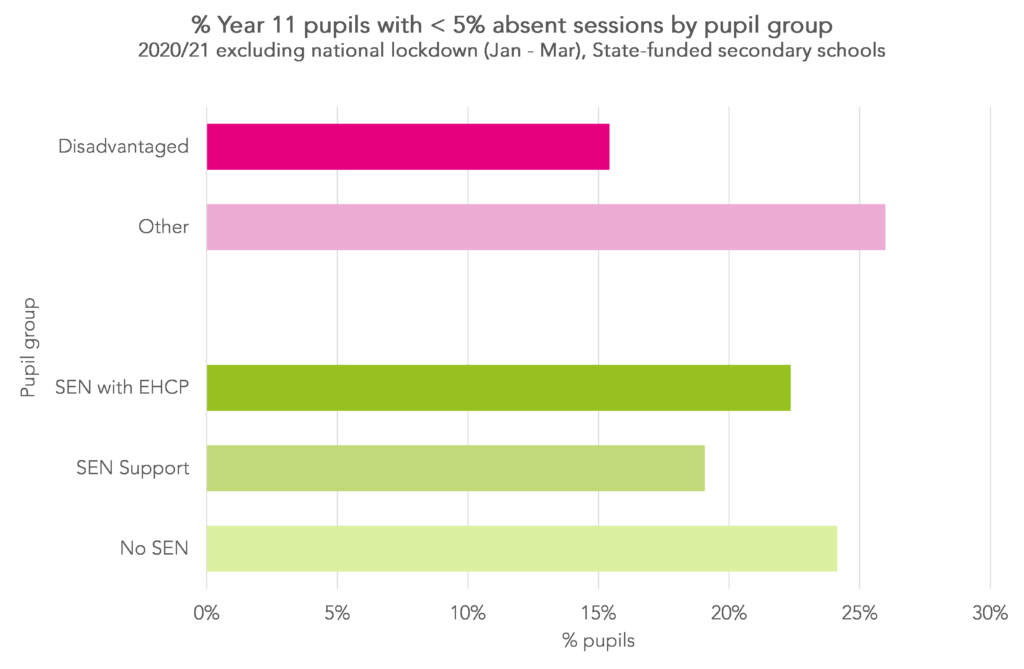
As expected, given our findings in the previous section, we see that disadvantaged pupils were less likely to be members of this low-absence group than their peers. Perhaps less expected, though, is that pupils with an EHCP are only slightly less well represented here than those with no SEN, given we know that they had a higher rate of absence, on average, than those with no SEN (and a similar rate to disadvantaged pupils, in fact.)
Summing up
The January to March lockdown period aside, the average Year 11 pupil in England missed 15% of school days this year due to COVID and other reasons. This is on top of the disruption they faced during the summer term last year.
However, this overall average masks substantial variation both between schools and especially between pupils. Even in the same school, there has been variation in attendance between pupils. Disadvantaged pupils have been particularly affected.
Although the JCQ guidance stresses that this year’s GCSE grades should only be based on content that has been taught, disadvantaged pupils may well have covered less content. This could have implications for post-16 courses.
Whether differential rates of absence have had an effect on GCSE grades and on the attainment gap for disadvantaged pupils we will discover in August.
Want to stay up-to-date with the latest research from FFT Education Datalab? Sign up to Datalab’s mailing list to get notifications about new blogposts, or to receive the team’s half-termly newsletter.


The point about some students having had their education interrupted comparatively little is important to keep in mind. What you haven’t unpacked here is regional variation linked to intensity of transmission and lockdowns. Would it be worth reviewing the data with Tiers in mind?
Hi Gemma. Thank you. There’s more to come on this. We’ll be updating a previous post showing the trends in absence by week similar to the previous post https://ffteducationdatalab.org.uk/2021/03/how-much-school-did-year-11-miss-in-the-autumn-term/ which shows how different regions were affected at different times in the Autumn term.
Dear Katie and Dave,
Thank you for this insight and analysis. The regional variations layered on top of the impact of disadvantage are extremely worrying in the context of both the teacher assessed grades this year and the current consultation for examinations next year. As a Virtual School Head I know that there will be another factor at play for children in care which will be instability in placements. For a cohort that can be potentially mobile in addition to the impact of covid absences (whether due to bubble collapse or staffing shortages as so many schools have experienced) teacher assessed grades based on the curriculum covered must surely put these young people at the most significant disadvantage. And, equally, how can any testing regime for an exam board that might cover regions with these huge variations in absence possibly be fair? Thank you again and looking forward to further analysis (I’ve also just seen the CiN/SEN/AP analysis which I will be studying in detail!) Thank you. Jancis