Once again, schools have been tasked with awarding grades to pupils in the absence of exams. This year, they have been asked to do so based on work produced by pupils, including in assessments currently being designed in schools up and down the country. This contrasts with the process last year when schools were asked to provide the grades they thought pupils would have achieved had exams taken place.
FFT 2021 GCSE Benchmarking Service
A range of subject and student based GCSE benchmarking reports to support schools prior to exam board submission. Simply upload your GCSE grades to Aspire and access your benchmarking reports the following day.
The service is now live and available to all Aspire secondary schools – log in here to access.
The JCQ guidance for schools advises them to benchmark their grades to historical outcomes from 2017 to 2019 (two to four years earlier) but makes it clear that this should be part of the internal quality assurance process rather than determine a student’s or a centre’s outcomes this summer. Today we launch our GCSE benchmarking service to support schools in doing so.
But this does beg the question of how similar we might expect GCSE results to be to those from two to four years earlier.
In this blogpost, we take a look at how closely GCSE results from 2019, the last year exams took place, compare to those from 2015 to 2017.
The data we use
We use published DfE datasets containing results in GCSEs and other qualifications although there are some issues using these for the purpose we intend. Firstly, they include multiple entries per pupil.
We include reformed GCSEs, legacy GCSEs, level 1 and level 2 certificates and double GCSE (basically anything that has 9-1 or A*-G grading structure). Because we include different grading structures, we focus on the key grade thresholds at C/4 and A/7.
For each school, we include subjects if they had more than five entries every year between 2015 and 2017 and in 2019. We also account for changes in subjects offered during this time by linking together analogous subjects [1].
Of the 3209 schools and colleges with KS4 data in 2019, we analyse the results of the 2939 schools a) for which we had all three years of data 2015 to 2017 and b) had at least 60 pupils in 2019.
Correlations at subject level
First of all, we examine how well results in 2019 correlated with the three-year average for 2015 to 2017. We do this using data for each school in each subject at both grades C/4 and grades A/7. In the charts below, we show how these correlations are related to cohort sizes using the mean number of entries at schools in 2019 [2]. Some subjects are named on the charts for illustrative purposes. The data for all subjects can be found in the appendix.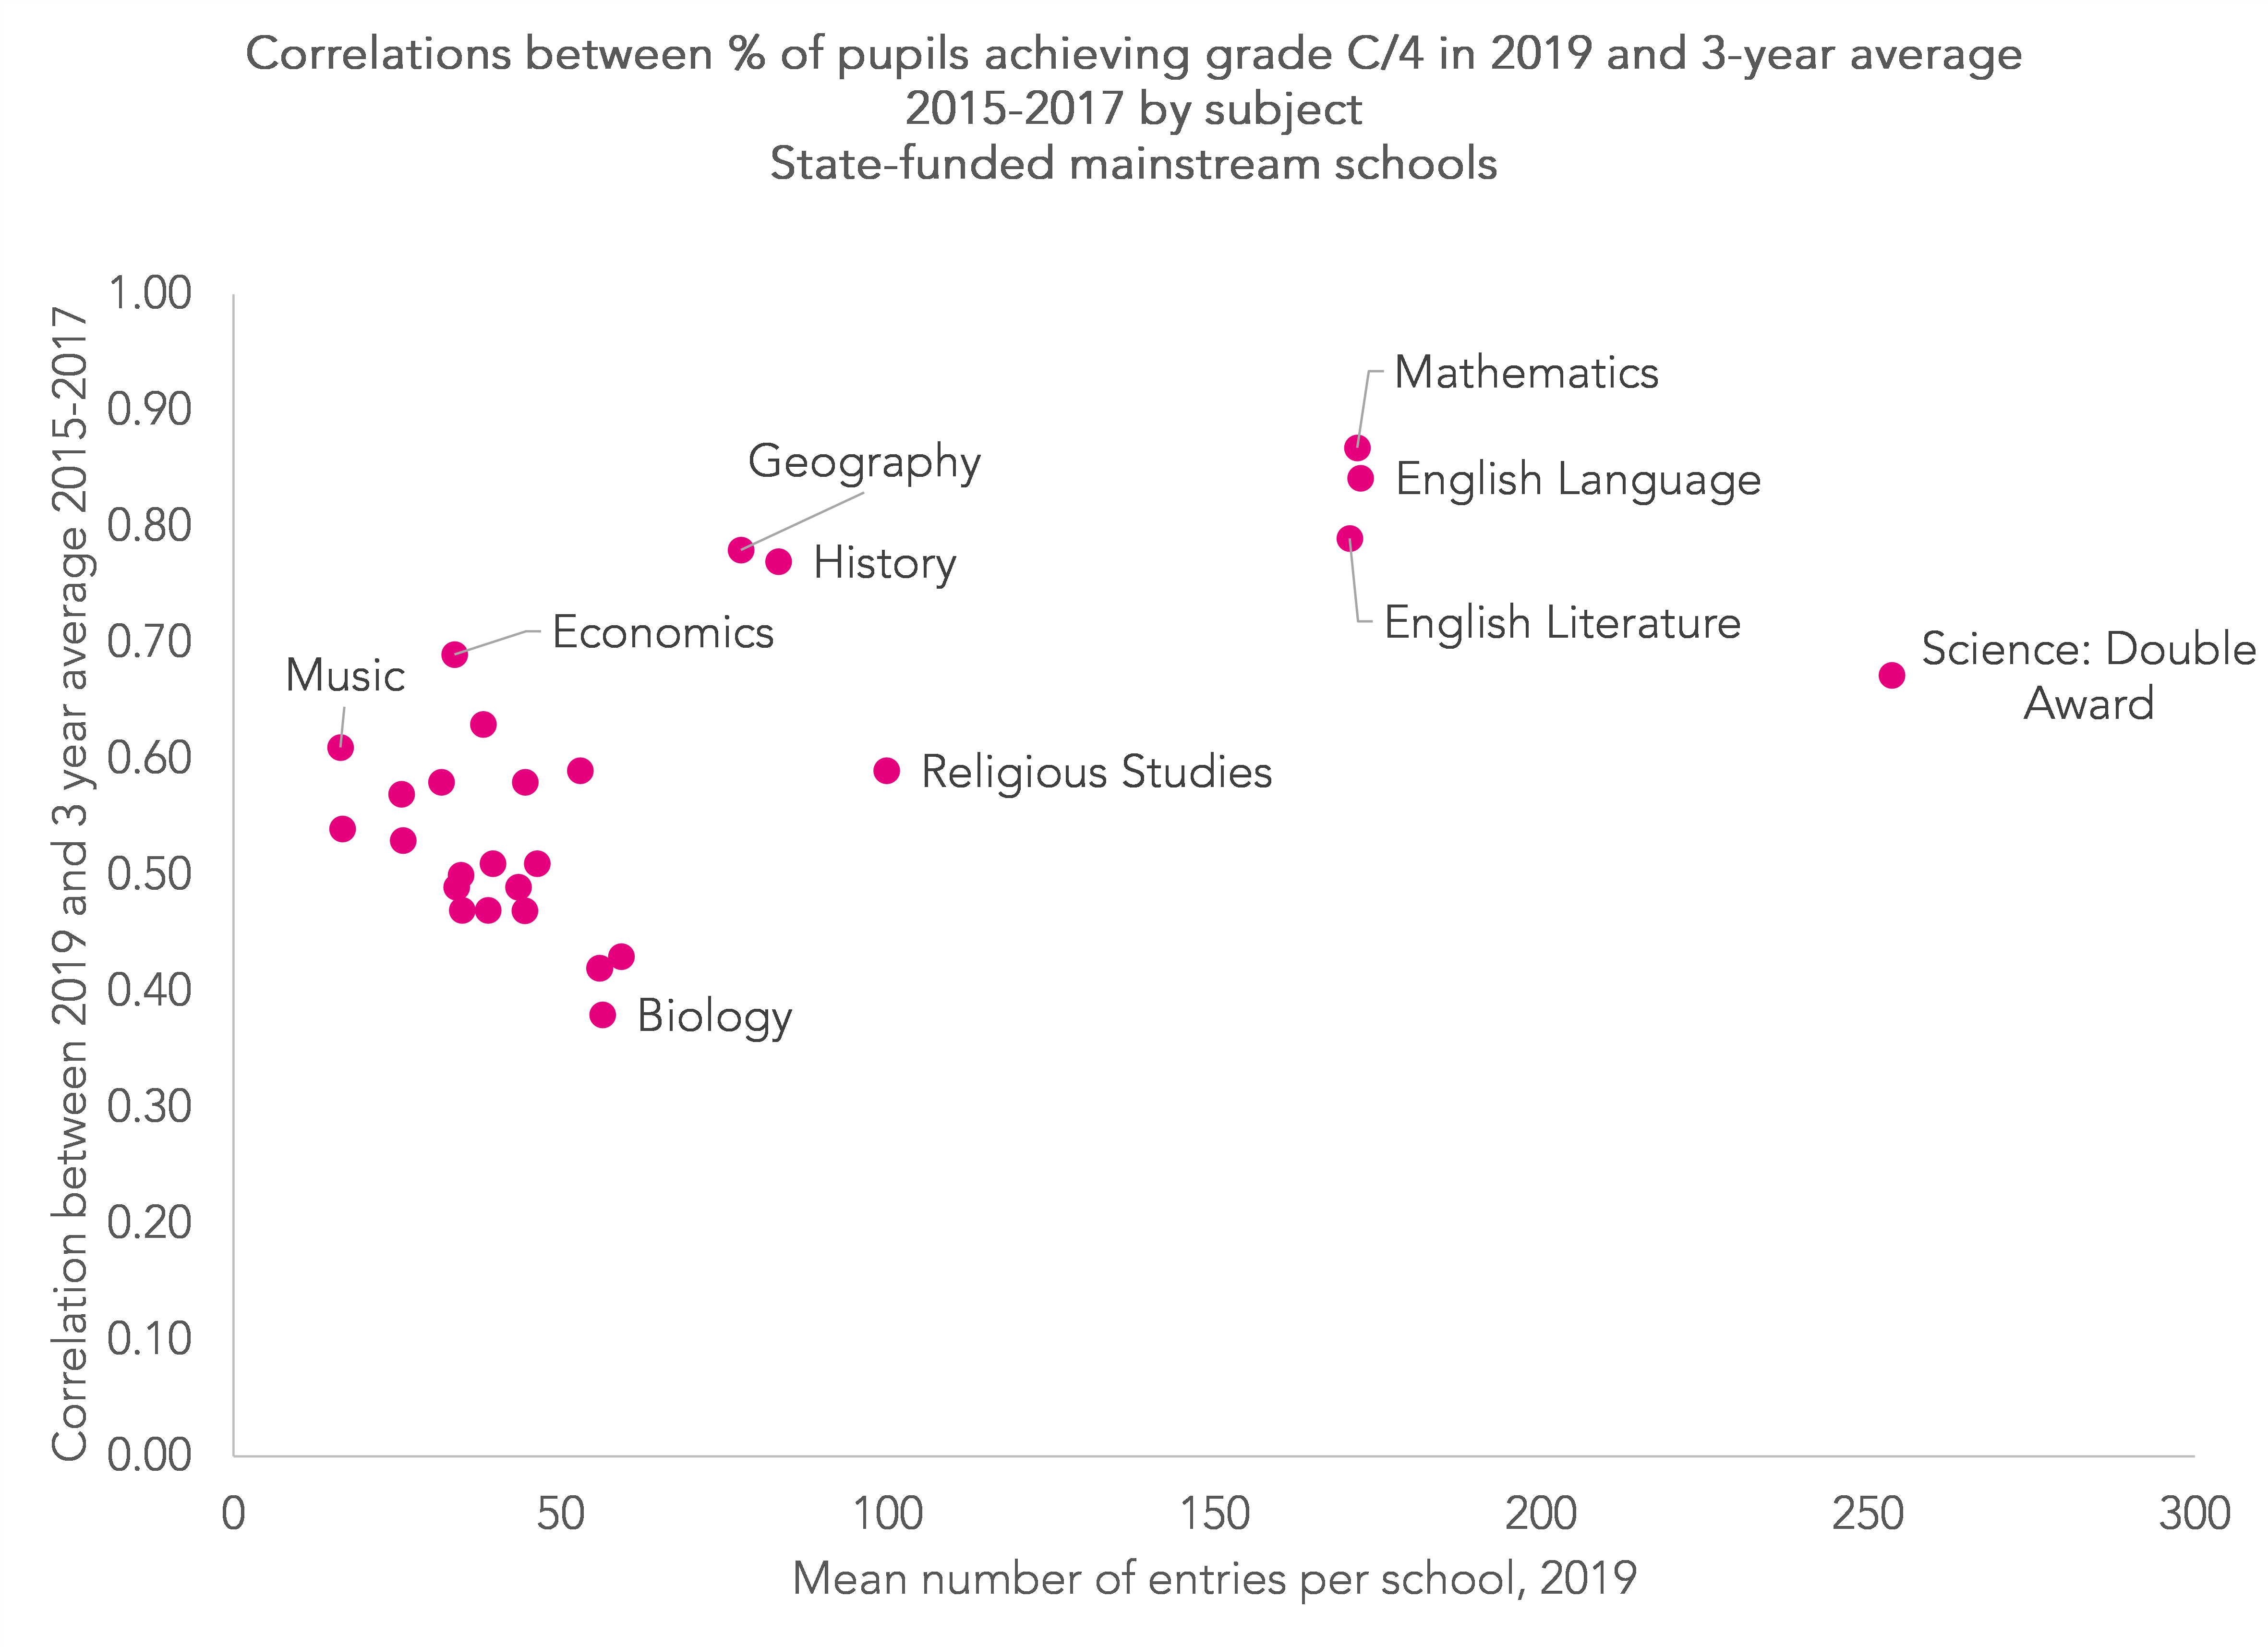
The correlations at grade 4/C tend to be higher in the subjects with larger numbers of entries, particularly English and maths. Correlations in some subjects, including biology and other triple sciences, tend to be much lower. Changes in entry policies (e.g. shifting from triple to double science or vice versa) may explain some of this. In short, the past may not be a guide to the present in some subjects.

Correlations between present and past results tend to be higher at grades A/7. The historical data may be a more useful guide at this threshold, again in the subjects with higher numbers of entrants.
Correlations in all subjects
JCQ also recommends that schools compare results for the school as a whole (in all subjects) to historical results.
The chart below shows the extent to which 2019 results at grade 4/C or above differed to the three-year average for 2017 to 2019.
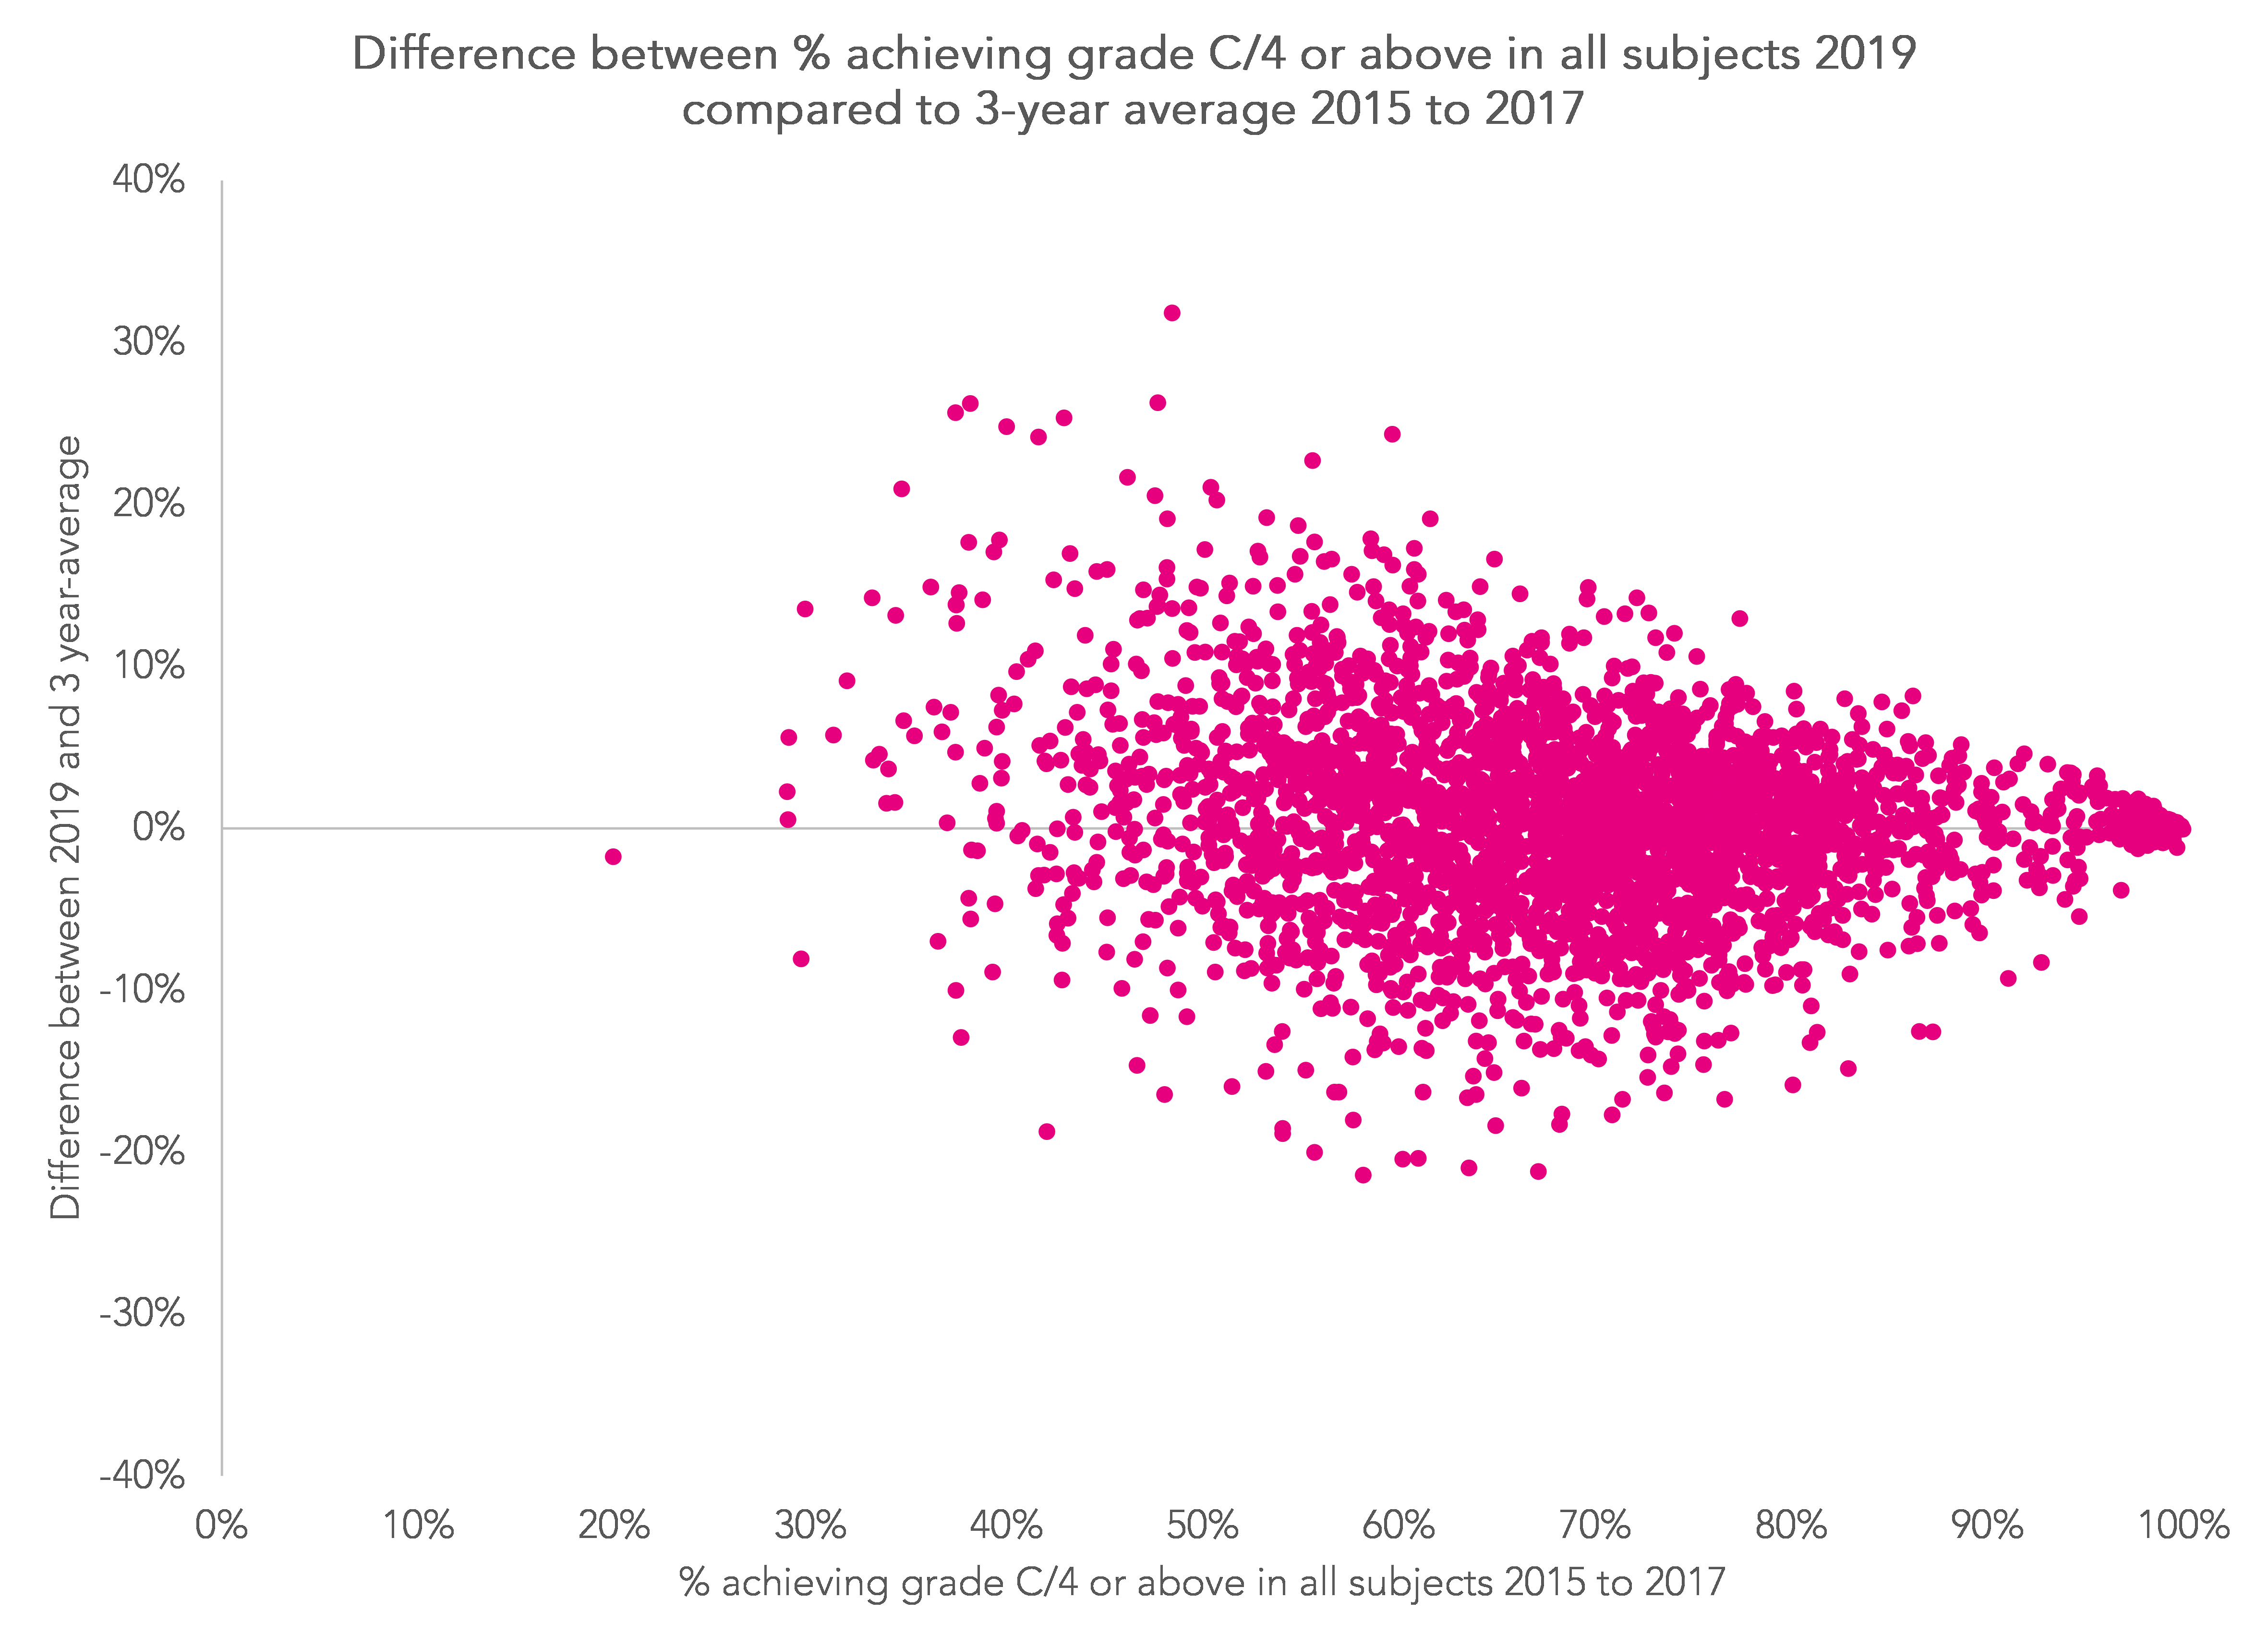
There is some slight regression to the mean – lower attaining schools will tend to improve- but the correlation between the two measures is only slight (r=-0.1). There tends to be less variability among higher attaining schools (although it’s hard to improve beyond 100%!).
But overall, the correlation between 2019 results and the three-year average for 2015 to 2017 stands at 0.9 at grade 4/C and 0.95 at grade 7/A. This is higher than any of the subjects individually although maths comes very close.
Finally, we look at the extent to which 2019 results for all subjects combined differed compared to the three-year averages from 2015 to 2017.

At the vast majority of schools, 2019 results were within five percentage points of the 2015 to 2017 three-year averages, particularly at grade 7/A and above. Changes of more than ten percentage points were rare.
The appendix contains further information about individual subjects, including the proportion of schools where 2019 results were within five percentage points of the three-year average and the proportion of schools where 2019 results were between the lowest and highest annual values 2015 to 2017. This tends to occur in around half of schools in most subjects.
So what do we make of all this?
Looking at GCSE results from 2017 to 2019 might give schools a sense of the sorts of outcomes they would have achieved if COVID had never happened, exams had gone ahead this year, and grading standards remained similar.
If COVID hadn’t happened, we might have expected overall attainment at grade 4+ and grade 7+ across all subjects to be similar to results from two to four years earlier in most schools, and perhaps a little higher for schools that were lower attaining in the past.
Results in individual subjects tend to be more variable, particularly where cohort sizes are small. Some of this variability arises due to measurement error – measuring attainment is not a precise science – and larger cohorts and aggregating across multiple subjects cancels out at least some of this.
No doubt this is why Ofqual and the awarding organisations have decided to focus on attainment in all subjects combined when quality assuring this year’s teacher assessed grades.
And what if overall attainment seems much higher this year than in the past? The JCQ guidance suggests carrying out a review in one or more subjects. This year’s benchmarking reports can help with some of this, showing changes in cohort prior attainment compared to 2019 and 2020, for example. But do bear in mind that variability will arise due to imprecision of measurement, particularly in small cohorts. There’s not much we can do to show you the effect of that.
[1] The way some qualifications were recorded changed during this period. For example, double award science replaced core and additional science, the GCSE in combined English language and literature was withdrawn, a new Food and Nutrition GCSE was introduced to replace Food Technology and a range of D&T subjects were brought within a D&T umbrella.
[2] Double award science is counted as two entries
Want to stay up-to-date with the latest research from FFT Education Datalab? Sign up to Datalab’s mailing list to get notifications about new blogposts, or to receive the team’s half-termly newsletter.


Can I ask a question re how the 5% is calculated for the last graph?
if a school historically got an average of say 20% grade 7+, are you saying they would be within 5% points if they got between 15% and 25% grade 7+, or is the 5% calculated based on 5% of 20% which would require a much tighter spread of between 19% and 21%?
Hi Caroline. It’s the former. Within 5 percentage points.
An interesting analysis.
I’m surprised by how low the proportion is of schools with 2019 results within the highest and lowest 2015 to 2017.
Am I reading that correctly? Only 43% of schools had a %4+ across all subjects in 2019 that was between 2015-2017 results? That would suggest we should expect the majority of schools this year to have a %4+ across all subjects beyond 5% of the highest and lowest between 2017-2019. Considering that anomalous changes will trigger an external review, this may mean quite a few reviews!
Apologies! Typo:
An interesting analysis.
I’m surprised by how low the proportion is of schools with 2019 results within the highest and lowest 2015 to 2017.
Am I reading that correctly? Only 43% of schools had a %4+ across all subjects in 2019 that was between 2015-2017 results? That would suggest we should expect the majority of schools this year to have a %4+ across all subjects beyond the highest and lowest between 2017-2019. Considering that anomalous changes will trigger an external review, this may mean quite a few reviews!
Hi James. Thanks for the question. Yes, that’s correct. 43% of schools achieved %4+ across all subjects that was between 2015 and 2017 percentages.
Why does benchmarking compare 2021 TAGs with 2019 results and not an average of 2017-2019?
Hi Kristian. It’s mostly because we’ve only got a single year (2019) of 9-1 GCSEs in some subjects.