Aspire Attendance Tracker
Schools can track, analyse and compare their attendance data against 1,000s of other FFT schools using Aspire Attendance Tracker.
Log in to Aspire to access Attendance Tracker – log in here.
Not an FFT Aspire user? Learn more here.
As we approach the long-awaited October half term we thought it would be a good time to reflect on pupil attendance for the year so far. (And provide some recreational reading for those of you enjoying your breaks already.)
Here at Datalab we are lucky enough to have access to attendance data for around 2,400 secondary and 4,600 primary schools who subscribe to Aspire Attendance Tracker. Let’s take a look at what it’s been telling us so far this year.
Absence by year group
To start, we’ll take a look at how absence varied by year group so far this year (up to the end of last week, 15th October 2021).
We’ll compare it with the same time last year to see if the official end of “bubbles” has had an impact. And we’ll compare with Autumn term 2019[1] to see how far from “normal” we still are.
In the charts we split absences into “COVID” (light shading) and “Other” (dark shading). We adopt the DfE definition for these categories (more on this later).
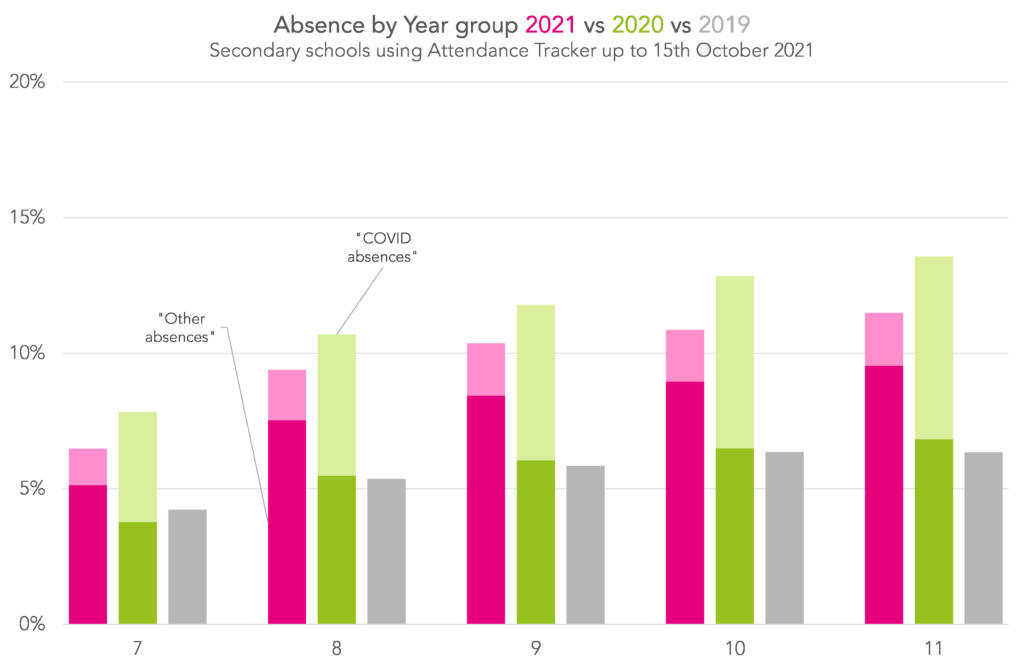
The good news is that absence is down on last year for every year group. Overall, secondary school pupils have missed 9.7% of sessions so far this year compared with 11.3% at the same point last year. There is, however, a rise in “other” (i.e. non-COVID-related) absences. We’ll talk more about this at the end of the post.
The bad news is that this is still a long way above pre-pandemic levels. In Autumn term 2019, pupils missed an average of 5.6% of sessions, around 40% fewer than the 9.7% missed so far this year.
We can certainly see the impact of the removal of the “bubble” system too. This time last year 5.6% of sessions were missed due to COVID isolation. This year it’s only 1.8%.
As was the case last year, Year 11 have missed more school than any other year group. Their 11.5% of sessions missed is better than last year’s 13.6%, but still almost double 2019’s 6.3%.
Absence by region
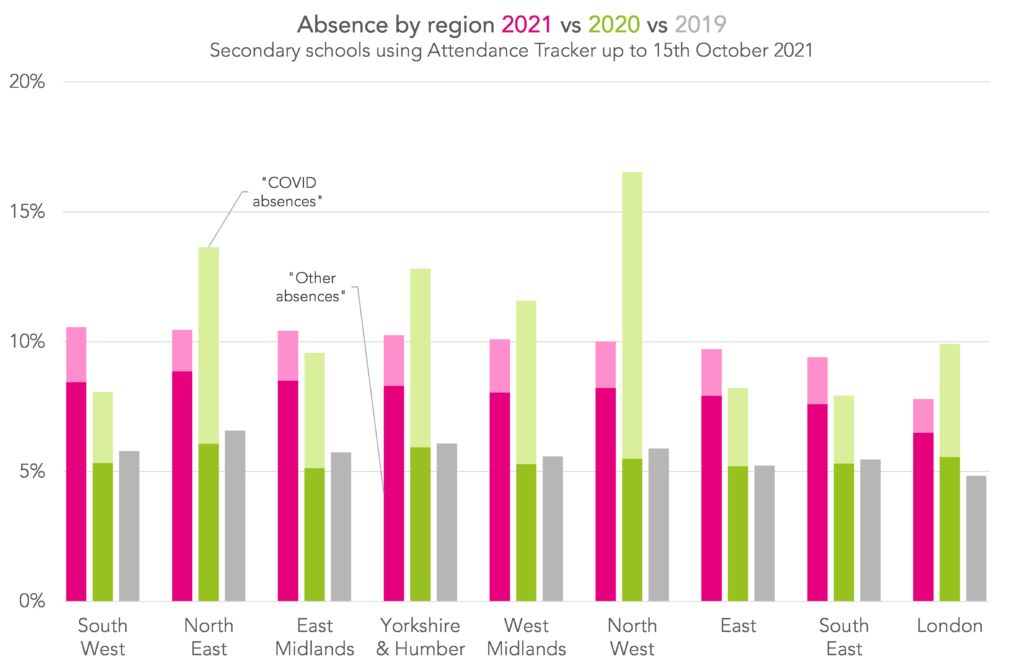
Overall, perhaps with the exception of London, we see absences spread out across the country much more evenly this year compared with this time last year[2].
Four of the nine regions have seen more absence so far this year, while five have seen fewer.
Most notably, the North West has seen absence reduce from 16.5% last year to 10% this year: a drop of around 40%. Meanwhile, the South West, which had one of the lowest absence rates of any region this time last year at 8.1% now has the highest at 10.6% (though note that the top 7 regions are all within 1 percentage point of each other).
In general, those with the highest proportions of pupils absent due to COVID isolation last year have seen decreases in absence, and vice versa.
All regions are seeing absence rates between 50% and 80% higher than pre-pandemic levels.
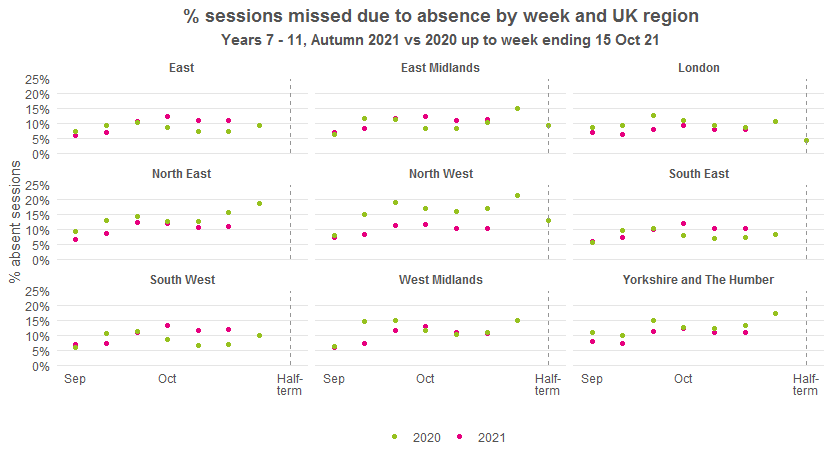 Looking at weekly absences[3], we see broadly similar patterns across the regions this year: a rise in absence in the first three weeks of term followed by three weeks of absences hovering around the 10% mark.
The regions where absences have increased overall this year seem to have had below average rates of absence in October last year.
COVID and non-COVID absences
When we looked at the data by year group and by region, you probably noticed that “COVID absences” have gone down a lot, while “Other absences” have gone up a lot.
This might lead you to conclude that there has been a massive rise in pupils missing school for reasons not directly related to COVID.
This may be true to an extent. However, DfE guidance asks schools to record pupils who are off school with a positive COVID test as ill rather than unable to attend due to COVID[4].
This means (bizarrely) that pupils who are off with COVID are likely to fall into the “Other absences” category. The “COVID absences” category mostly contains pupils isolating while they await a test result.
All this is to say that a lot of the rise in “Other absences” compared with last year is likely due to the greater number of pupils testing positive for COVID than a large rise in other, unexplained absences. We’ll be digging into this more in a future blog post.
Conclusions
Absence in secondary schools has improved compared with last year. Mostly due to a big reduction in pupils isolating at home. The regional picture has become much more even, but large differences between year groups persist.
Pupils are still missing school at a much higher rate than they were before the pandemic. The reasons for this are difficult to disentangle, but we’re going to have a go anyway in a future post. Watch this space…
[1] As we don’t have access to weekly absence data for 2019, we’re using the whole of Autumn term
[2] Remember that the “this time last year” picture here pre-dates the alpha variant which caused huge increases in absences across London and the South East towards Christmas. (And the delta variant which did the same in the North East in July)
[3] I’ve cut off the first week of September here due to phased returns distorting the figures
[4] There’s no implication of anything nefarious going on here – it’s been this way throughout the pandemic
Want to stay up-to-date with the latest research from FFT Education Datalab? Sign up to Datalab’s mailing list to get notifications about new blogposts, or to receive the team’s half-termly newsletter.


Leave A Comment