One of the most exciting developments in recent years in government data resources available to researchers has been the Longitudinal Education Outcomes (LEO) dataset.
This brings together data on post-school education (in colleges and universities) with data on employment, earnings and entitlement to state benefits.
By linking LEO data to the National Pupil Database (NPD), the longer-term effects of educational policies, choices and decisions can be evaluated.
We’ve been involved in the development of LEO for a number of years: you can see some analysis from an earlier pilot here. And over the last few years, we’ve been part of a larger pilot with some other organisations exploring the potential uses of linked NPD and LEO data.
Up to now, perhaps the most widely-known application of LEO data has been to estimate the returns to higher education.
But one of the major advantages of administrative data resources such as this is to examine the longer-term outcomes of small subsets of the population, particularly those from vulnerable or marginal groups who may not be particularly well covered by other datasets (e.g. survey datasets).
In this blogpost, we introduce the work we’ve been doing examining the longer-term outcomes associated with exclusions and alternative provision. We also provide links to more detailed analysis.
Setting the scene
We already know a bit about outcomes for pupils who have spent time in alternative provision (AP) during their school careers or have been permanently excluded. DfE data shows that in 2019, only 4.3% of pupils who finished Key Stage 4 in state-funded AP schools achieved GCSEs in English and Maths at grades 9-4 compared with 64.6% in mainstream and state-funded special schools. And in work published last year we saw that around 36% of those who experienced AP by the age of 16 remained in education in the summer they turned 17. The figure for those who never experienced AP was 82%.
But we know much less about the longer-term outcomes of these pupils, and next to nothing about their outcomes outside of education, for example, at what rate they enter employment.
In the full report we use the linked NPD-LEO data to look at the outcomes of five birth cohorts of pupils, born between 1st September 1993 and 31st August 1998. In this post I’ll mainly focus on one cohort: those who turned 16 in the 2012/13 academic year. For most, this was the year they completed Year 11.
Some context
Being on the roll of an AP school is a relatively rare event, as is being permanently excluded. We saw in our previous work that between three and four percent of young people in a birth cohort of around 650,000 young people had experienced an AP placement by the time they were 16, and around 1% had been permanently excluded.
Although the numbers of pupils we’re talking about are relatively small, the proportions from vulnerable groups are high. Below I summarise selected characteristics among pupils who experienced AP (ever AP) or permanent exclusion (ever PEX) during their school career, and compare with pupils who experienced neither. For this we use all five cohorts – around 3.6 million pupils.
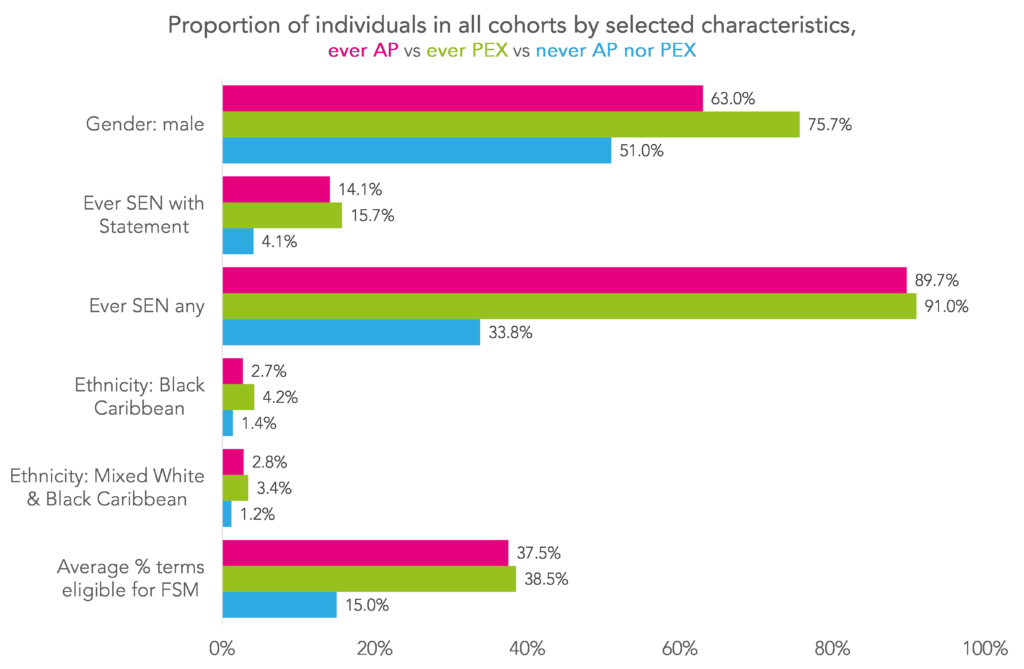
Around 90% of pupils who had experienced AP or permanent exclusion had also had an identified special educational need (SEN). This compared with 34% of those who experienced neither. They were also much more likely to be male, from a black Caribbean or mixed white and black Caribbean background, and spent more of their school careers eligible for free school meals (FSM) on average.
Individuals observed in any positive destination
To get a simple overview of long-term outcomes, we construct a measure: “observed in any positive destination”. Anyone who is observed either studying (in schools, colleges or higher education) or in employment for at least 180 days in an academic year is deemed to be in a positive destination.
Below, we summarise this measure for the years in which individuals in the 2012/13 cohort turned 19 and 21.
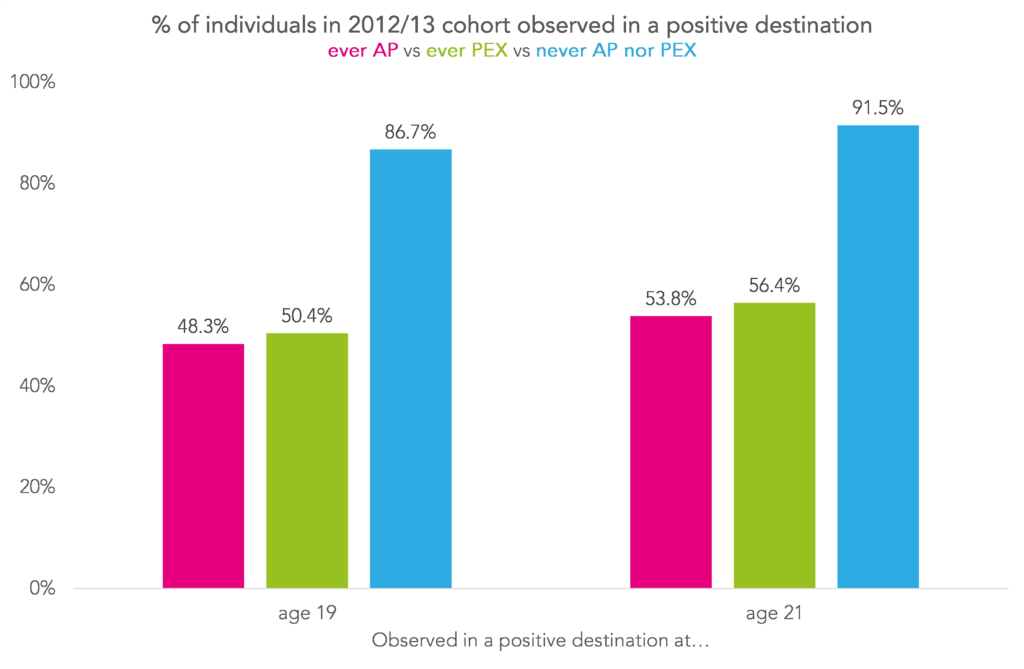
Those who experienced AP or permanent exclusion were much less likely to be observed in a positive destination than those who experienced neither. 48.3% of those who experienced AP and 50.4% of those who were permanently excluded were observed in a positive destination at age 19 compared with 86.7% of those who experienced neither.
At age 21, 53.8% of those who experienced AP and 56.4% of those who were permanently excluded were observed in a positive destination, compared with 91.5% of those who experienced neither.
Qualification rates
Typically, we rely on end of Key Stage data releases to assess the proportion of pupils who achieve certain qualifications. This is limiting for several reasons. Among them the fact that just because pupils don’t achieve a qualification by the end of a Key Stage doesn’t mean they never do. With LEO, we’re able to see the qualifications individuals have achieved by the time they’re a particular age.
Below, I plot the percentage of pupils who achieve the equivalent of 5 GCSEs at A*-G (9-1), 5 GCSEs at A*-C (9-4) and 2 A levels at A*-E by the time they reach the ages of 16, 19 and 21.

We can see that the qualification rates for all individuals increase with age. But, as with the positive destination measure, we see worse outcomes for the ever AP and ever PEX groups at every age. For example, by age 19, around 85% of those who never experienced AP or permanent exclusion achieved the equivalent of 5 GCSEs at A*-C. Among those who did experience AP or permanent exclusion, the figure is around 28%. And only 12% of the ever AP group and 9% of the ever PEX group achieved the equivalent of two A levels by 21.
Other outcome measures
To finish, we consider a range of other outcome measures. Below we show average daily earnings (in 2015 prices), rates of receipt of in- and out-of-work benefits, and rates of custody experience for the individuals in the 2012/13 cohort at age 19.
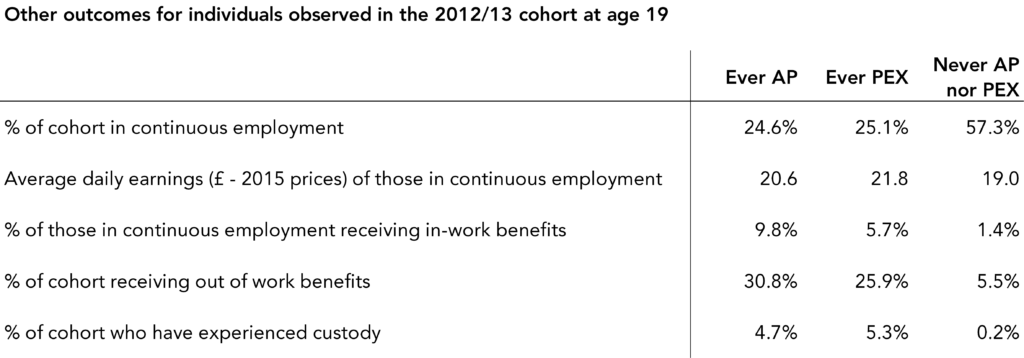
We see that those who experienced AP or permanent exclusion were much more likely to be in receipt of in-work and out-of-work benefits and to have experienced custody. The biggest proportional difference is in the latter measure: around 5% of those who had experienced AP or permanent exclusion during their school careers had experienced custody by the age of 19. For those with no history of AP or permanent exclusion, the figure is 0.2%.
One result that might be unexpected is that individuals in the ever AP and ever PEX groups were paid more at age 19 than the never AP nor PEX group. However, because we’re missing the crucial context of the number of hours worked, this doesn’t mean much. Many individuals, for example those in higher education, aren’t fully in the labour force at age 19.
A note about attrition
All longitudinal studies suffer from attrition, or “drop-out”. Beyond a certain point, there are some individuals who we stop observing in the data. This happens for a variety of reasons, including migration and, in rare but tragic cases, death.
In this study, we had a particular problem with attrition due to the phased introduction of Universal Credit (UC). The version of LEO we used contained data on the old “legacy” benefits, but not on UC. So individuals who were in receipt of UC and not working or studying would not be observable in the data, and therefore deemed to have dropped out.
You can read about how we addressed this in the report. But the impact of it is that the gaps we found between those who experienced AP or permanent exclusion and those who experienced neither are likely to be understated.
Summing up
We already knew from previous work that outcomes for pupils who experience AP or permanent exclusion tend to be poor at the end of compulsory schooling.
This shouldn’t be seen as an issue with the quality of AP schools. The outcomes each young person achieves within the AP sector may represent significant achievements given the factors that led to them accessing AP in the first place.
But relative to the general population, the outcomes for this group of young people are poor and persist into early adulthood. Improving their post-16 (and beyond) employment and education prospects ought to be a policy goal.


An interesting summary. Questions/issues that could be raised include:
Is alternative provision (AP) successful in preparing students for life/work/careers?
Is AP actually an alternative form of provision or does it suffer from trying to achieve the same goals as the mainstream provision, i.e. examination success and in doing so does it just reaffirm student self-beliefs?
Does exclusion (EX) create a long-term negative impact on self-belief?
Is it not that the outcomes are a result of what happens to the students as a direct result of their experiences etc during AP or EX but instead the labelling that is applied to the students and how that label is perceived by employers etc?
Are students actually prepared to ‘survive’, to combat any perceptions and negativity that may get applied to them once they have been in AP or EX or are they seen as ‘fixed’ and expected to function as those who have not experienced either?
Lots to unpick!