Earlier this month the DfE published provisional Key Stage 2 attainment statistics. The big story was the widening of the disadvantage gap, which we dug into a little here.
Today we’re going to look at the relationship between attainment and absence.
We use KS2 data submitted to us by schools via the Early Results Service, and link it to attendance data from Attendance Tracker. This covers around 127,000 pupils in around 2,500 schools.
The gap in scaled scores
Let’s start by looking at the raw gap in average scaled score between disadvantaged pupils and their peers. We’ll also compare with results nationally to gauge how representative our sample is. Here and throughout, we exclude those working below the level of the tests.
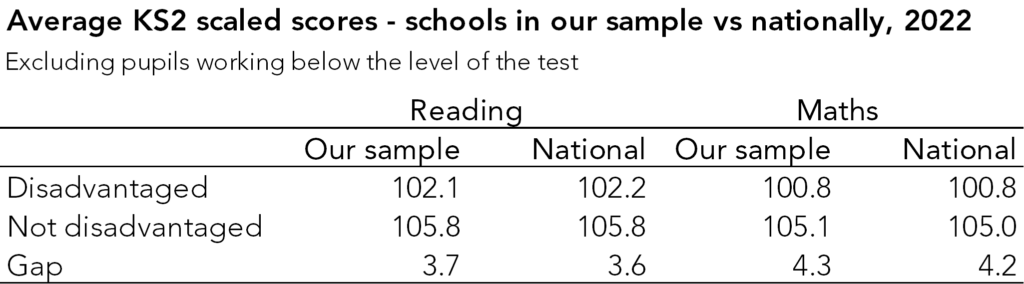
The results for pupils in our sample are almost identical to those nationally. In our sample, there was a gap of 3.7 points in average reading scaled score between disadvantaged and non-disadvantaged pupils compared with 3.6 points nationally. And for maths the gap in our sample was 4.3 points compared with 4.2 points, nationally.
The role of absence
We know from our previous work that disadvantaged pupils were more likely to have missed a lot of school over the past two years. So how much of the gap we see is related to this?
To answer this question we construct a simple pupil-level regression model, with scaled score regressed on disadvantage and the percentage of sessions missed[1] in year 6. This allows us to split the disadvantage gap into a component which is related to differing absence rates and a component which isn’t.
Let’s look at the results:
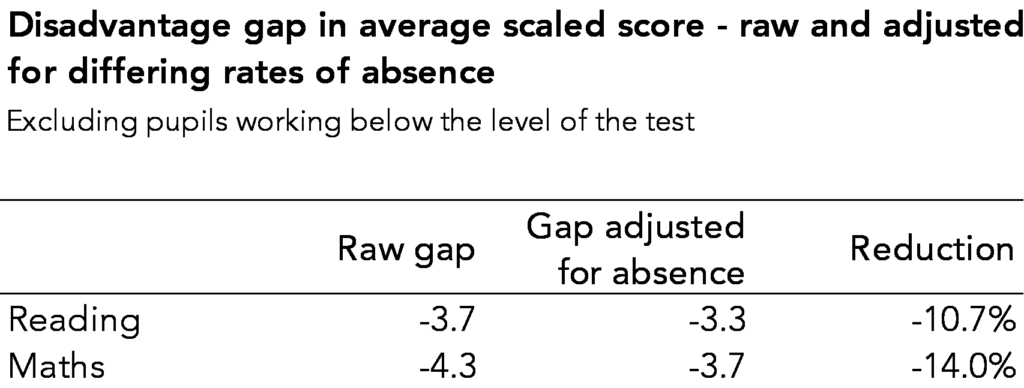
With absence in our model, the disadvantage gap reduces to 3.3 in reading and 3.7 in maths, a reduction of 11% and 14%, respectively.
The role of schools
We know that the population of disadvantaged pupils is not spread out evenly between schools. Maybe some of the disadvantage gap could be accounted for by disadvantaged pupils clustering in schools . So we add the school attended by each pupil into the model[2].

Doing this reduces the gap further, to 2.8 in reading and 3.2 in maths. Compared with the raw gap, it’s a reduction of around 25% in both subjects.
Back to the role of absence
First, let’s eyeball the data.
In the charts below, we show the smoothed relationship between Year 6 absence and mean scaled score in reading and maths for disadvantaged pupils and non-disadvantaged pupils separately. Relatively few pupils missed more than 60% of sessions so we truncate the horizontal axis and concentrate on the area in which the vast majority of pupils are located.
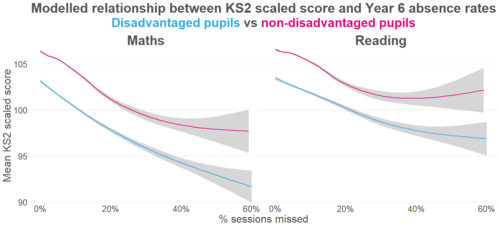
Disadvantaged pupils tend to achieve lower scaled scores than non-disadvantaged pupils with the same level of Year 6 absence. However, the gap appears to widen as absence increase.
The slopes of the lines indicate that there’s a stronger relationship between absence and KS2 score for maths than reading. That said, the correlation between absence and attainment is fairly weak: -0.15 for reading and -0.23 for maths.
Put another way, the average non-disadvantaged pupil would have the same KS2 reading score as a disadvantaged pupil whose absence rate was around 15 percentage points lower. And the same KS2 maths score as a disadvantaged pupil whose absence rate was around 20 percentage points lower.
The role of school absence
To finish off, we add one more variable into our model: the absence rate of all year 6s in the school a pupil attends. (This doesn’t change the size of the disadvantage gap because we already included pupils’ schools in our model.) Here are the results:

We find a significant relationship between school absence rates and pupils’ KS2 scores. Every percentage point increase in school absence is associated with a drop of around 0.34 scaled score points in reading and maths.
Crucially, because of the way we’ve modelled it, we can say that this relationship acts separately to individual pupils’ absence rates. That is, two pupils with the same absence rates who attend schools with different absence rates would have different average scores.
It might be surprising that each percentage increase in school-level absence is associated with a bigger change in KS2 score than a percentage increase in pupil absence. But the range of school-level absence is much narrower – only around 10 percentage points. So the modelled difference in KS2 score between a pupil in the school with the lowest rate of absence and the highest will be much smaller than between the pupil with the lowest rate of absence and the highest.
Summing up
Though the relationships between attendance and attainment are interesting, they are not causal. There are many factors associated both with low attendance and low attainment, at the pupil-level (e.g. chronic illness, parental engagement) and school-level (e.g. availability of resources, quality of teaching).
With Key Stage 4 results on the horizon, this might not be the last time we talk about disadvantage gaps and attendance…


Leave A Comment