Aspire Attendance Tracker
Schools can track, analyse and compare their attendance data against 1,000s of other FFT schools using Aspire Attendance Tracker.
Log in to Aspire to access Attendance Tracker – log in here.
Not an FFT Aspire user? Learn more here.
In an accompanying blogpost we looked at secondary school pupils with very high absence rates in the first half-term of this year. We estimated that, nationally, there were 438,000 pupils in Years 7 – 11 who had missed the equivalent of one day a week or more.
In this post, we turn to primary schools. The data we use is from 4,600 primary schools subscribed to Aspire Attendance Tracker – around 25% of state-funded primaries in England.
Overall picture
Firstly, let’s look at the distribution of pupils by % of sessions missed and see how it compares with last year and pre-pandemic[1]. To do this, we divide pupils into three groups: those who have missed at least 10% of sessions so far this year, those who have missed at least 20%, and those who have missed at least 30%.
We show the results when COVID-isolation absences are included (the light shading) and excluded (the dark shading)[2].

As we saw at secondary, there was a welcome fall in pupils with very high absence rates compared with last year. But high rates of non-COVID-isolation absence (including pupils off sick with COVID) means there are still many more such pupils than there were pre-pandemic.
The proportion of pupils missing at least 20% of sessions in the first half-term has reduced by around 40%, from 12.9% last year to 7.4% this year. And the proportion of pupils missing at least 30% of sessions has reduced by around 65%, from 6.1% to 2.2%.
Scaling these figures up to the national population of pupils in Years 1 – 6, 284,000 pupils have missed at least 20% of sessions so far this year, and 85,000 have missed at least 30%.
Differences by year group
That’s the big picture taken care of. Now let’s dig into some of the detail, starting with year group. Here we’ll focus on pupils who missed at least 20% and 30% of sessions so far this year.
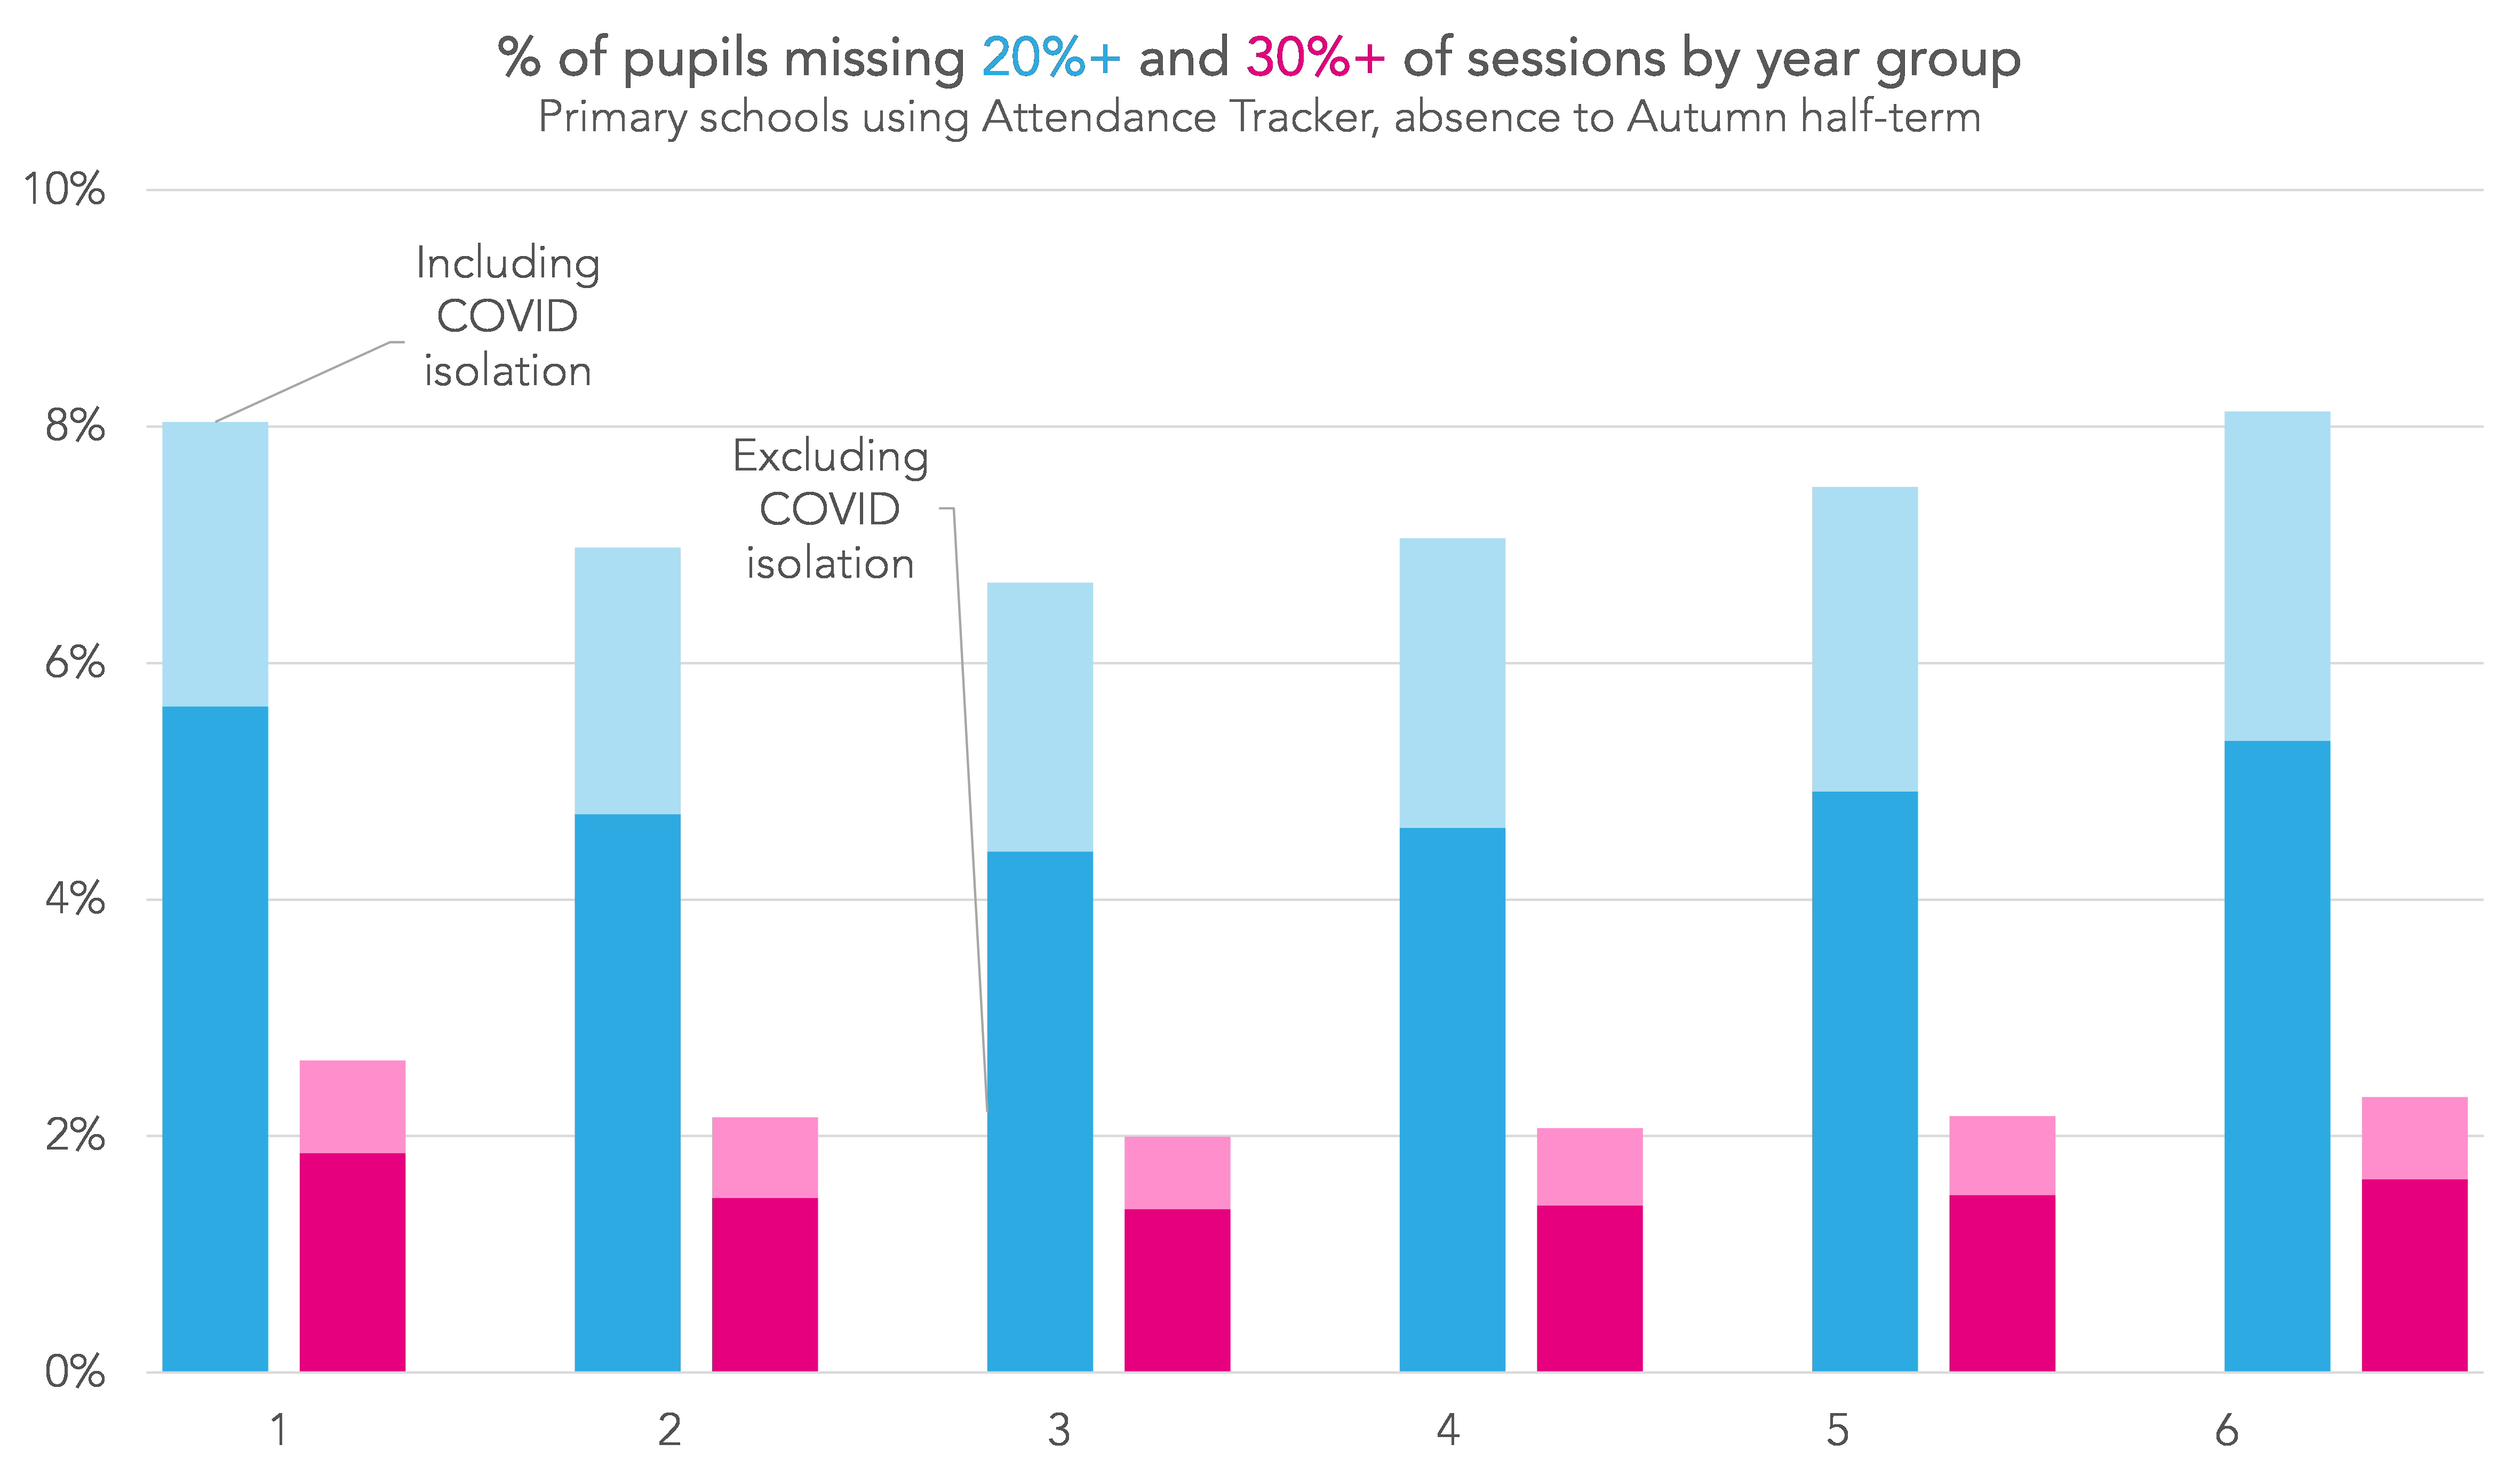
From Years 3 to 6, the proportion of pupils missing at least 20% and 30% of sessions increased with Year group. Year 2 had higher proportions of both than Year 3, and Year 1 had higher proportions than Year 2. This pattern is consistent with previous statistics on persistent absence.
Fewer pupils missed at least 20% and 30% of sessions in Year 3 than any other year group (6.7% and 2%, respectively).
The highest proportion of pupils missing at least 20% of sessions was in Year 6 (8.1%), and at least 30% of sessions in Year 1 (2.6%).
Differences by region
Moving on to region, the West Midlands had the highest proportion of pupils with lots of absence, while London and the South East had the lowest.
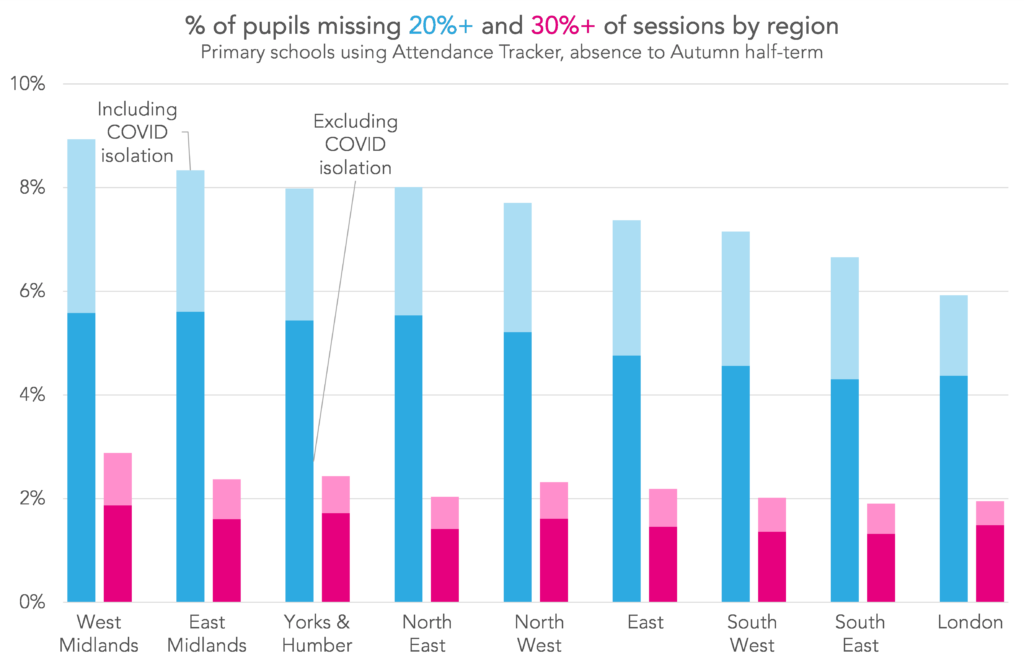
8.9% of pupils in the West Midlands missed at least 20% of sessions while 2.9% missed at least 30%. In London, 5.9% of pupils missed at least 20%, and in the South East 1.9% missed at least 30%.
Interestingly, the South West, which had the highest proportion of pupils missing at least 20% of sessions at secondary has one of the lowest at primary.
Differences by pupil group
Turning now to vulnerable groups of pupils: those eligible for free school meals at any point during the last 6 years (FSM6) and those with special educational needs (SEN) who receive additional support (SEN K) or have an Education, Health and Care Plan (EHCP) in place (SEN E).
Here, we’ll add in the proportion of pupils who missed at least 50% of sessions, i.e. were off school more than they were in.

Unsurprisingly, pupils in vulnerable groups were more likely to have missed lots of school than their peers.
12% of FSM6 pupils missed at least 20% of sessions, more than double the 5.7% among their peers. And three times as many FSM6 pupils missed at least 30% of sessions (4.3% of FSM6 pupils vs 1.5% of other pupils).
Perhaps the most concerning results are seen among pupils with an EHCP. In particular, 7.2% of these pupils missed at least 30% of sessions compared with just 1.8% of those with no recorded SEN. And 2.7% missed at least 50% of sessions compared with 0.3% with no recorded SEN.
Reasons for absence – the 20%+ group
So we’ve seen that the proportion of pupils missing a lot of school in the first half-term this year was higher than pre-pandemic. To finish, we’re going to dig into the reasons behind these absences.
Here we show the absence reasons recorded for the group of pupils who missed at least 20% of sessions excluding COVID isolation. We divide the absences into authorised and unauthorised, and compare with the absence codes recorded for 2019’s Autumn term persistent absentees[3] (the bars in lighter shading).
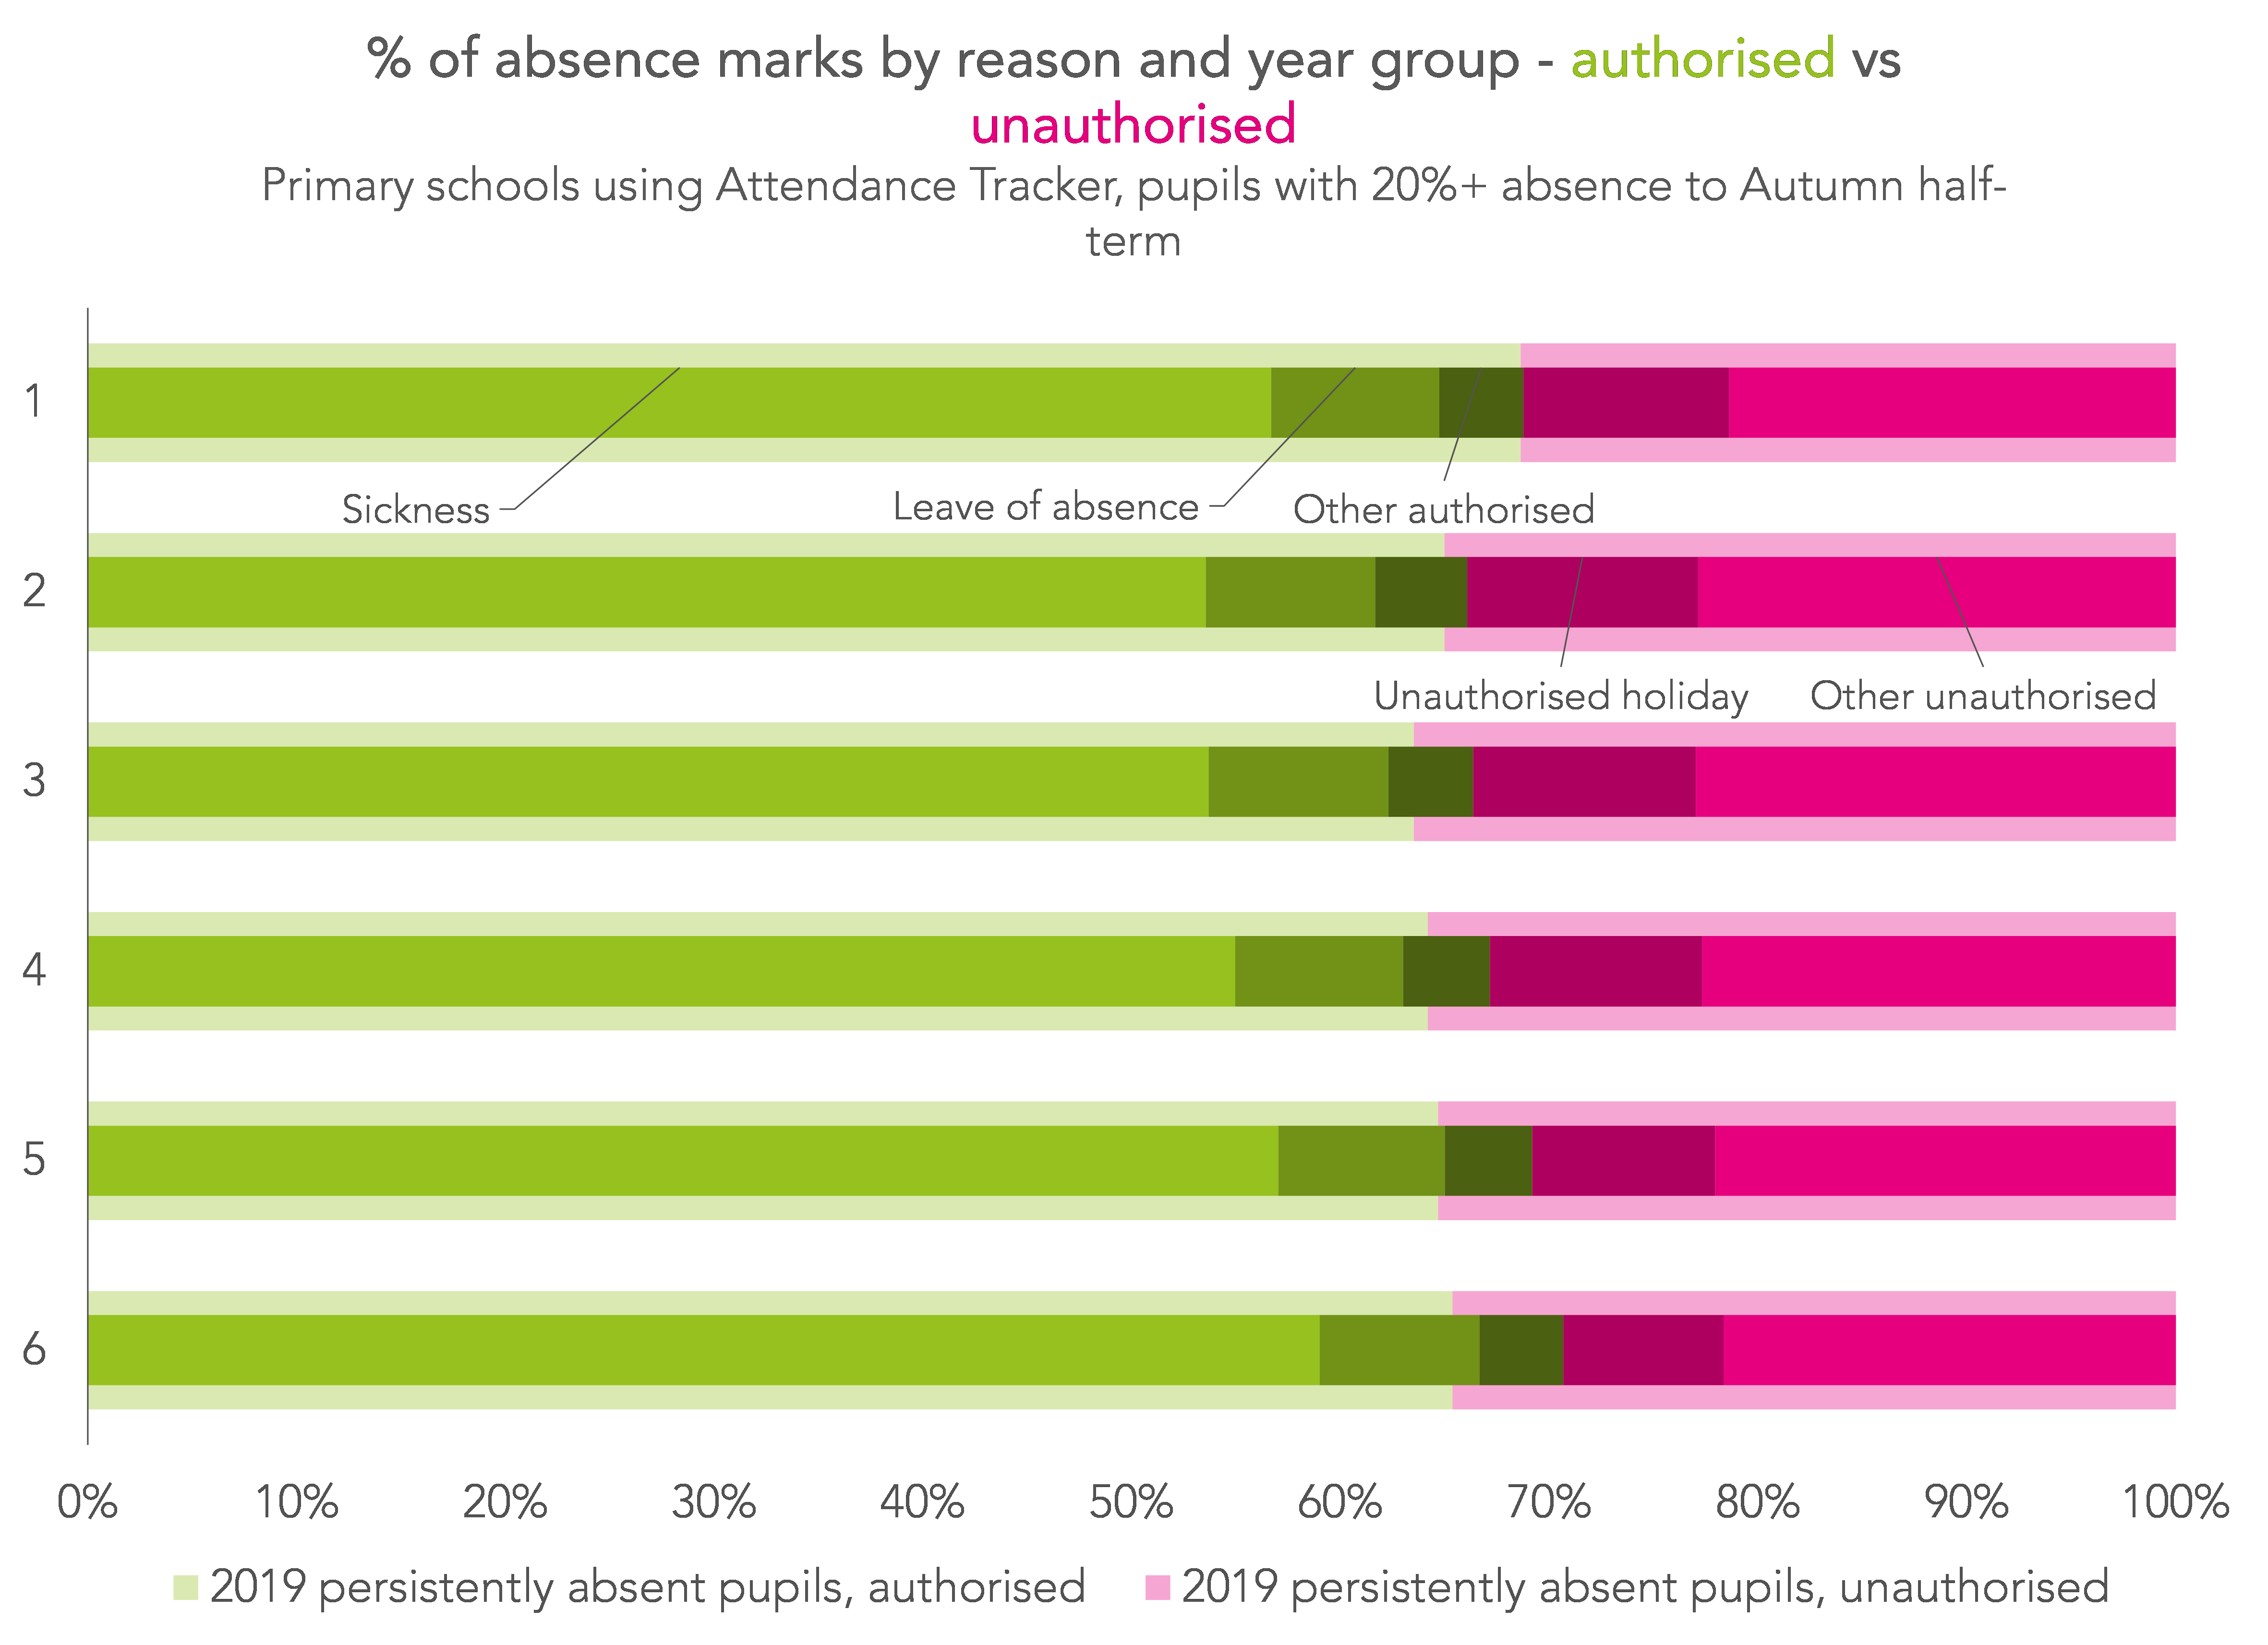
Broadly, there is slightly more authorised absence among pupils who have missed lots of school this year than there was pre-pandemic. This is almost certainly down to a higher rate of sickness absence due to positive COVID cases.
Unauthorised holidays were much more common for primary pupils with high absence rates than secondary.
Summary
There have been lots more pupils missing a lot of school so far this year than pre-pandemic, particularly pupils in vulnerable groups.
It looks like this is result of COVID directly causing increased sickness, rather than indirectly causing more unauthorised absence.
7% of pupils in Years 1 to 6 have missed at least 20% of sessions so far this year, a much lower percentage than this time last year. However, it’s still relatively early in the school year (even though it might not feel like it). We may find that figures to date have been driven by large numbers of pupils with a single period of absence due to COVID.
What we don’t yet have a handle on is the number of pupils who are missing school for reasons other than COVID, e.g. anxiety. To do this we would need to distinguish illness related to COVID from other recorded illness in the data. Although new attendance codes for COVID illness were introduced they do not appear to be widely used within schools.
1. First half-term of last year, the whole of Autumn term 2019 for pre-pandemic
2. Attendance code “X” used for pupils who isolating without a positive test result (if they test positive, their absence is marked as sickness from the date of their test result). In previous blogs we’ve referred to these as “COVID-related” absences. Here we’re trying “COVID-isolation absences” to avoid confusion.
3. We use the 2019 persistent absentee’s absence breakdown as a rough guide to a “typical” absence profile for pupils who miss a lot of school. We chose it because it’s all that’s publicly available. But it’s not strictly equivalent to this year’s 20%+ group, so we’ll deliberately be a bit woolly when we make comparisons.


Leave A Comment