*Update 8th September 10.22. We have updated the tables to correct errors in original calculations. This doesn’t affect any findings*
Yesterday’s provisional Key Stage 2 statistics showed a worrying increase in the disadvantage gap index since the start of the Covid-19 pandemic.
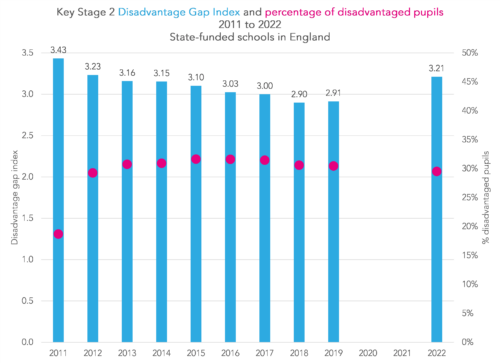
The gap index reached its highest value since 2012. In fact, the 2011 figure is probably something of an anomaly: Just 19% of pupils that year were classified as disadvantaged (in all other years the figure has been between 29% and 32%).
The index is based on the difference between disadvantaged pupils and their peers in mean percentile ranks in reading and maths scaled scores combined.
In this blogpost we dig into this gap in a bit more detail using the published datasets.
Change in average scaled scores
Firstly, let’s look at the change in average scaled scores between 2019 and 2022.

This shows a small change in the gap in reading but a larger widening of the gap in maths from 3.6 to 4.2 scaled score points.
But does this tell the whole story?
Pupils not entered for the test
Published measures based on scaled scores do not include pupils who did not take the tests due to working below the standard assessed.
However, there has been an increase in the percentage of pupils assessed at this standard since the pandemic.

6.1% of disadvantaged pupils were not entered for the reading test in 2022 compared to 4.8% in 2019, an increase of 1.3 percentage points.
The equivalent figures in maths were 5.8% and 4.6%, an increase of 1.2 percentage points.
Among non-disadvantaged pupils the percentage not entered increased by just 0.3 percentage points in reading and 0.2 percentage points in maths.
In the DfE gap index, these pupils are assigned notional scaled scores based on teacher assessments as used in value added calculations (see page 25 of the methodology document).
We only know the total number of pupils working below the standard of the test in the data published by DfE yesterday so cannot include the full range of notional scaled scores.
But if we use a notional score of 75[1] for all these pupils, we can recalculate the changes in gaps[2].

This shows a widening of the attainment gap of 0.3 points in reading and 0.8 in maths between 2019 and 2022.
A caveat
29.5% of the 2022 cohort was classified as disadvantaged, that is to say has been eligible for free school meals in the last 6 years. This compares to 30.5% the same as the last time the tests were sat in 2019. Perhaps a slightly surprising fall given the pandemic.
Free school meal eligibility criteria were changed in April 2018 due to the national rollout in Universal Credit. At present, we cannot be sure how comparable cohorts are in terms of disadvantage.
Perhaps more of the 2022 cohort compared to the 2019 cohort would be classified as disadvantaged if the eligibility criteria had not changed in 2018. However, this is hypothetical at present.
Read more on why we need new measures of disadvantage.
Summing up
The caveat notwithstanding, the gap appears to have widened in maths but not so much in reading.
This mirrors the findings of different teams of researchers during the pandemic, including a team we were involved with.
But what is perhaps surprising is the magnitude of the change.
In education research we tend to measure effects using effect sizes. This involves converting measures into standard deviation (SD) units.
The disadvantage gap in maths appears to have increased from 0.49SD to 0.59SD, an increase of 0.10SD.
This is much larger than the change of 0.05SD that we found in our earlier work, admittedly using a very different set of pupils, different tests and a different methodology. So perhaps not that surprising after all.
- This is the average value for pupils working below the standard of the test in data we’ve collected from schools
- We plan to recalculate the gap using the full national dataset later in the year


A guess, but 2011 data “disadvantage” is possibly FSM and 2012 onwards is probably the more familiar pupil premium + LAC groups definition – reflecting when PP was first introduced?
Hi Ben. Yes, there have been definitional changes over the years. Another one is that termly School Census data was only introduced in January 2007. So details of FSM eligibility weren’t collected when the 2011 Year 6 cohort were in Reception or in the Autumn of Year 1. I don’t think the inclusion of looked after children makes much difference- they are relatively small in number and there is a lot of overlap with the FSM6 group.
Is the KS2 national data set going to be made available to download? Interested in looking at the local authority data for working beyond expected levels.