In previous posts, we’ve analysed the rate at which pupils joined and left the state-funded school system in England.
The last time we did this was in a cruelly overlooked article in September 2021 although we also looked at movements out of the system in January 2022 in response to concerns about pupils leaving school rolls during the pandemic.
In this post we analyse both pupils joining and leaving the school system up to and including January 2022. In particular, the rate at which pupils joined the system fell during the height of the pandemic but has since recovered. There was little change in the rate at which they left the system.
Data
We use data from the January School Census each year from 2015 to 2022 relating to pupils aged between 4 and 15 at the start of the academic year. For example, in the January 2022 Census we include pupils aged between 5 and 15 on the 31st August 2021.
All types of state-funded school are included: mainstream, special and alternative provision.
Leavers are defined as pupils who were not observed on roll at a state-funded school in the Census for a given year but who were observed in the previous year. For example, pupils who were on roll in January 2021 but not in January 2022.
The destinations of leavers may be home education, schools in the independent sector, schools outside of England or, in rare but tragic circumstances, death.
Joiners are defined as pupils who were observed on roll at a state-funded school in the Census for a given year but who were not observed in the previous year. For example, pupils who were on roll in January 2022 but not in January 2021.
We also divide joiners into two groups:
- Returners are pupils who we observe in a previous School Census (all terms and all years)
- New entrants are pupils who we observe in School Census for the first time. These will typically be pupils moving into the state-funded sector for the first time, usually from abroad or the independent sector.
Results
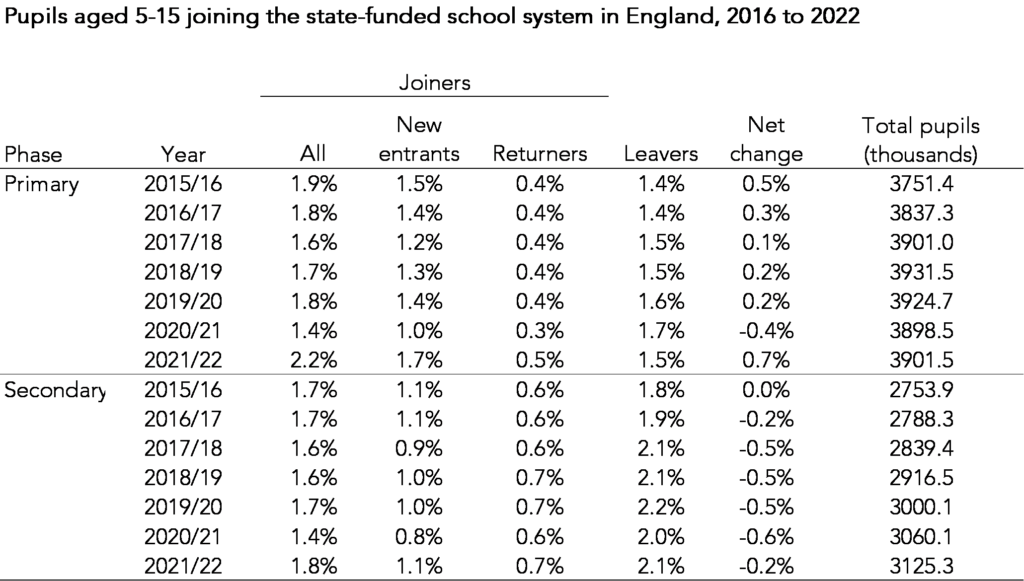
In the table below, we show the rate of pupils joining and leaving the state-funded school system in England between 2016 and 2022.
There was an increase in secondary-age pupils and, particularly, primary-age pupils joining (or rejoining) the state-funded school system between 2021 and 2022 following a fall the previous year.
2.2% of primary-age pupils (84 thousand) joined the system between 2021 and 2022 compared to 1.4% (53 thousand) the previous year. Among secondary age pupils these figures were 1.8% (57 thousand) and 1.4% (53 thousand) respectively.
In terms of net change (the difference between the joiner rate and the leaver rate), the figure for primary-age pupils was once again positive in 2022, indicating that there were more joiners than leavers. There had been more leavers than joiners the previous year.
The net change among secondary-age pupils has tended to be negative since 2016, indicating that more pupils left than joined. The leaver rate increased between 2016 and 2020 before falling slightly.
By contrast, the leaver rate among primary-age pupils continued to increase between 2020 and 2021.
Joiners and leavers by year group
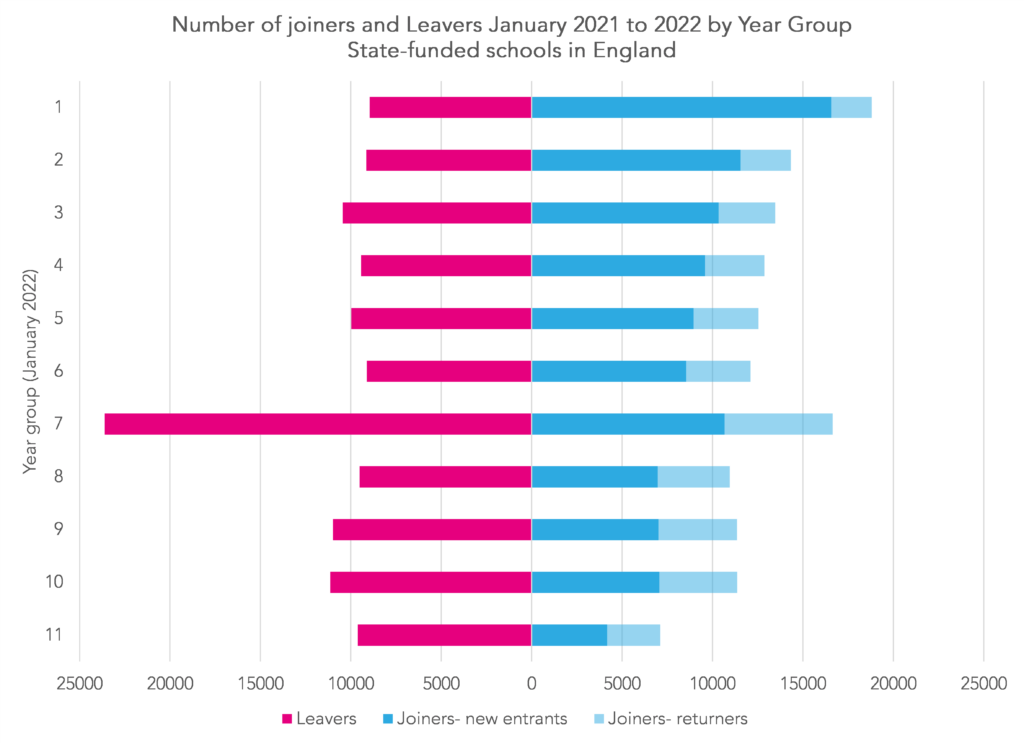
Joiners exceed leavers across all year groups with the exception of Year 7 (where there are likely to be losses to the independent sector) and Year 11. Joiners and leavers are broadly balanced in Year 10.
Joiners and leavers by ethnicity
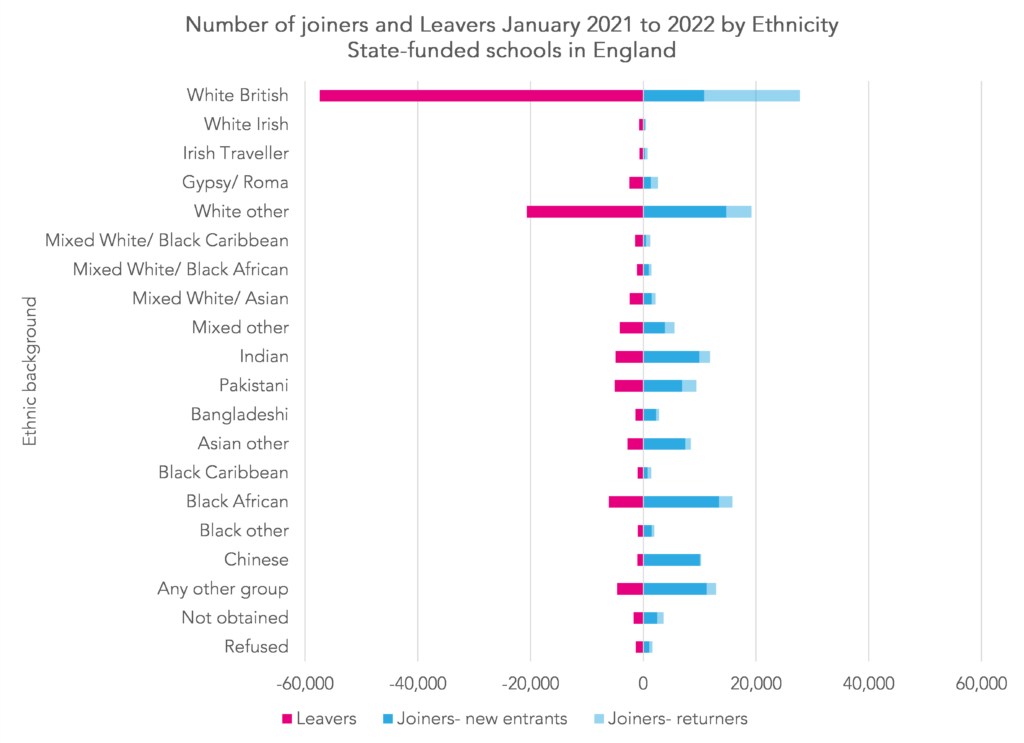
The number of joiners and leavers by ethnic background is shown below.
There were large numbers of White British joiners (especially returners) and leavers but this is perhaps to be expected given that 65% of pupils in Years 1 to 11 in 2022 were White British. 47% of all leavers and 20% of all joiners were of this ethnic background.
Almost 20 thousand leavers were of a White other background, with an almost equal number of joiners.
For most other groups, joiners exceeded leavers and there tended to be more new entrants than returners.
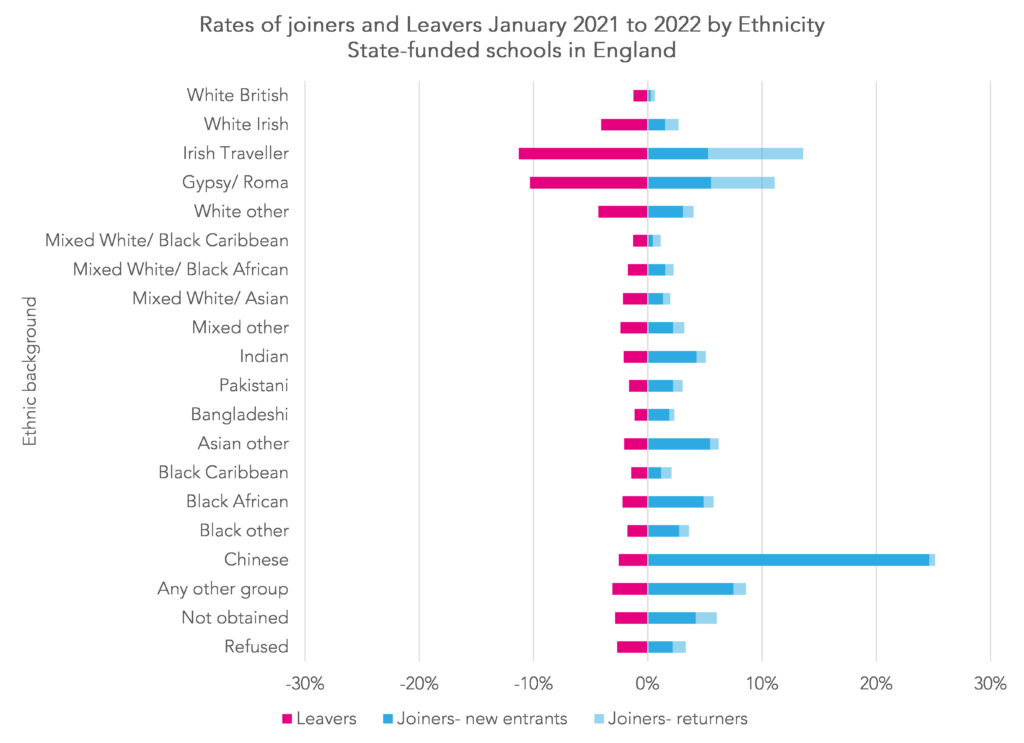
To put the numbers into some sort of context, the chart below expresses the number of joiners and leavers as a proportion of the school population as of January 2022.
This shows that joiners and leavers are a relatively small proportion of the White British population.
By contrast, almost a quarter of Chinese pupils on roll in January 2022 were new entrants to the state-funded system since January 2021.
Placement of new entrants
As might be inferred from the two previous charts, the majority of new entrants (70%) have a first language other than English.
As the table below shows, the vast majority of new entrants to the state-funded schools system were placed in mainstream schools.
A small proportion of pupils in Year 1 and Year 11 in particular were placed in special or AP schools.
In addition to over 200 Year 11 pupils placed in special or AP schools, another 190 were funded by local authorities to attend provision outside the state-funded system (e.g. in independent schools).
London
In a previous article we looked at pupils joining and leave state-funded mainstream schools in London.
We noted that schools in London had always tended to lose pupils be it to the independent sector, other regions or due to migration overseas (or to other parts of the UK) but that these pupils had always been replaced by pupils joining the system.
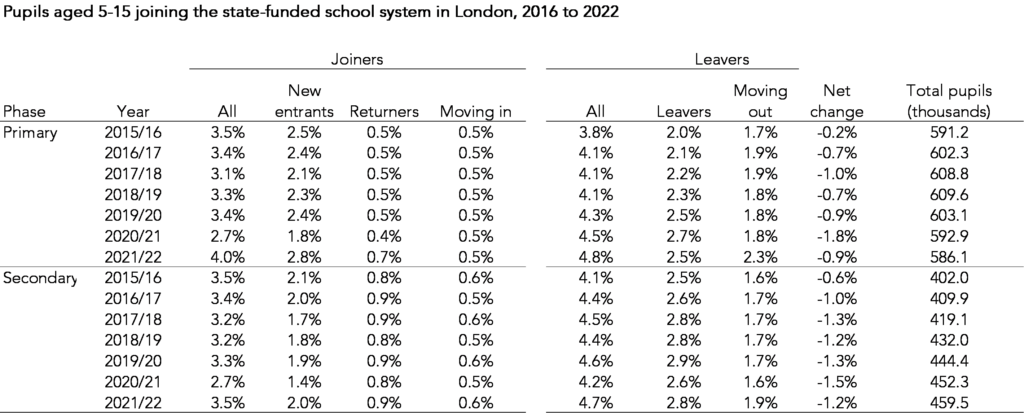
In the table below, we update this analysis. We include some extra columns compared to the table above which show the number of pupils moving in from state schools in other regions in England (and the number moving out of state schools in London to those in other regions).
The total number of secondary-age pupils has been increasing in London since 2016 as a population bulge works its way through. But that notwithstanding, the net change figures indicate that leavers have been increasingly outnumbering joiners.
The primary-age population has been declining since 2019. A fall in the birth rate[1] will make this situation worse in the coming years. The net change of 0.9% for 2022 indicates that on top of this, 5 thousand more pupils left the capital’s schools than joined them. 2.3% of pupils moved to schools in other regions between 2021 and 2022.
The rate at which pupils joined schools in London fell sharply between 2020 and 2021 although the rate of pupils moving in from other regions barely changed compared to previous years. Rates increased between 2021 and 2022 and were slightly above previous figures among primary-age pupils and in line with previous figures among secondary-age pupils.
Summing up
Between January 2020 and January 2021, the period covered by the first waves of the pandemic, there was a net reduction in the size of the primary school population. This was driven more by a reduction in pupils joining the system rather than pupils leaving although there was a slight increase in the latter.
The picture in secondary schools was somewhat different. Leavers have exceeded joiners since 2017, but the rate of both joiners and leavers fell slightly between January 2020 and January 2021. The joiner rate then increased the following year.
The dips in joiner rates largely mirror immigration statistics over the same period. Inward migration fell but outward migration continued to increase.
Schools in London, particularly primary schools, were badly affected during the pandemic. Between 2020 and 2021 for every pupil who joined a London school, 1.67 left. The situation improved markedly the following year although the rate at which primary-age pupils left the Capital for schools in other regions increased.
- According to ONS statistics, there were 730,000 live births in England and Wales in 2012, falling to 614,000 in 2020. There was a small increase to 625,000 in 2021.
Want to stay up-to-date with the latest research from FFT Education Datalab? Sign up to Datalab’s mailing list to get notifications about new blogposts, or to receive the team’s half-termly newsletter.





Leave A Comment