This blogpost supports a new report available for primary schools in FFT Aspire, but may be of interest to a wider audience.
Download the report for your school now – sign in to FFT Aspire, open School Reports in the side navigation and choose ‘Special Reports’.
Performance Tables for primary schools have not been published since 2019 but are expected to return later this year.
As usual, they will contain measures of attainment and “progress”.
However, next year there will be a problem. The progress measures use results in Key Stage 1 (KS1) assessments as the measure of prior attainment. But these won’t be available for next year’s Year 6 cohort as KS1 data was not collected in 2020 due to COVID-19.
The Department for Education has indicated that they are looking at alternative options for calculating progress measures. We’ll take a look at these here.
The current progress measures
Progress measures are currently calculated for reading, writing and maths at Key Stage 2.
These are calculated by firstly converting pupils’ results in Key Stage 1 teacher assessments (in reading, writing and maths) into points, then calculating the average score across all 3 subjects. Pupils are then divided into 19 bands based on this measure. The difference between each pupil’s KS2 result and the average for all pupils nationally in the same prior attainment band is then calculated and averaged over all pupils in a school.
In theory, by comparing pupils’ outcomes to pupils with similar prior attainment, progress measures offer a fairer way of comparing schools than measures of raw attainment.
Of course, the measure is not really a measure of progress. It’s a measure of attainment conditional on prior attainment.
And as we set out here, there are numerous problems with the current measures:
- They are biased against junior and middle schools
- They take no account of context
- Results can be volatile (from year-to-year) due to small cohort sizes
- There is no overall measure of progress, which might alleviate some of the noise in the individual subject measures
Given this, it would perhaps be no loss if the measures weren’t published. But by the same token, an alternative measure doesn’t have a very high bar to measure up to.
Alternative measures of prior attainment
There are two measures available for the vast majority of pupils in state-funded schools in England:
- Early Years Foundation Stage Profile (EYFSP) total score
- Year 1 phonics mark
Both of these measures have distributions with “interesting” features.
First the EYFSP score. Pupils are assessed on a 1-3 scale[1] across 17 areas of learning. This results in a score ranging from 17 to 51.
In the chart below we show the distribution of this score for Year 6 pupils from 2021/22.
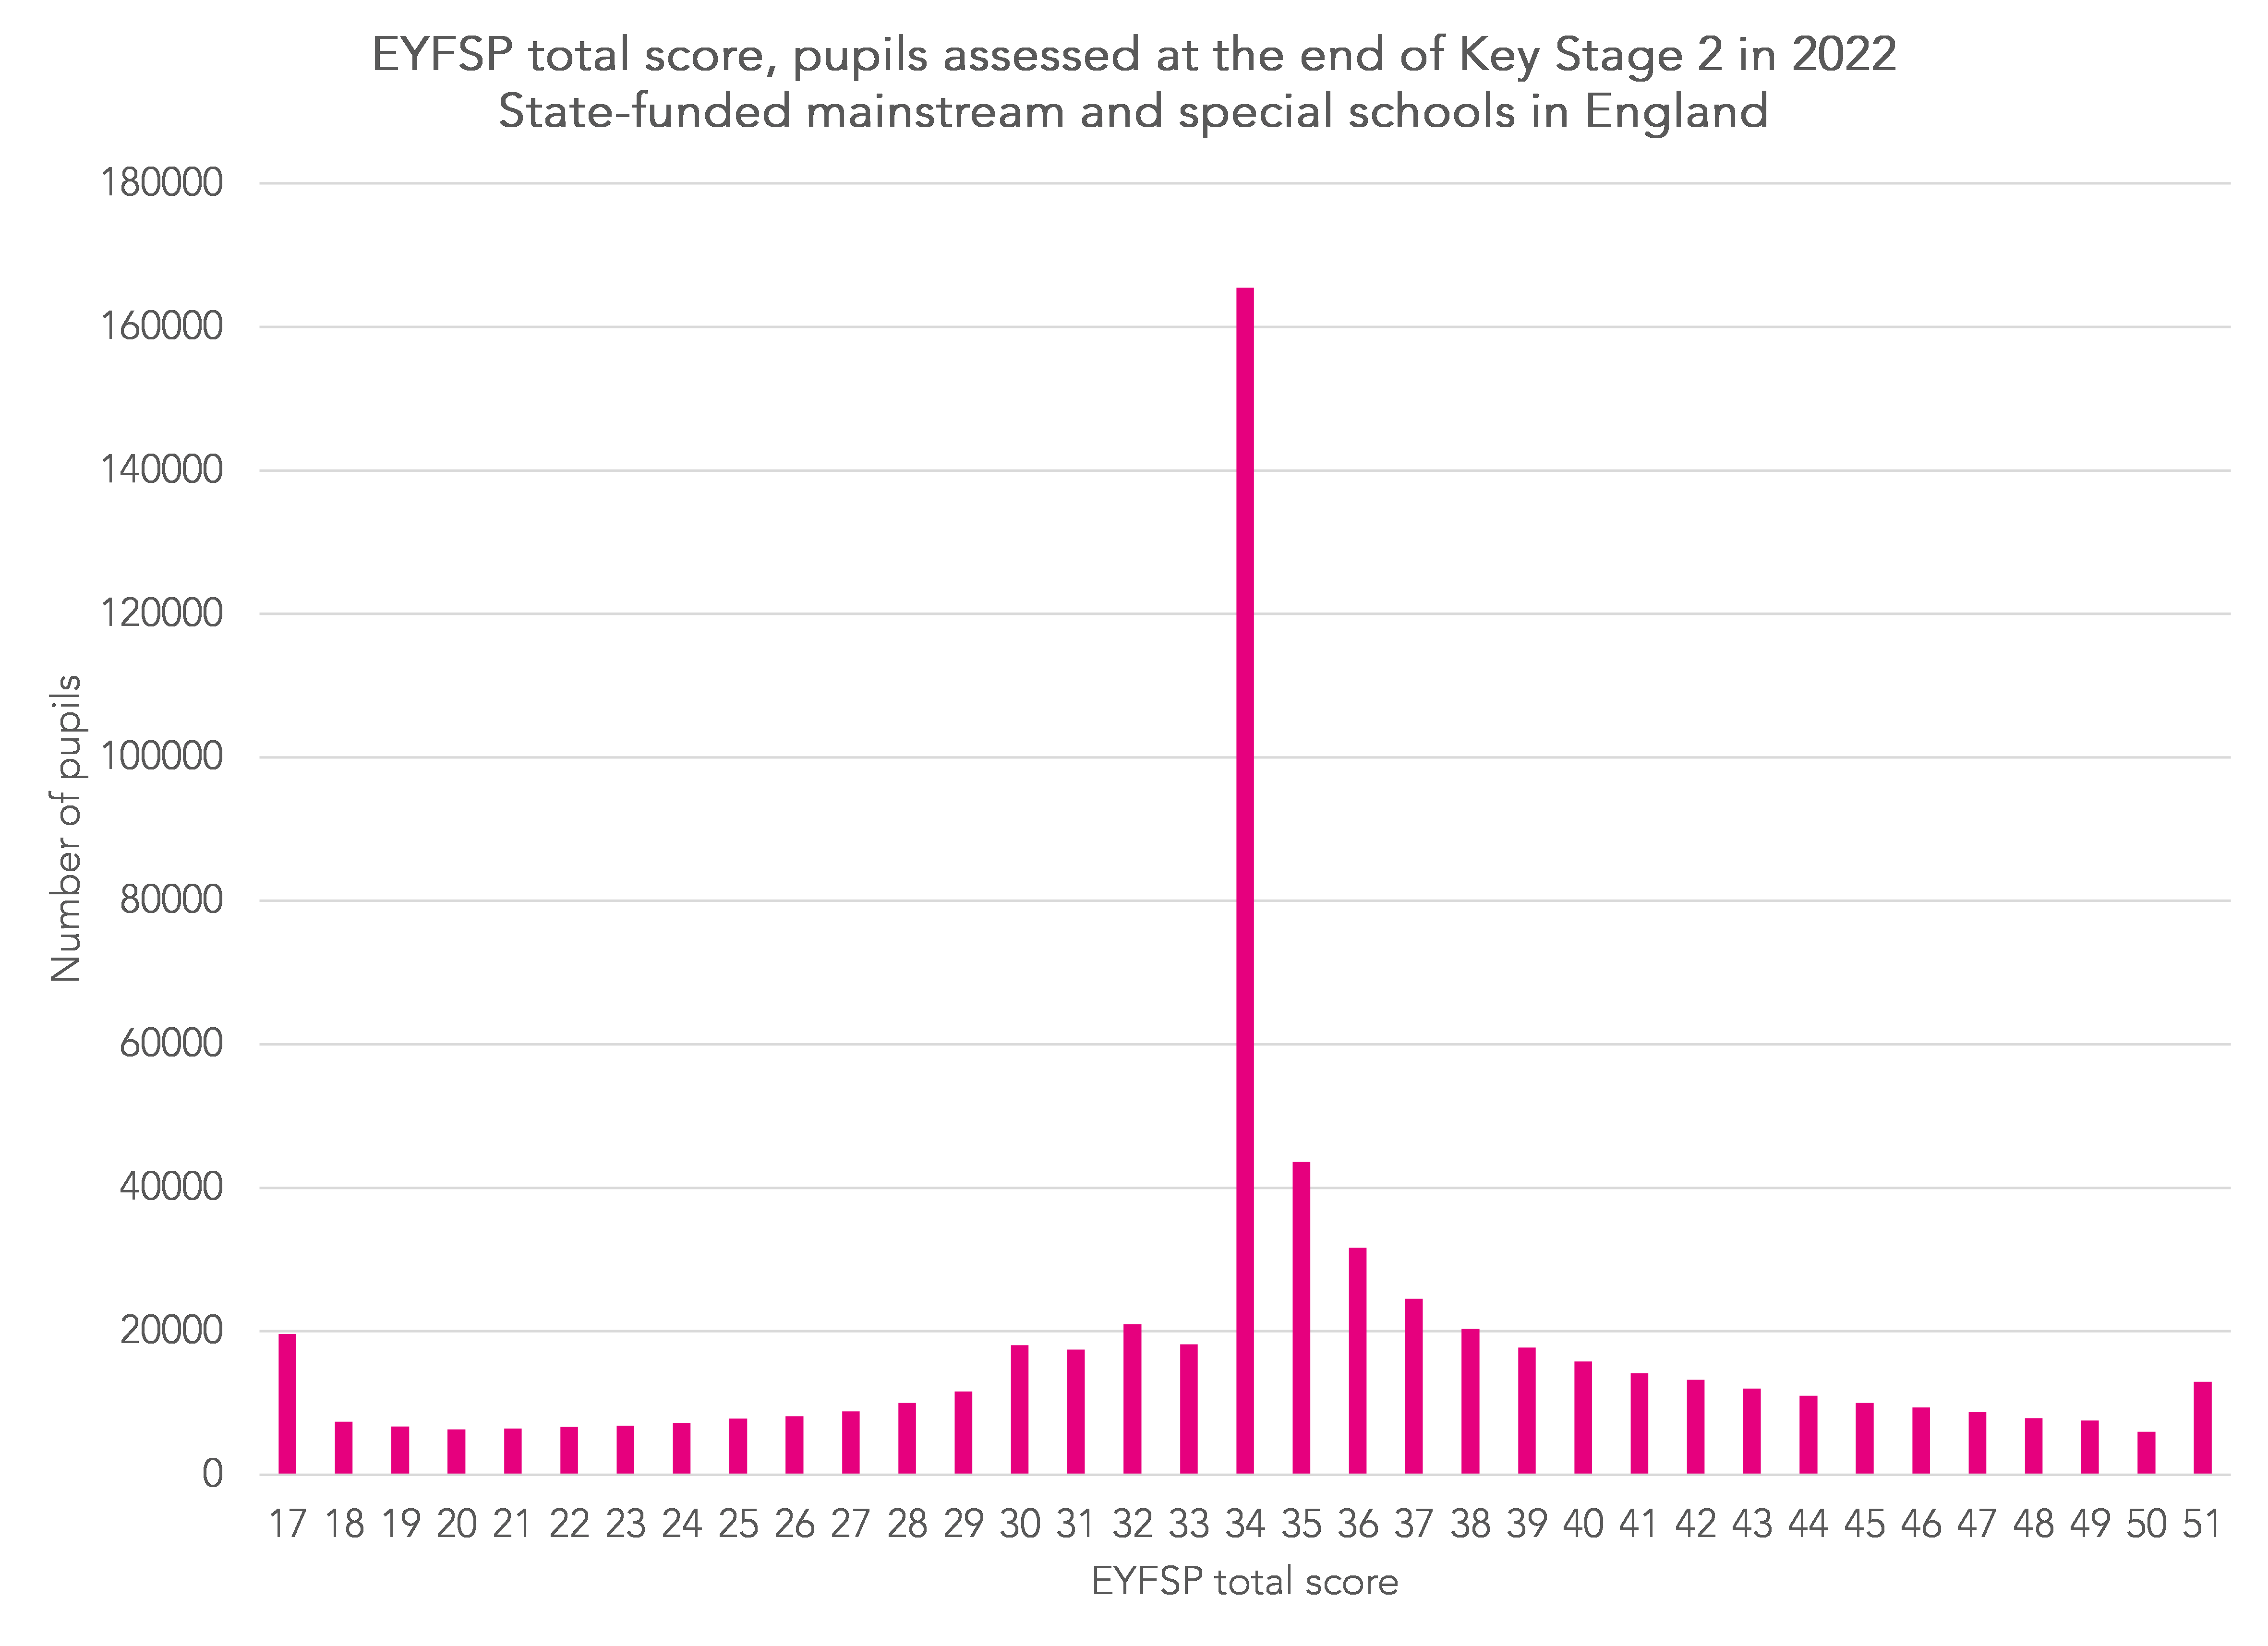
25% of pupils scored 34 points, most of those achieving a score of 2 (expected standard) in each of the 17 areas of learning.
Now let’s look at the distribution of Year 1 phonics marks for the same cohort.
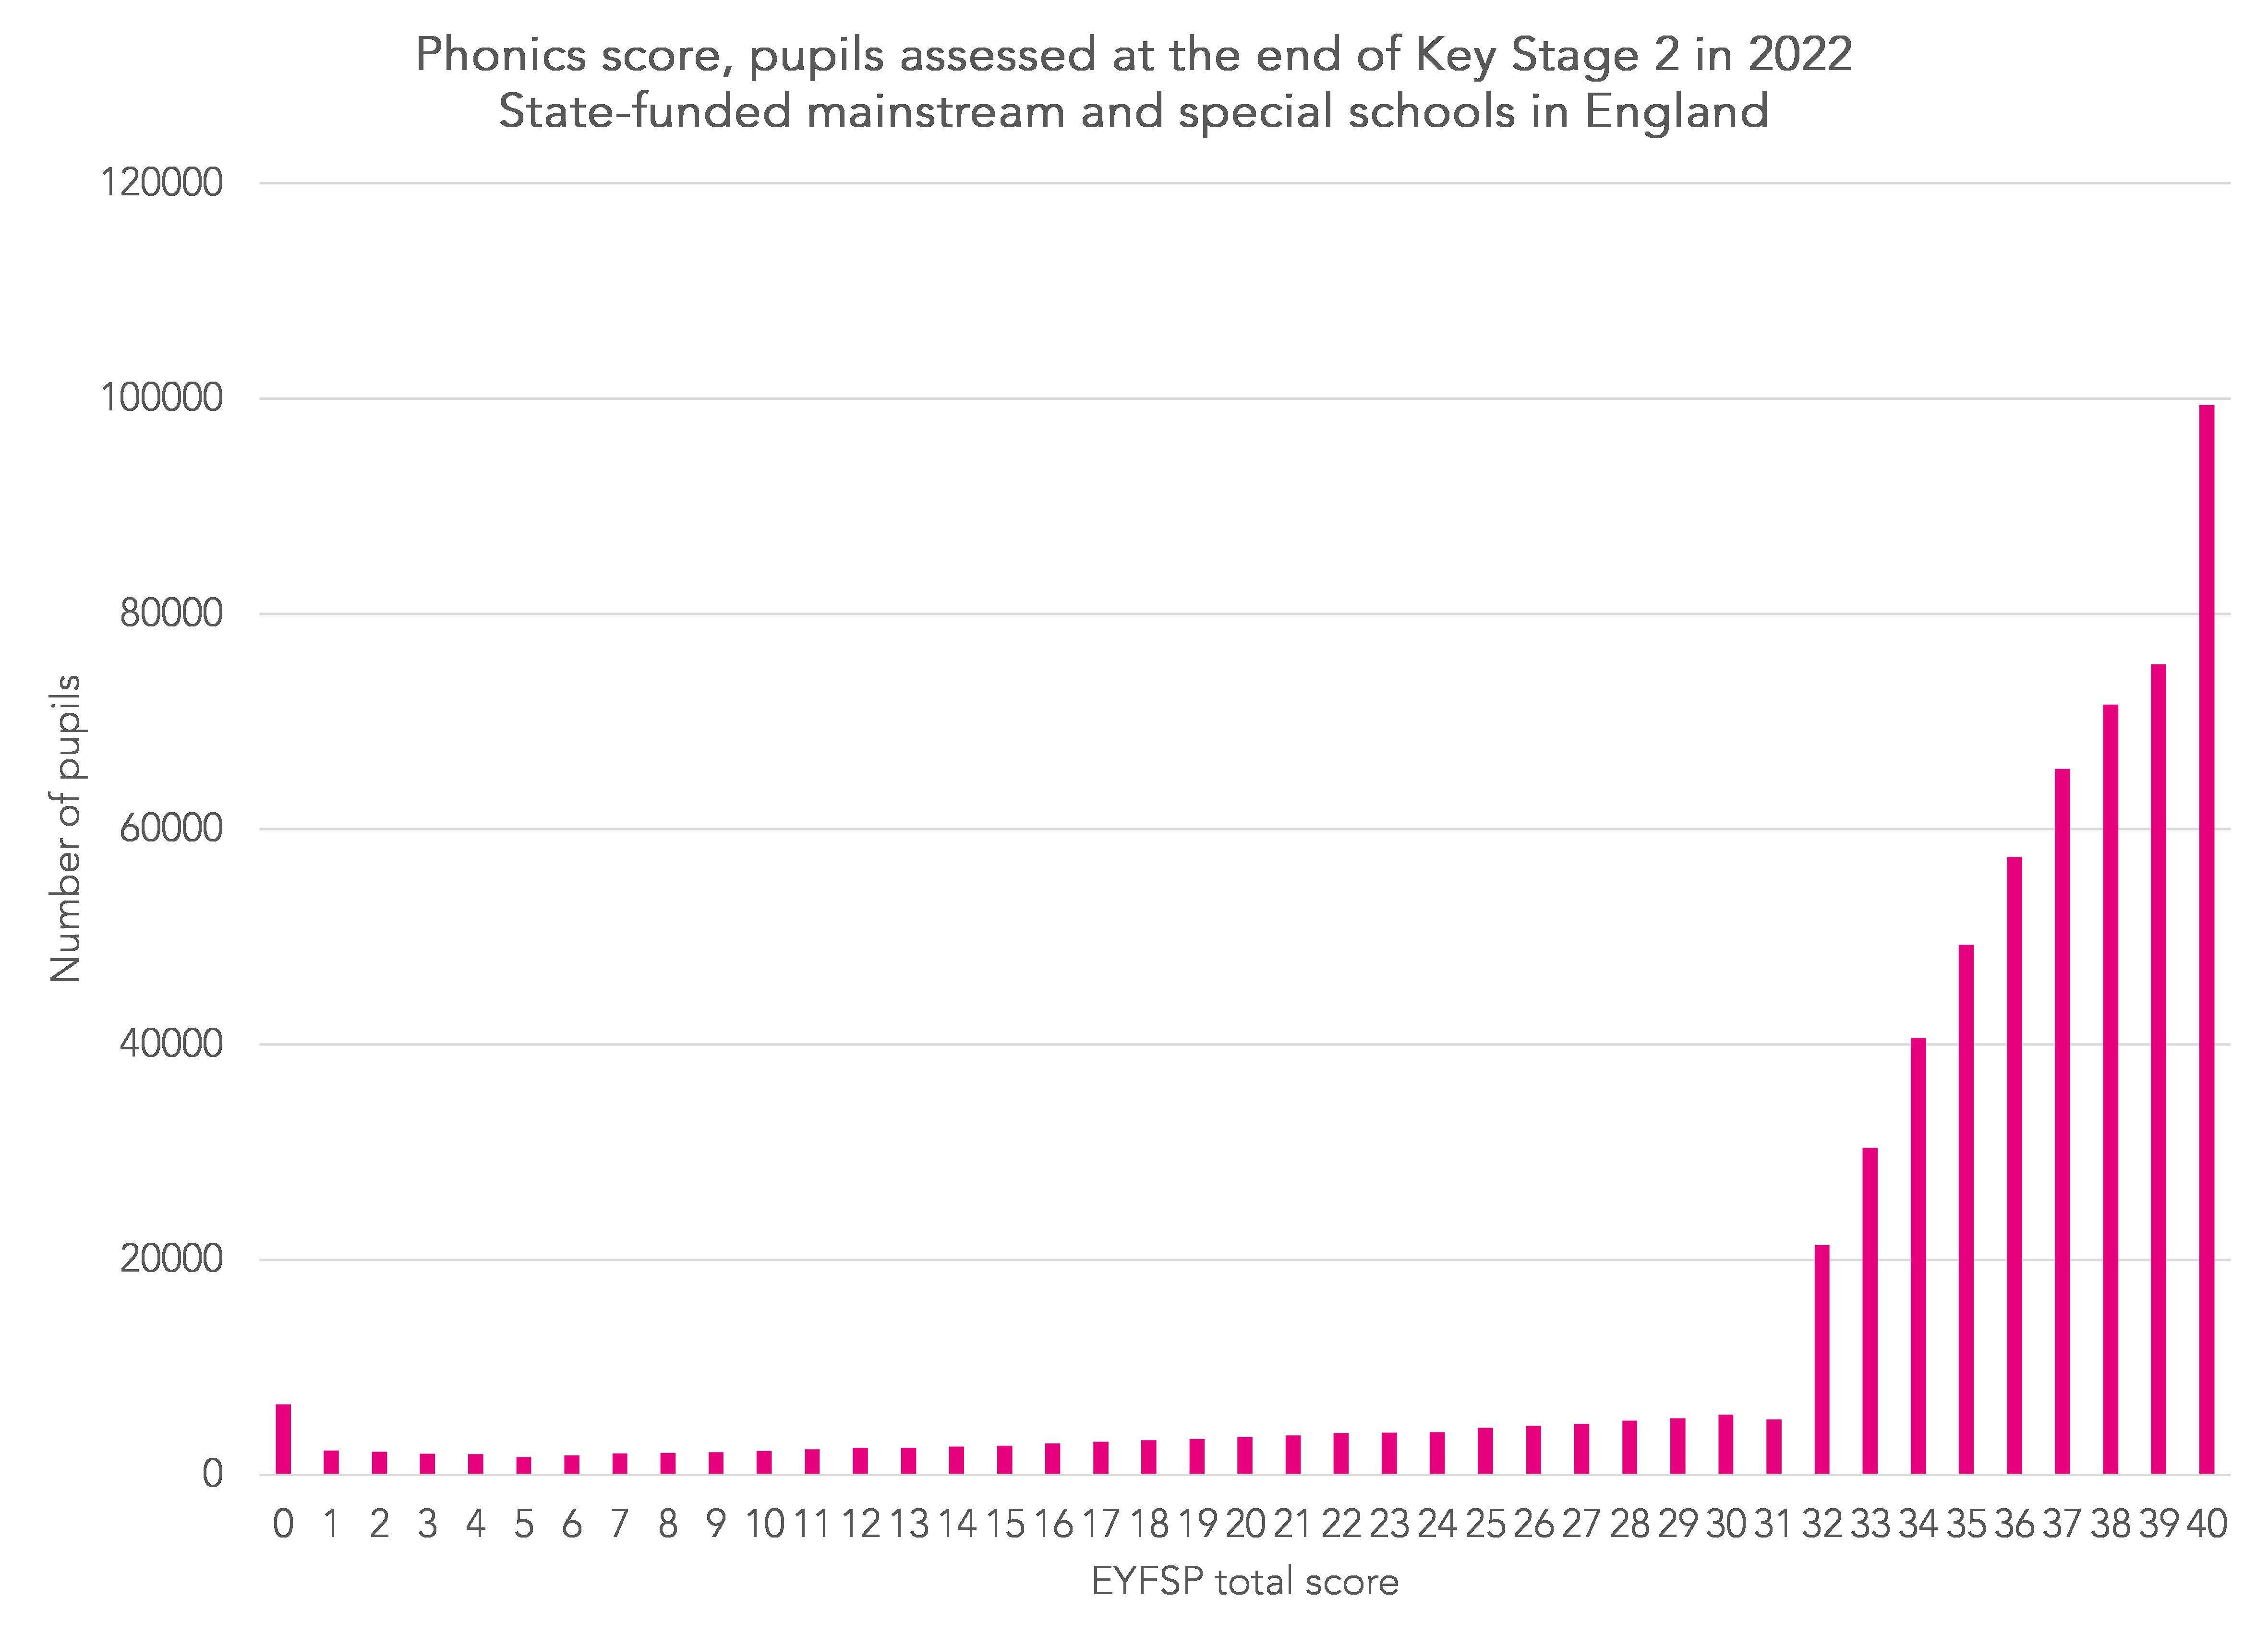
The vast majority of pupils are at the upper end of the distribution. In fact, the maximum mark (40) is the modal mark.
Alternative Progress Measures
We calculate alternative Key Stage 2 progress measures using a) EYFSP total score and b) Year 1 phonics mark in place of Key Stage 1 prior attainment band.
First, we look at whether KS2 outcomes increase with respect to prior attainment.

In all subjects, average KS2 results increase as EYFSP total score increases[2]. The same is true for phonics although we don’t show a chart for this to try to keep this piece down to a manageable size.
Let’s take a look at some of the other properties of these measures.
We examine the percentage of variance in pupil outcomes explained by the various prior attainment measures. This gives an indication of the strength of association between prior attainment and KS2 outcomes.
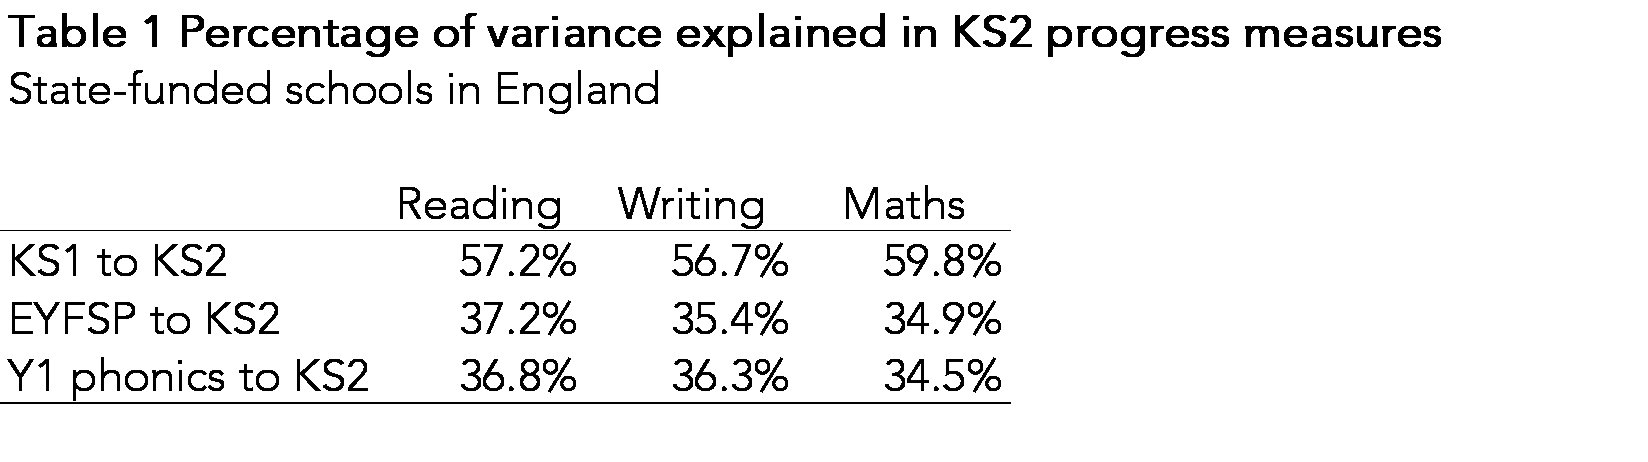
KS1 attainment accounts for 57% to 60% of the variance in KS2 outcomes. The remaining variance is down to all other factors affecting pupil attainment: support at home, school effectiveness, measurement error and so on. However, the remaining variance is the source of the progress scores. This is why we say that progress scores aren’t measures solely of school effectiveness: they are simply measures of attainment net of prior attainment.
The progress measures based on EYFSP score and Year 1 phonics explain less variance. In other words, the association with KS2 outcomes is less strong. This would be expected to some extent given that there is a longer span of time between assessments. Interestingly, Year 1 phonics is (slightly) less well correlated with KS2 reading outcomes than EYFSP total score.
Now let’s look at the correlation between schools’ VA scores. Here we only include mainstream schools with 11 or more pupils.
The closer the correlations are to 1, the less useful the progress scores are. Or put another way, the progress scores don’t tell us much different from raw attainment measures.
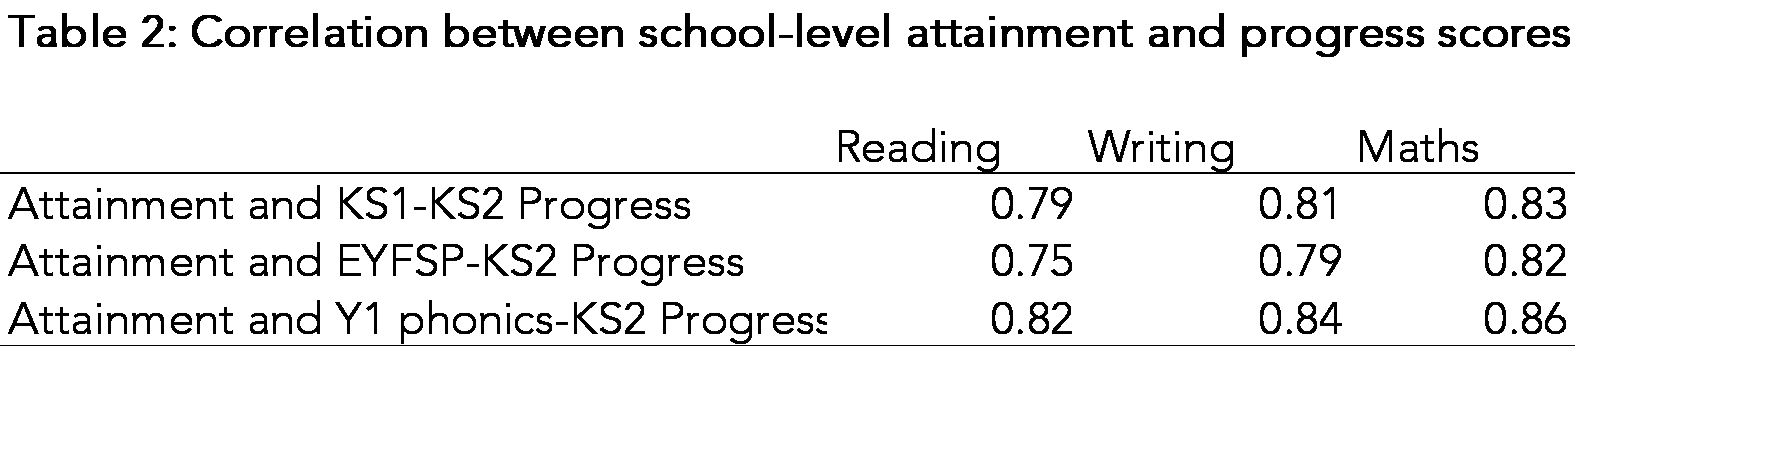
The correlation between attainment and Key Stage 1-Key Stage 2 measures is relatively high. We would expect a degree of positive correlation: imagine two schools with pupils with identical prior attainment among their pupils. The school with the higher average level of attainment would also have the higher average progress score.
The correlations between attainment and progress based on phonics is even higher, though the correlation between attainment and progress based on EYFSP total score is slightly lower.
Impact on disadvantaged pupils
In the table below we show national averages for the progress measures for disadvantaged pupils compared to other pupils.

The differences in progress scores are larger when progress is based on EYFSP results than when based on KS1 results. This makes sense as disadvantaged pupils tend to fall further behind at every Key Stage. Hence the progress score based on EYFSP captures how far disadvantaged pupils tend to fall behind over both Key Stage 1 and Key Stage 2.
The opposite is true for pupils with a first language other than English.

Progress scores based on EYFSP would tend to be higher for pupils with a first language other than English than the scores based on KS1. Interestingly, the scores based on Y1 phonics would tend to be lower, suggesting that there is less of a gap in attainment in phonics than in EYFSP or KS1.
Impact on schools
In the table below, we show the difference in progress scores based on EYFSP compared to those based on KS1 for all schools with at least 11 pupils in 2022.

For each measure, around 4,000 schools (just under 30%) would see their score change by a tiny amount (0.5 of a scaled score point).
However, some schools would see their scores change by a larger amount. Over 1,000 would see their score fall by 2 points or more. Given that 9,000 schools achieve KS1-KS2 progress scores between -2 and +2 this is a relatively large number.
As the previous section would suggest, schools with high levels of disadvantage and a below average proportion of pupils with a first language other than English would be worse off if KS2 progress measures were based on EYFSP scores rather than KS1.
All that notwithstanding, using EYFSP scores for progress measures would help bring the scores of junior and middle schools closer to those of all-through primary schools.

However, special schools would also be much worse off if EYFSP scores were used.
Summing up
An alternative Key Stage 2 progress measure could be produced using EYFSP total score in 2024.
This will alleviate some of the bias in the existing KS1-KS2 measure faced by junior and middle schools. However, the measure would notionally measure the “progress” of pupils in both the junior school and in the infant school.
But just because a measure could be produced, should it?
The amount of correlation between EYFSP and KS2 results is much less than the correlation between KS1 and KS2 results. Although this is to be expected given that wider time interval between the tests, it also means that the progress measures would be more strongly correlated with attainment measures.
Nonetheless, the progress measures offer at least a bit of recognition that school intakes differ. Perhaps they are worth keeping for that reason alone.
- Emerging, expected, exceeding
- The underlying values for this chart are shown in the table below
Want to stay up-to-date with the latest research from FFT Education Datalab? Sign up to Datalab’s mailing list to get notifications about new blogposts, or to receive the team’s half-termly newsletter.


On this point I enjoyed another post on this subject (which you’ve probably read already) https://www.sigplus.co.uk/2023/05/the-shape-of-progress/
Also, I noticed that the data in the table below the words “However, special schools would also be much worse off if EYFSP scores were used.” are the same as that of the Primary v Junior table, just with column headings of Mainstream and Special – guessing this will need to be corrected 🙂
Thanks Laura- that was a good spot. Sadly the table with scores for pupils in special schools seems to have been lost in the ether.
The EYFSP score is indeed an interesting distribution. It it reminiscent of the “spike-and-slab” distribution that can be used for variable selection in high-dimensional regression settings. Perhaps an IRT model with spike-and-slab priors could provide insights into the mechanism(s) of data generation?
The distribution of the phonics scores is also interesting. Perhaps it is a mixture of two distributions and/or of more than one dimension? (relating to pupil, teacher or other factors).
Perhaps also a major factor that influences both scores is the judgments of individual teachers? For example, I found that variation between the judgments of individual clinicians accounted for approximately the same amount of variance in “Health of the Nation Outcome Scales” as variation between patients (see https://www.medrxiv.org/content/10.1101/2020.11.19.20234674v1.full).
Hi Jonathan. Many thanks- there’s a lot to digest here. On the variation between teachers, unfortunately data linking teachers to pupils is unavailable although we could do something with schools that are one form of entry. I must confess I’m not familiar with the (I assume) Bayesia n approach to IRT you suggest- what would be the advantage of this over a more conventional IRT analysis?
Bayesian and ‘conventional’ (actually termed ‘Frequentist’) approaches can estimate the same IRT models and often generate the same general pattern of results. The practical advantage of Bayesian estimation is that it can be (much) more robust (the practical disadvantage is that it can take much longer for the estimation to run!). But, there is a much more important *theoretical* advantage. This is that Frequentist estimation calculates the probability of the observed distribution of the data assuming that the “null hypothesis” (H0) of no effect is true. As I understand it (I’m a clinician, not a statistician), this approach has two major drawbacks. First, it is possible to obtain ‘significant’ findings by creating an aribtrarily-unlikely null hypothesis. Second (related), this approach does not test what we actually want to know – which is how well our model fits the data.
In mathematical notation, the Frequentist approach estimates: p(data|H0 – where ‘|’ means “conditional on”) and if this p-value is small, then we reject H0 in favour of some alternative hypothesis (H1 – even though we may have no independent positive evidence that H1 is in fact better!). But, what we really want to know is p(H1|data). That is, the data are given (literally) and immutable, so we want to know how well our model (H1) fits the data. In this case, if the p-value is *large*, then we can conclude that the model fits (can explain) the data. (I hope I’ve got that right – as I say, I am a clinician).
Of course, Frequentist methods are now ‘traditional’ and well-rooted in the way that we generally work. If I recall correctly, my analysis of HoNOS scores used Frequentist estimation. As I said, Bayesian and Frequentist methods often give very similar results (especially with large samples) and Bayesian estimation can take much longer. But, when you have “interesting” distributions (like the EYFSP and Phonics scores) and are playing for very high stakes (is anything more important than children’s early years?) then the robustness of the Bayesian approach may make it worthwhile.
HTH
Jonathan
PS, another reason to use Bayesian estimation for your present purpose would be to avoid difficulties of inference. I imagine that, with such strangely-distributed data, the residuals from your analyses are non-normal. But, as you know, normal (iid) residuals are a pre-requisite for inference using standard test statistics. In contrast, Bayesian estimation generates the not-necessarily-normal probability distribution of each and every parameter in the model. I understand that, technically, it treats every parameter (every fixed and random effect) as a random effect. Then, it is possible to test if terms are ‘significant’ by checking their probability directly agains their modeled distribution.
Huge thanks- and a perfect explanation of the transposed conditional! We’re often quite blase in education- I’ve never really invested the time I should have in investigating the merits of Bayesian methods as the datasets we work with are pretty large. Interestingly though (and IIRC), though the distribution of EYFSP scores is unusual, the residuals are (relatively) normal when it is used as a measure of prior attainment- though there’s every chance I haven’t remembered that correctly. Either way, an IRT of the FSP scales could well be instructive- will add it to the to-do list.