Students around the country are receiving their results for A-Levels and other Level 3 qualifications today.
As always, we've analysed the data published by the Joint Council of Qualifications and Ofqual to bring you all the facts and figures that you need to know.
It should be remembered that only around a third of young people go on to enter A-levels. Lots of other routes at Level 3 exist including BTECs and T-Levels. Credit to JCQ and Ofqual for making data on these qualifications widely available this year.
But data on achievements in qualifications at Level 2 and below still seems conspicuous by its absence.
Grades have fallen back to 2019 levels
This year's students faced disruption to their education throughout the pandemic and beyond. And some have questioned whether the decision to return to pre-pandemic grading standards is fair.
Whether it is fair or not, this decision was taken back in autumn last year, and grade distributions this year are almost exactly the same as in 2019.
In 2019, for example, 25.0% of A-Levels were graded A or above. This year, it was 26.5%.
Last year, under the different grading standards used, it was 35.9%.
At grades A*-C, attainment in 2023 was almost exactly the same as 2019 (75.4% compared to 75.5%)

But some subjects have seen more differences than others
As we've already mentioned, Ofqual’s policy was for grades last year to sit at the midpoint between 2019 and 2021. But this didn’t always appear to be the case when things were broken down by subject.
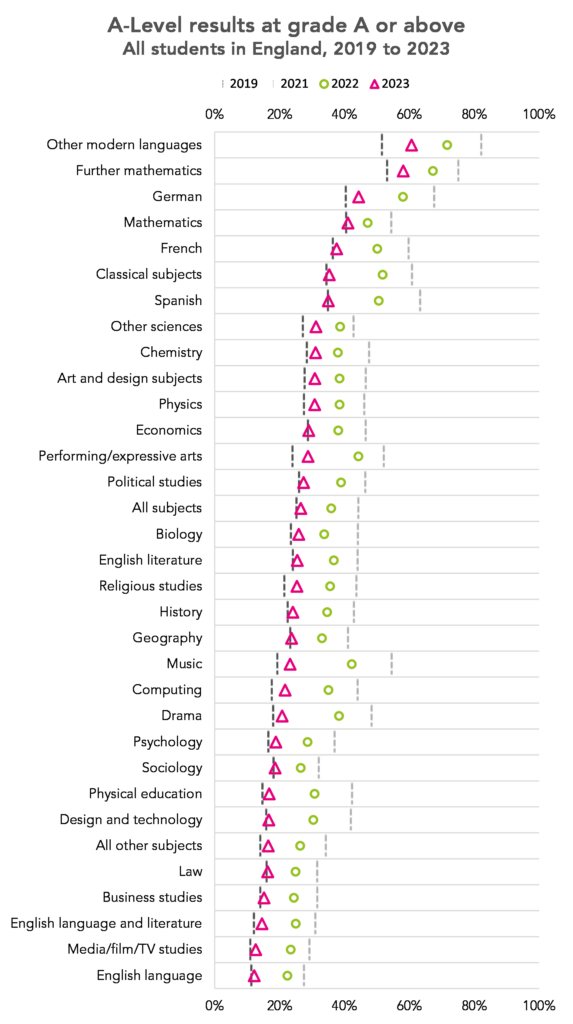
This means that some subjects have seen grades fall more this year than they did last year, as shown below.
Subjects with a particularly large fall in top grades include music and drama, and those with a relatively small fall includes maths and chemistry.
In most subjects, the percentage of entries awarded A*-A in 2023 was slightly above the figure for 2019. However, it was only just higher in subjects such as Spanish, economics, law, geography, sociology and mathematics.
The chart below allows you to select an A-Level subject and see the grade distribution in 2019, 2021 and 2023.
Entries to some subjects are down compared to last year
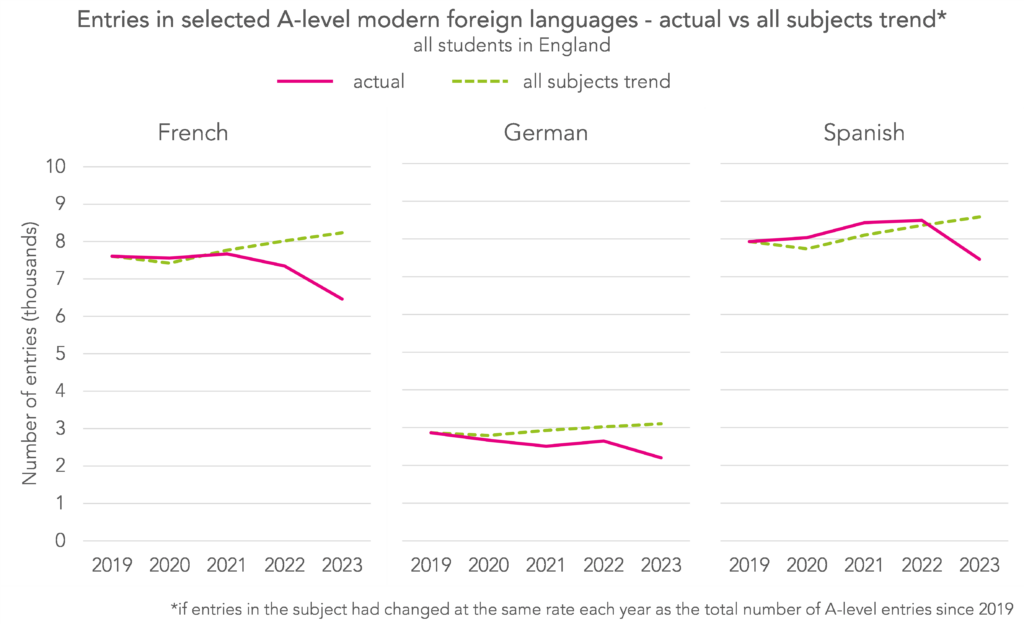
While entries are up overall compared to last year, some subjects have seen falls in entry numbers. Modern foreign languages have fared particularly badly this year: the three subjects with the largest fall in entries are Spanish, French and German.
Some subjects have, of course, seen increases in entries: computing has seen the biggest increase - entries are up by 16.7%.
The chart below shows the entry numbers for every subject this year. The top three subjects are unchanged from last year. Economics has entered the top ten for the first time, while geography has fall out of the top ten.

But entries are higher than in 2019 in many subjects
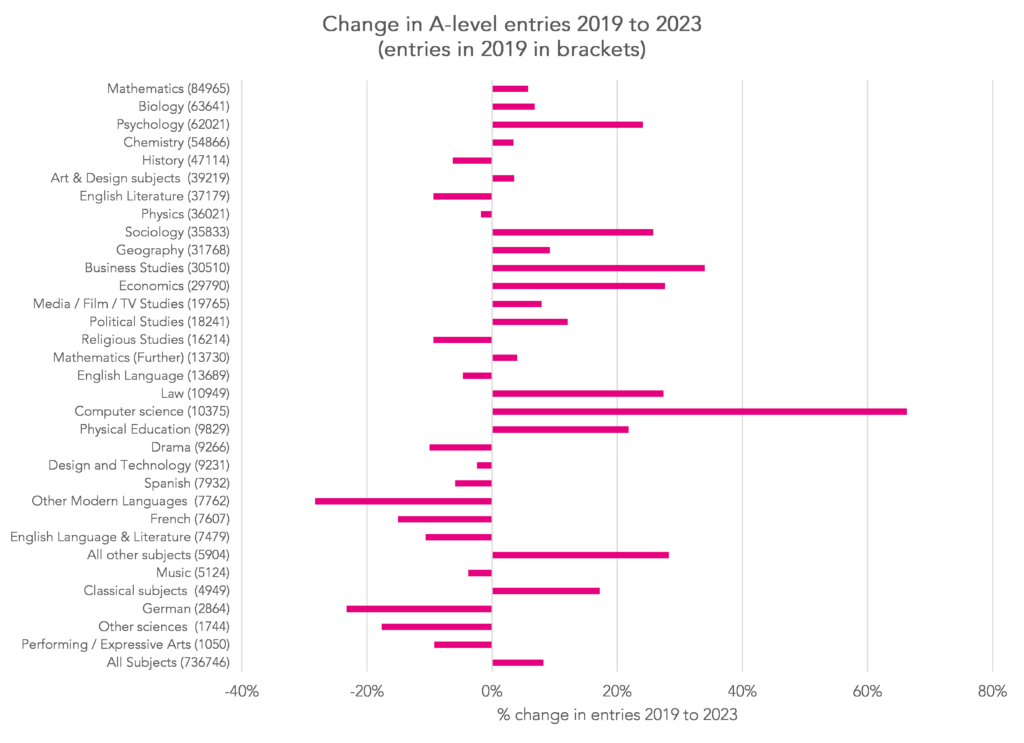
Compared to 2019, there has been an increase in 8% in the number of A-level entries across all subjects.
However, we think there was only a 4% increase in the 18 year old population in England over this period, from 619,000 to 648,000.
Consequently, we might infer that a greater percentage of the population has studied A-levels.
Some subjects have become increasingly popular over that time.
In particular, psychology, sociology, economics, business studies and computer science have become much more popular.
Meanwhile, modern languages, English, history and religious studies have become less popular.
Given the approach to grading used by Ofqual known as comparable outcomes, we would expect (all other things being equal) the overall national grade profile to fall if more students entered A-levels.
Of course, all other things have not been equal over the last few years. But changes in student composition (e.g. the prior attainment profile) may explain why there were larger differences in attainment in 2023 than in 2019 in some subjects.
Grades in Wales and Northern Ireland remain higher than in England

We saw last year that proportion of A-levels awarded the top grades had been slower to fall to pre-pandemic norms in Wales and Northern Ireland than England, and this seems to be true again. While the proportion of grades awarded an A* or an A was 1.3 percentage points higher this year than 2019 in England, in Wales it's 7.5 percentage points higher, and in Northern Ireland it's 8.1 percentage points higher.
A-levels in Northern Ireland and Wales are not regulated by Ofqual, so we wouldn't necessarily expect their approach to getting back to pre-pandemic grades to be the same as England's. AS-levels remain a constituent part of A-levels in Northern Ireland and Wales too, so their A-level results this year will contain results from exams taken last year when grades were generally higher.
In England, grades are highest in the South East and lowest in the North East
Regional differences existed long before the pandemic, but gaps widened last year and are very much still there this year.
Nearly a third (30.3%) of A-Levels taken in the South East were graded A* or above this year, compared to 22.0% of A-Levels taken in the North East.
And, while most regions have seen a small increase in top grades compared to 2019, the North East and Yorkshire and the Humber have seen small decreases. London has seen the largest increase – top grades in the capital are up by 3.1 percentage points.

The gender gap has closed
During the pandemic, a gender gap in grades opened up between male and female A-Level students. At its peak in 2021, 46.4% of A-Levels entered by female students received a grade A or above, compared to 41.7% of those entered by male students.
This year, the gender gap looks very similar to how it did in 2019: in both years, A-Levels entered by male students were slightly more likely to receive a top A* grade. Again in both years, there was little differences in A-Levels graded A or above, while A-Levels entered by female students were slightly more likely to receive a grade B or above.

State and independent school gap
Much was made of the increase in A*-A awarded by independent schools in 2020 and 2021 when exams were cancelled.
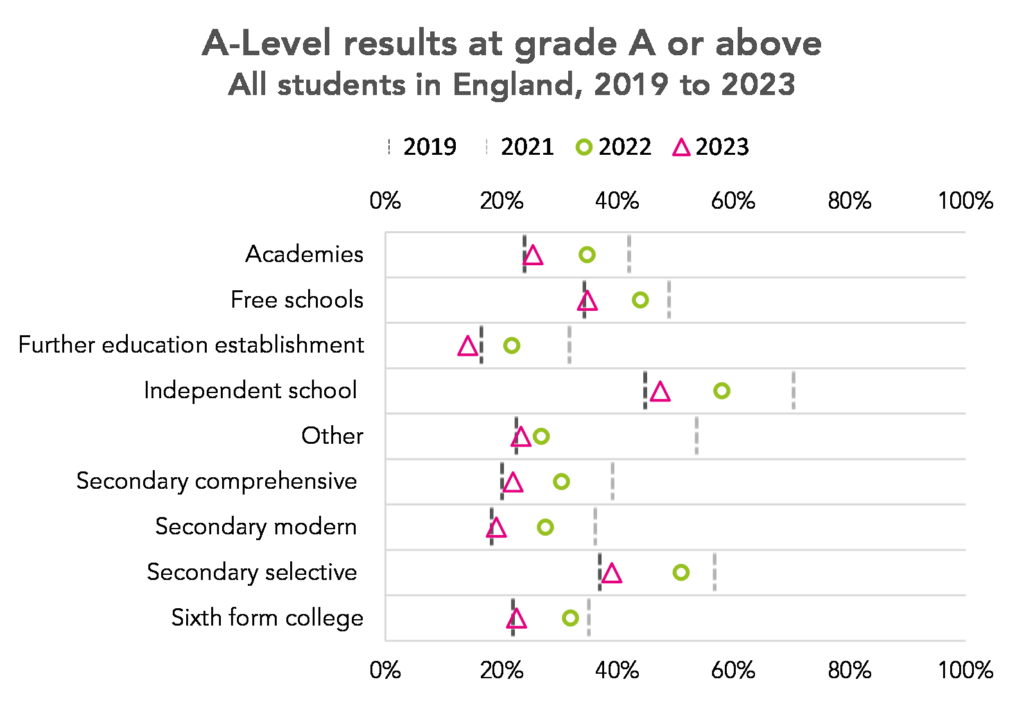
Data published by Ofqual shows that across all centre types, attainment at grades A*-A in 2023 was broadly similar to 2019.
In independent schools, 47.4% of entries were awarded grade A*-A in 2023 compared to 44.8% in 2019.
However, in FE establishments, the 2023 figure (14.2%) fell below the 2019 figure (16.5%).
A note of caution with the above chart is that the centre types are self-declared by centres. For example, the underlying data shows that there were 79 secondary selective schools- less than half the true number.
Data on VTQs and T-Levels was published for the first time
255,000 certificates in Level 3 vocational and technical qualifications (VTQ) were awarded today: 213,600 Applied Generals and 41,400 Tech Levels. The most popular subject areas were “business, administration, law” with 61,200 certificates, “health, public services and care” with 36,900 and “social sciences” with 36,500. Around 9% of entries were awarded the top grade possible.
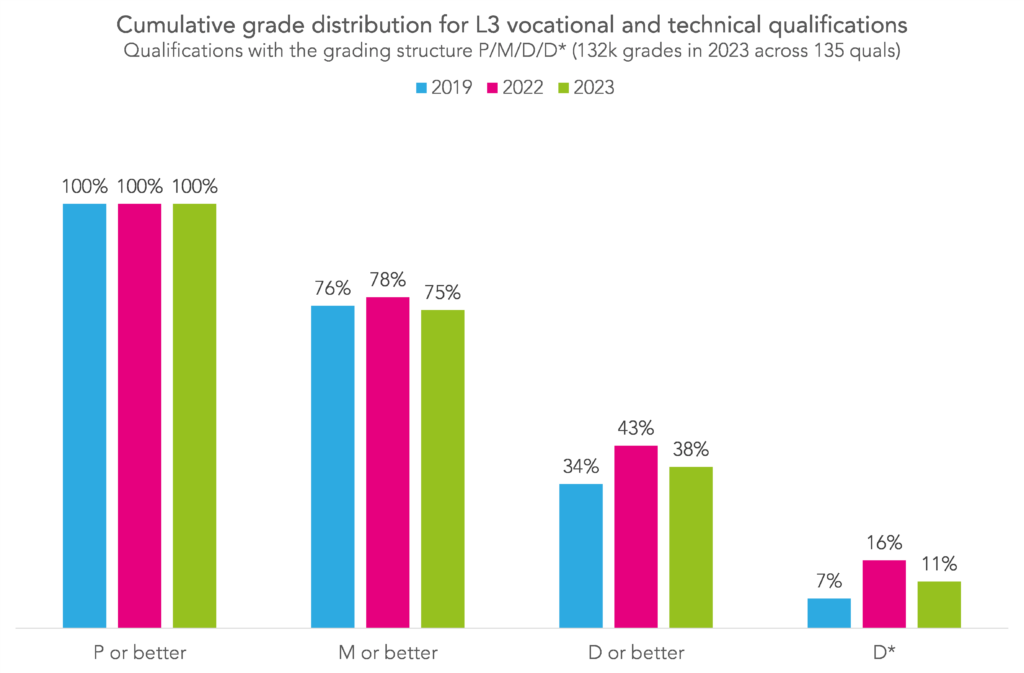
Broadly, VTQ results look lower than the past three years, but still slightly higher than 2019. Using qualifications graded as P/M/D/D* as an example (the most popular type, with around 132,000 grades awarded), 11% of grades awarded were D* this year, compared to 16% last year and 7% in 2019. More details are available here.
Additionally, around 3,500 students are receiving T-level results today. The overall pass rate is 91%, with 22% of students achieving at least a Distinction (0.3% got a Distinction*, the highest possible grade). This is down on last year, the first year any T-levels were awarded, when the pass rate was 92% and 32% of students achieved at least a Distinction. This is largely because last year’s results contained some teacher assessed grades for the “Core” component, though results for the “Occupational Specialism” are also lower. More details are available here.
Results (both for VTQs and A-levels) only ever tell you about those who entered, never about those who dropped out. Reports suggest though that as many as one in three T-Level students dropped out before completing their course. Of course, not everyone who starts A-levels or level 3 VTQs completes either. Prior to the pandemic, and in schools only, around 80% of those who started went on to complete (though this increased during the pandemic). This will be a topic we will return to later in the year.
Summing up
As expected, results in A-levels and level 3 VTQs have largely fallen back to 2019 standards although there is some variation between subjects, centre types and regions.
Attainment at A*-A at A-level has improved in London and the South East but fallen in the North East and Yorkshire and the Humber. This might be related to the uneven effect of the pandemic but clearly more work will need to be done to pinpoint causality.
What the data doesn't tell us though is how the quality of work produced by students compares to pre-pandemic standards. But that's probably one for another day.



I think there is a typo in the paragraph about the gender gap – you say “at its peak in 2019” whereas the graph below shows the peak gap to be in 2021. Unless you mean something different by “peak”.
Good spot, thank you! Updated in the post
I am always struck by the variability in % A and above across the different subjects. I remember reading a research paper that looked at within subject marking variability between examiners and how the range was tightest for subjects such as maths, further maths and physics and huge variation in heavily essay based subjects. The figure above on the %A or above seems to bear that out, especially when you look at the grade distributions.
It can’t simply be a difference in cohorts – mathematicians are not better at passing exams than English language students or Biology students because they are brighter (say) unless we say that the bar to entry to those A-levels is lower, which I know from experience it isn’t. It suggests to me that where the ‘correct’ answer is definitively so and there is no opportunity for semantic variation or interpretation (symbols in maths have a very precise meanings, whereas words have a lot more baggage), then it is more likely that the cohort will have a more skewed grade distribution.
The exception seems to be MFL but I imagine all sorts of confounders around whether those courses also attract more candidates with fluency or familial links to the language.
Anyway just a thought arising from your great analysis and thank you for producing it.
That’s very kind, thank you. Lots of interesting points here. I think we’d be tempted to say that there are variations in prior attainment between those who enter maths and those who enter English language- see this for example https://ffteducationdatalab.org.uk/2022/12/how-much-does-prior-attainment-in-english-and-maths-vary-by-key-stage-5-subject-choice/. On top of that, I think that some subjects are graded more severely – for example students who enter physics tend to achieve higher grades in their other subjects https://ffteducationdatalab.org.uk/2022/06/why-a-level-physics-students-are-doubly-penalised-by-grading-severity/. All of this is on top of variations in marking/ grading reliability- which I think is under-researched.
I can see that prior attainment would be a key factor when comparing some subjects – e.g. Further Maths students have very strong prior attainment, whilst English Language students have weaker GCSE results. However, I’m intrigued why the Computing A/A* levels are low compared to other subjects. In the article that you refer to about Physics, students studying Computer Science appear to get comparable results in Maths compared to students studying Chemistry, Biology, Geography and Economics, yet the overall A/A* rates for Computer Science are considerably below the rate in all those subjects.
I wonder if it was necessary to move the grade boundaries for Computer Science up so much in 2023.
Hi Andrew. Are you referencing this post https://ffteducationdatalab.org.uk/2022/06/why-a-level-physics-students-are-doubly-penalised-by-grading-severity/? If so, that shows that those who study computer science, maths and physics (all 3) tend to achieve higher grades in maths than they do in CS/ physics. In short, CS is graded more severely.
With respect to Level VTQs, is there any comparative data available showing the proportion of students that completed the qualification, but received an unclassified grade?
This would generally be as a result of failing one or more of the externally assessed exam units.
Hi Paul. So far as I can see, this hasn’t been published. This dashboard does give the option to see the total number of grades that were awarded under each grading structure and the cumulative % at each grade (and some other info), but doesn’t seem to include those that received an unclassified grade. A dig around Ofqual’s analytics might reveal more.
Just noticed it’s on the DfE provisional statistics release https://explore-education-statistics.service.gov.uk/find-statistics/provisional-t-level-results
Is it possible to find the % of students awarded each of the different grades in different subjects?
Hi Kevin. If you have a play with the interactive chart in this post (the second chart in the ‘But some subjects have seen more differences than others’ section) you should be able to see the % awarded each grade for a subject of your choice. Just select the relevant subject from the dropdown menu.
Hi,
Is there any chance that the extra A level entries are coming from students who completed KS4 abroad? For example, how is are STEM subjects divided between state vs independent pupils and also KS4 in England vs KS4 abroad. It may not be that more sixth formers in the UK are studying A levels but that there is an influx of British students who have lived abroad and are entering for A level study.