Our analysis of GCSE results 2023 is now out – you can read it here.
GCSE results are out on Thursday. As always, we’ll be publishing analysis on the day. And you can sign up now to receive a notification as soon as it comes out.
Early Results Service
FFT’s Secondary Early Results service is the fastest way to get a national analysis of all your 2023 results before the Autumn term.
Free to all Aspire schools, this year’s service has been extended to include A-levels as well as KS4.
Aspire schools can upload results now.
Not an FFT Aspire user? Learn more here.
But today we’re spoiling you with a preview of what we’re expecting to see when this year’s results are published.
Grades in England will fall back to pre-pandemic levels
Back in autumn last year, Ofqual confirmed that grades this year would return to pre-pandemic levels.
For anyone who’s not clear on why grades were higher during the pandemic, here’s a quick primer. In both 2020 and 2021, public exams were cancelled and grades were awarded using different systems, known as Centre-Assessed Grades (CAGs) and Teacher-Assessed Grades (TAGs).
The grades awarded using CAGs and TAGs were higher, on average, than those awarded in more typical years. And last year, to avoid a sudden sharp fall in grades, they were adjusted to a level between their peak in 2021 and the level in 2019, the year before the pandemic affected exams.
The chart below shows how grades have looked over the last five years.

Given Ofqual’s announcement, it’s no surprise that we’re expecting grades to fall considerably this year.
Last year, just over three-quarters (75.4%) of GCSEs were graded at 4 or above. This year, if grades return to exactly the level we saw in 2019, we can expect just 69.9% to receive a grade 4 or above.
We should note that Ofqual’s announcement only applies to grades in England – we expect grades in Wales and Northern Ireland to remain above 2019 levels this year, as we saw at A-Level.
The disadvantage gap may be wider than ever
This isn’t strictly one to look out for on the day, because official figures on the disadvantage gap measure won’t be published until later in the Autumn term.
But last year, the difference in grades between disadvantaged pupils and their peers was the widest in ten years. The widening of the gap is likely to be related to the effects of the pandemic, which in many cases have hit disadvantaged pupils harder. For example, as we’ve shown in our analysis of attendance data, disadvantaged pupils are more likely to have missed a lot of school than their peers.
Although we won’t get an update on the disadvantage gap on Thursday, we probably will get some other figures that will give us some clues on what to expect.
We’ll be keeping our eyes peeled for figures on how grades in independent schools compare to those in state schools. This gap reportedly widened in this year’s A-Level results and may be set to do the same at GCSE.
As shown below, pupils in independent schools tend to be far more likely to achieve top grades at GCSE than their peers – with the exception of those in state-funded selective schools.

The increase in top grades in independent schools during the pandemic was controversial at the time, but grades fell back considerably last year.
Gaps between regions may also widen
Last year, the gap in top grades between regions increased slightly. And we may well see the same this year.
In London, nearly a third (32.6%) of GCSE entries received a grade of 7 or above last year, compared to 22.4% in the North East. This is a difference of 10.2 percentage points between the region with the highest and lowest proportion receiving a top grade.
In 2019, the difference was 9.3 percentage points.
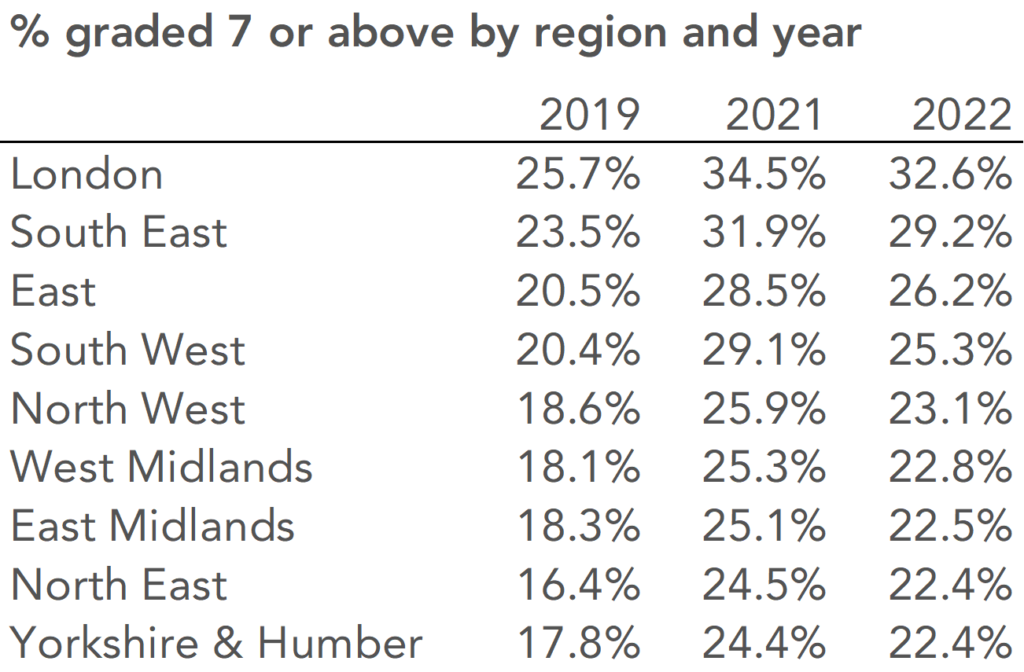
London has also seen the highest increase in top grades since 2019; grades are up by 6.9 percentage points. The region with the lowest increase, the East Midlands, saw an increase of just 4.2 percentage points from 2019.
One possible reason for the increased gap between regions are regional differences in attendance for last year’s GCSE cohort, which you might expect would translate into differences in grades.
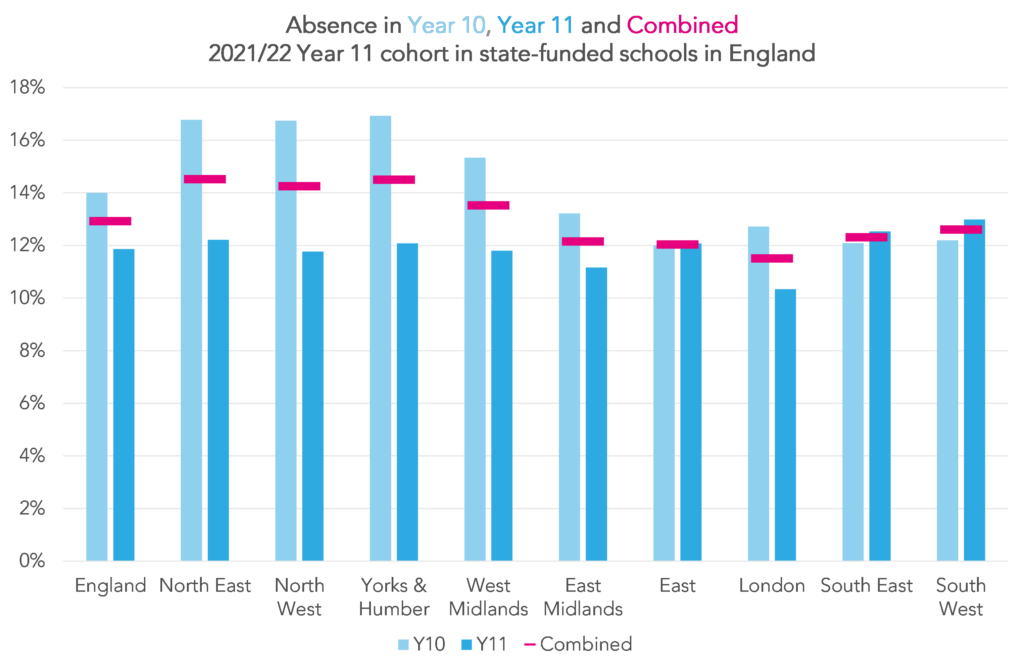
Year 11 pupils in London schools tended to miss less school than Year 11 pupils in other regions., while pupils in northern regions tended to miss the most school.
Analysis of attendance figures for this year’s Year 11 shows that once again, pupils in London had the lowest absence rates. However, rates of persistent absence – defined as missing at least 10% of sessions – were lowest in the East Midlands. The South West had the highest levels of both overall and persistent absence.
So we can probably expect to see the gap between London and the rest of the country widen again this year. But we’ll be interested to see whether the lower attendance in the South West translates into lower grades in the region.
Entries will be up in classical subjects, but down in languages and the arts
Provisional data from Ofqual suggests that entries numbers are up 3.6% compared to last year, probably at least partly because of an increase in the population of 16 year olds. Published DfE statistics for 2023 show an increase in full-time 15 year old pupils of 3.4% compared to 2022.
But some subjects have seen increases well above 3.6%, and some well below, as shown below.

We expect to see the largest increase in classical subjects, which are set to increase by 24.7%. Entries to classical subjects at A-Level also increased this up by 20.5%. Although before the classicists get too excited, we should point out although these are large increases in percentage terms, they are small in terms of entry numbers. The increase at GCSE is of less than 1000 entries, from 3595 to 4480.
Most of the other subjects with large increases in entries at GCSE this year also saw increases at A-Level, including the social sciences, business studies and computer science. Although the increase in GCSE statistics doesn’t correspond with an increase in the numbers studying A-Level maths, which increased roughly in line with the increase in A-Level entries.
At the other end of the scale, we’re expecting to see a fall in entries to arts subjects, including performing / expressive arts, music, drama, and art and design.
German, ancient languages and French – which all count towards the languages element of the EBacc – are towards the bottom of the list, although entries to other modern languages are continuing to recover after a sharp fall during the pandemic. This all reflects longer term trends in language entries.
Early entries will be up this year
The majority of GCSE are, of course, taken by Year 11 pupils. But some pupils do take resits in Year 12 or later (or which more in a moment) while others take exams early.
The subjects in which early entries are by far the most common are other modern languages and ancient languages.
Presumably the high proportion sitting GCSEs in other modern languages early reflects the fact that many pupils are studying community languages that they also speak at home or outside of school. But we assume that the same does not apply to the high proportion who sit ancient languages early.

The proportion of entries to other modern languages that were taken early fell sharply during the pandemic, but showed signs of recovery last year.
And this year, we expect the proportion of early entries to other modern languages to be slightly above the pre-pandemic level, although levels in all other subjects are expected to remain below.
And resits will also be up
As promised, I’ll finish up by returning to the question of resits in Year 12 or above.
Pupils who do not achieve at least a grade 4 in GCSE English and maths are currently required to resit the relevant GCSE.
As mentioned earlier in the post, GCSE grades in 2020 and 2021, which were awarded via CAGs and TAGs, were higher than in more typical years. And, as we’d expect, the number of pupils taking resits in the following years was lower than usual, because more pupils reached the grade 4 threshold.
As GCSE grades last year were lower than those in 2021, we’d expect to see the number of resits increase this year. And that is indeed what the provisional data suggests.
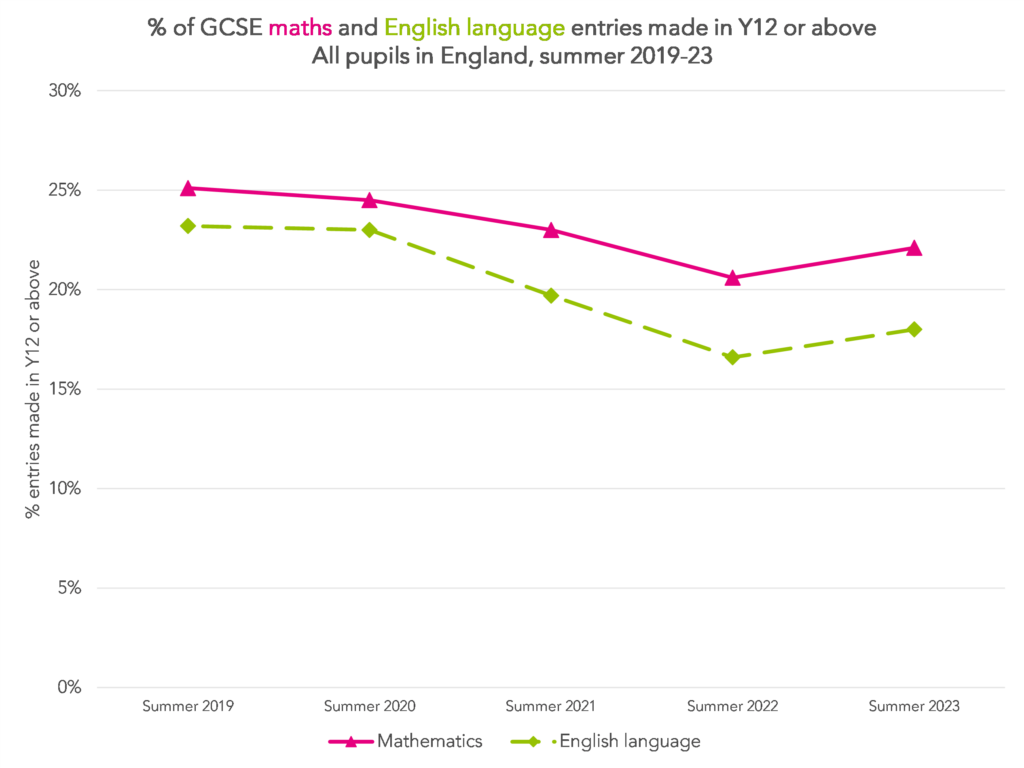
As this year’s grades are expected to fall again, we can expect resits to return to much closer to 2019 levels next year.
But we may well find that a higher of proportion of late entries receive grades 9-4 this year than in the last two years, again as a consequence of lower grades last year.
Don’t try to calculate Progress 8 using last year’s Attainment 8 estimates
Progress 8 is the main headline performance indicator used in School Performance Tables for secondary schools although it is not without its faults.
Many schools will want to know what their Progress 8 score for 2023 will be. However, as the score depends on results achieved in all state-funded mainstream secondary schools in the country, it is not something an individual school can calculate on the day.
In order to calculate it, schools need to know the average Attainment 8 score of all pupils nationally for a given level of Key Stage 2 attainment.
National tables showing this for the 2022 cohort were published in the DfE Secondary School Accountability Guidance (Table 35).
So why not use this to get a rough idea about Progress 8 in 2023?
Well, as we set out at the top, this year’s results will tend to be lower than in 2022. Consequently, the Attainment 8 estimates shown in Table 35 will be too high. There is a risk that schools might end up calculating a lower figure than will be calculated by DfE in October.
Want to stay up-to-date with the latest research from FFT Education Datalab? Sign up to Datalab’s mailing list to get notifications about new blogposts, or to receive the team’s half-termly newsletter.


Great blog. However I wouldn’t refer to resits as ‘late entries’, rather Autumn resits. Late entries is a term used by all Awarding Organisations to denote exam entries that are submitted to them after the series entry deadline date has passed.
Thanks Lee. Yes you’re absolutely right. We’ve changed that.
Hi- do early entry MFL languages count towards p8. For example a student who sat their Spanish exam in year 10, can the result be used for their p8 in year 11.
Hi. Yes it can. Early entries taken between January 2020 and August 2021 (so when CAGs and TAGs were awarded) weren’t counted in P8 in 2022. But Y10 entries awarded between September 2021 and August 2022 will be counted in P8 in 2023.