In October, the DfE announced (pdf) changes to this summer’s Key Stage 4 performance tables, adding the percentage of pupils entered for an EBacc language (and triple science) as headline measures. They also announced a consultation on plans to incentivise take-up of the full EBacc – you can read our thoughts here.
Schools have two potential “levers” to pull if they want to respond to “incentives” to increase language entries:
- add more classes
- add more pupils to existing classes
Clearly, for option 1. to be feasible on a national scale, we’d need a big increase in the supply of languages teachers. So in this post, we’ll be looking at what kind of increase could be achieved by option 2.
We looked at this topic before using data from 2015, so we’ll also show how the picture has changed since then.
Assumptions and data
In line with our previous work on the topic, we’ll make the following assumptions:
- Only pupils who took an exam and received a grade are counted as being in a class
- Any language other than French, German or Spanish[1] is not taught in a class and taken only by pupils who speak the language at home, i.e. a community language
- If three or fewer pupils did one of French, German or Spanish at a particular school, we assume there was no taught class, i.e. it was taken by pupils for whom French, Spanish or German was a community language
- A “full” class has 30 students. If a school is observed with 31 pupils, we assume they were taught in two classes.
We’ll use provisional 2023 Key Stage 4 school-level data for mainstream state-funded schools linked to provisional qualification and subject data[2].
Number of spare seats by subject
First, let’s look at how many “spare seats” there were by subject in 2023.

Overall, there were around 283,000 entries to EBacc languages. A further 83,000 or so entries would have been possible if all classes had 30 pupils. French had the most entries and the most “spare seats”, closely followed by Spanish, with German in a distant third place.
However, some of these spaces – around 7,000 – were in schools where all or almost all pupils were already taking a language.
Distribution of schools with and without spaces filled
To address this, we need to perform the calculation at the school-level. Below we plot the distribution of schools by the percentage of pupils who did an EBacc language in 2023 (dark pink) and the distribution with all “spare seats” filled (pale pink)
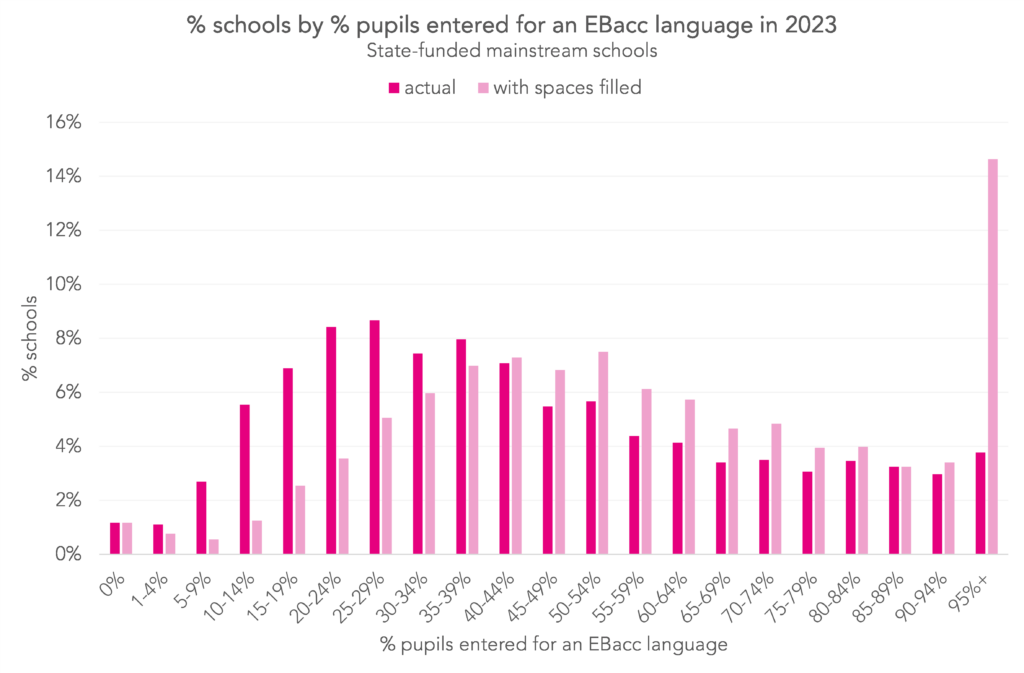
At the school-level, the most common proportion entered for EBacc languages last year was 25-29%, and the median was 40-44%. With all spaces filled, the most common proportion would be 95%+, and the median would be 55-59%.
At the national level, filling all “spare seats” would increase the proportion of pupils taking languages from 46% to 58% – an increase of 12 percentage points. In other words, without increasing the number of classes (and therefore teachers), the maximum percentage of pupils who could have been entered for languages last year would have been 58%.
How things have changed since 2015
When we did this analysis in 2015, around 50% of pupils had been entered for EBacc languages, and the percentage who could have been entered had all classes been full was 65% – around 15 percentage points higher.
Since 2015, however, the underlying pupil population has grown substantially. This is shown below, where we plot the number and percentage of pupils entered for EBacc languages against the number of pupils in the overall cohort[3].
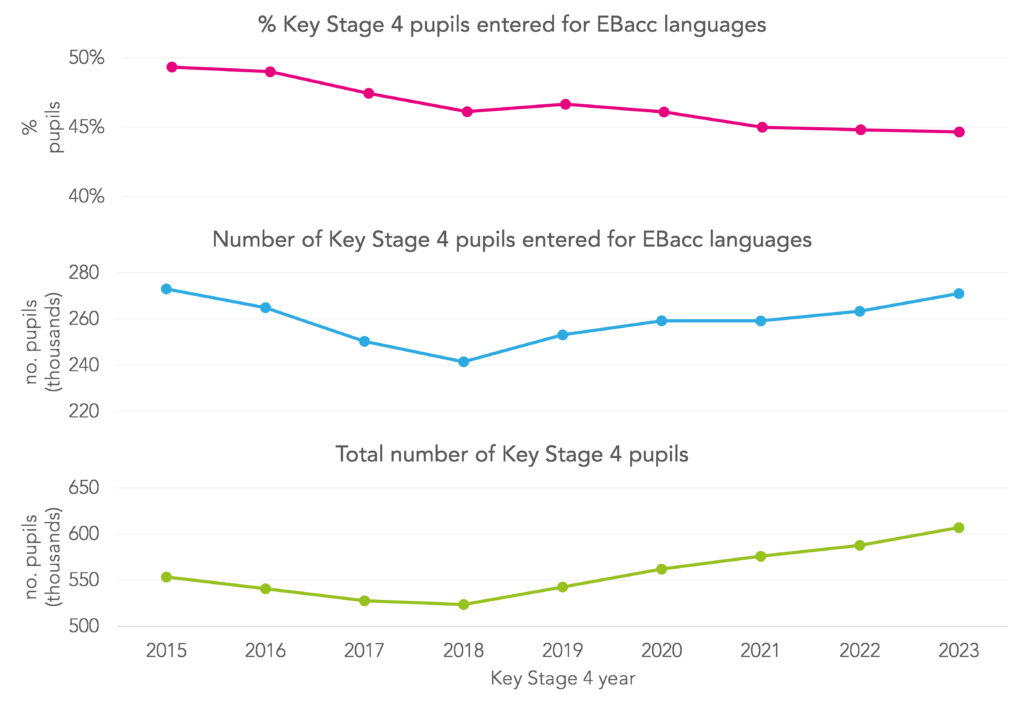
So to see how the number of “spare seats” has changed since 2015, it makes more sense to look at pupil numbers rather than percentages.
Below, we plot the number of pupils entered for an EBacc language in 2015 and 2023, and the additional number of pupils who could have been entered had all “spare seats” been filled.

Overall, a similar number of pupils did EBacc languages last year as they did in 2015. And the number of spare seats, though slightly smaller in 2023, is also similar.
We can express the difference more intuitively by calculating the average inferred languages class size in 2015 and comparing with 2023. Doing this yields an average class size of 22.61 in 2015 compared with 22.66 in 2023. This is roughly equivalent to one in twenty schools having added a single pupil to each of their languages classes.
Summing up
Under our model, the maximum percentage of pupils who could have been entered for languages last year without adding extra classes (and therefore extra teachers) would have been 58%. This is some way short of the Government’s ambition to have 90% of pupils taking the full EBacc, for which languages take-up is the limiting factor, by 2025. (The ambition of 75% by 2022 has already been missed.)
It’s also interesting that the number of “spare seats” in languages classes has barely changed since 2015. This could be because school leaders have actively chosen not to increase the number of pupils in their language classes (perhaps for good reason, given that languages are consistently the most harshly graded of all GCSEs). In which case new incentives might have some impact. But it could also be that schools don’t have as many “spare seats” as we think, given that we’ve based our estimated class sizes only on pupils who received exam results.
Either way, it’s hard to see how the number of pupils taking languages can be substantially increased without more teachers.
Want to stay up-to-date with the latest research from FFT Education Datalab? Sign up to Datalab’s mailing list to get notifications about new blogposts, or to receive the team’s half-termly newsletter.
[1] There are spare seats in Greek and Latin classes, but these courses tend to be delivered in schools where all pupils take a language, so we’ll ignore them here.
[2] Downloadable from here – we filtered the Key Stage 4 results file by rectype = 1
[3] In this chart, we use all state-funded schools (including special schools), while in the rest of this blog we use all mainstream state-funded schools. The percentage of pupils entered for EBacc languages in this chart will be lower than quoted elsewhere as a result.


Leave A Comment