The Department for Education recently announced that it planned to make some changes to the English Baccalaureate (EBacc) average point score measures that it publishes in Secondary School Performance Tables to incentivise entry in all 6 subjects: English, maths, two sciences, a humanity and a modern or ancient foreign language.
For all the noise about the EBacc since it was introduced by Michael Gove in 2011, it hasn’t really caught on. Published statistics for 2023 show that just 39% of pupils entered all 6 subjects.
This is largely due to low take-up of languages. Just 45% of pupils entered a language in 2023. This compares to 82% of pupils who entered a humanity (history or geography) and 95% who entered two sciences. Not only that, the 45% is boosted by a proportion of pupils entering a GCSE in their home language. We warned in 2016 that low numbers of MFL teachers would make the EBacc hard to deliver.
Given that the idea of performance measures is to drive behaviour, I’m not sure why changing the EBacc average point score would be worthwhile, unless DfE thought that schools could solve their own recruitment problems.
There is also the issue, as reported in TES, that DfE are supposed to give schools advance notice of changes to accountability measures.
But leaving all that to one side, what could be done?
Option 1: Do nothing
If you go to the DfE Compare School Performance website, you will see that there are currently six headline measures for secondary schools:
- Progress 8 score
- Attainment 8 score
- % entered for the EBacc
- EBacc average point score (APS)
- % achieving grades 9-5 in English and maths
- % staying in education and employment
1-5 are measures based on Key Stage 4 Performance. 6 is a measure of post-16 destinations for the previous KS4 cohort.
DfE plan to add two further headline measures: the percentage of pupils entered for triple science and the percentage of pupils entered for a language. These measures are already published but will be given greater prominence.
The % entered for the EBacc measure in itself incentivises entry in the EBacc. The more pupils who enter all 6 subjects of the EBacc, the higher the figure is.
The EBacc APS measure also already incentivises entry to some extent. Any subjects not entered score 0. So a pupil who achieves a 5 in English, a 5 in maths, 55 in double science, a 5 in geography but does not enter a language would achieve an APS of (5 + 5 + 5 + 5 + 5)/6 = 4.17.
In other words, there are already 2 indicators that incentivise EBacc entry to a greater or lesser extent.
Option 2: Award bonus points for entries
A second option may be to increase the “gap” in points scores between not being entered and the lowest grade possible.
Let’s imagine we increased the size of the gap by 5 points. This would mean that a grade 1 would score 6 points, a grade 2 7 points and so forth.
So in our example above, the APS for the pupil in question would be 8.33.
In the table below, we compare the EBacc APS for this Pupil (Pupil A) with a similar pupil who achieved identical results in English, maths, science and humanities but who also entered a language, in which they achieved a grade 2.
|
Pupil A |
Pupil B |
|||
|
Grade |
Points | Grade |
Points |
|
| English |
5 |
10 | 5 |
10 |
| Maths |
5 |
10 | 5 |
10 |
| Science 1 |
5 |
10 | 5 |
10 |
| Science 2 |
5 |
10 | 5 |
10 |
| Humanities |
5 |
10 | 5 |
10 |
| Languages |
Not entered |
0 | 2 |
7 |
| APS |
4.17 |
8.33 | 4.5 |
9.5 |
So while Pupil B would currently achieve a higher EBacc APS, the difference would be greater if bonus points for entries were included.
An extreme form of this would be to only award points if all subjects were entered. This would mean that Pupil A achieves an EBacc APS of 0.
Option 3: Change Progress 8
For whatever reason, the headline indicator that seems to dominate the secondary school landscape is Progress 8.
This is a value-added measure based on Attainment 8, a performance measure based on pupils’ achievements in English (double-weighted[1]), maths (double-weighted), 3 EBacc subjects and 3 “open” slots for any subjects not already counted. More detail can be found in the DfE secondary school accountability guidance.
I wonder whether changing Progress 8 would be more of an incentive to schools (not that I’m suggesting that it is necessary or desirable). Including “slots” for EBacc subjects certainly appears to have been a factor in increasing take-up of sciences and humanities.
I have written before about the high level of correlation between Attainment 8 and the EBacc APS. In 2022, the correlation between Attainment 8 and the EBacc APS was 0.97. They are essentially the same measure.
The EBacc APS could be abandoned entirely and the Progress 8/ Attainment 8 measures redefined to incentivise entry in all EBacc subjects.
There are at least 3 options here:
- Split up the 3 EBacc slots so there is one for science, one for humanities and one for languages
- Add a fourth EBacc slot and reduce the “open” slots to 2. The EBacc slots would be 2 sciences (including computer science), humanities and languages
- Add a fourth EBacc slot (as above) but retain the 3 “open” slots. This would be known as Progress 9.
We have calculated all three versions (which we reference V1, V2 and V3 respectively) for all state-funded mainstream schools in 2022.
The chart below shows how the mean Attainment 8 score under each method (and the existing Attainment 8 method) varies by prior attainment group. These estimates are the benchmarks against which pupils’ actual outcomes are compared, given their level of prior attainment, in Progress 8.
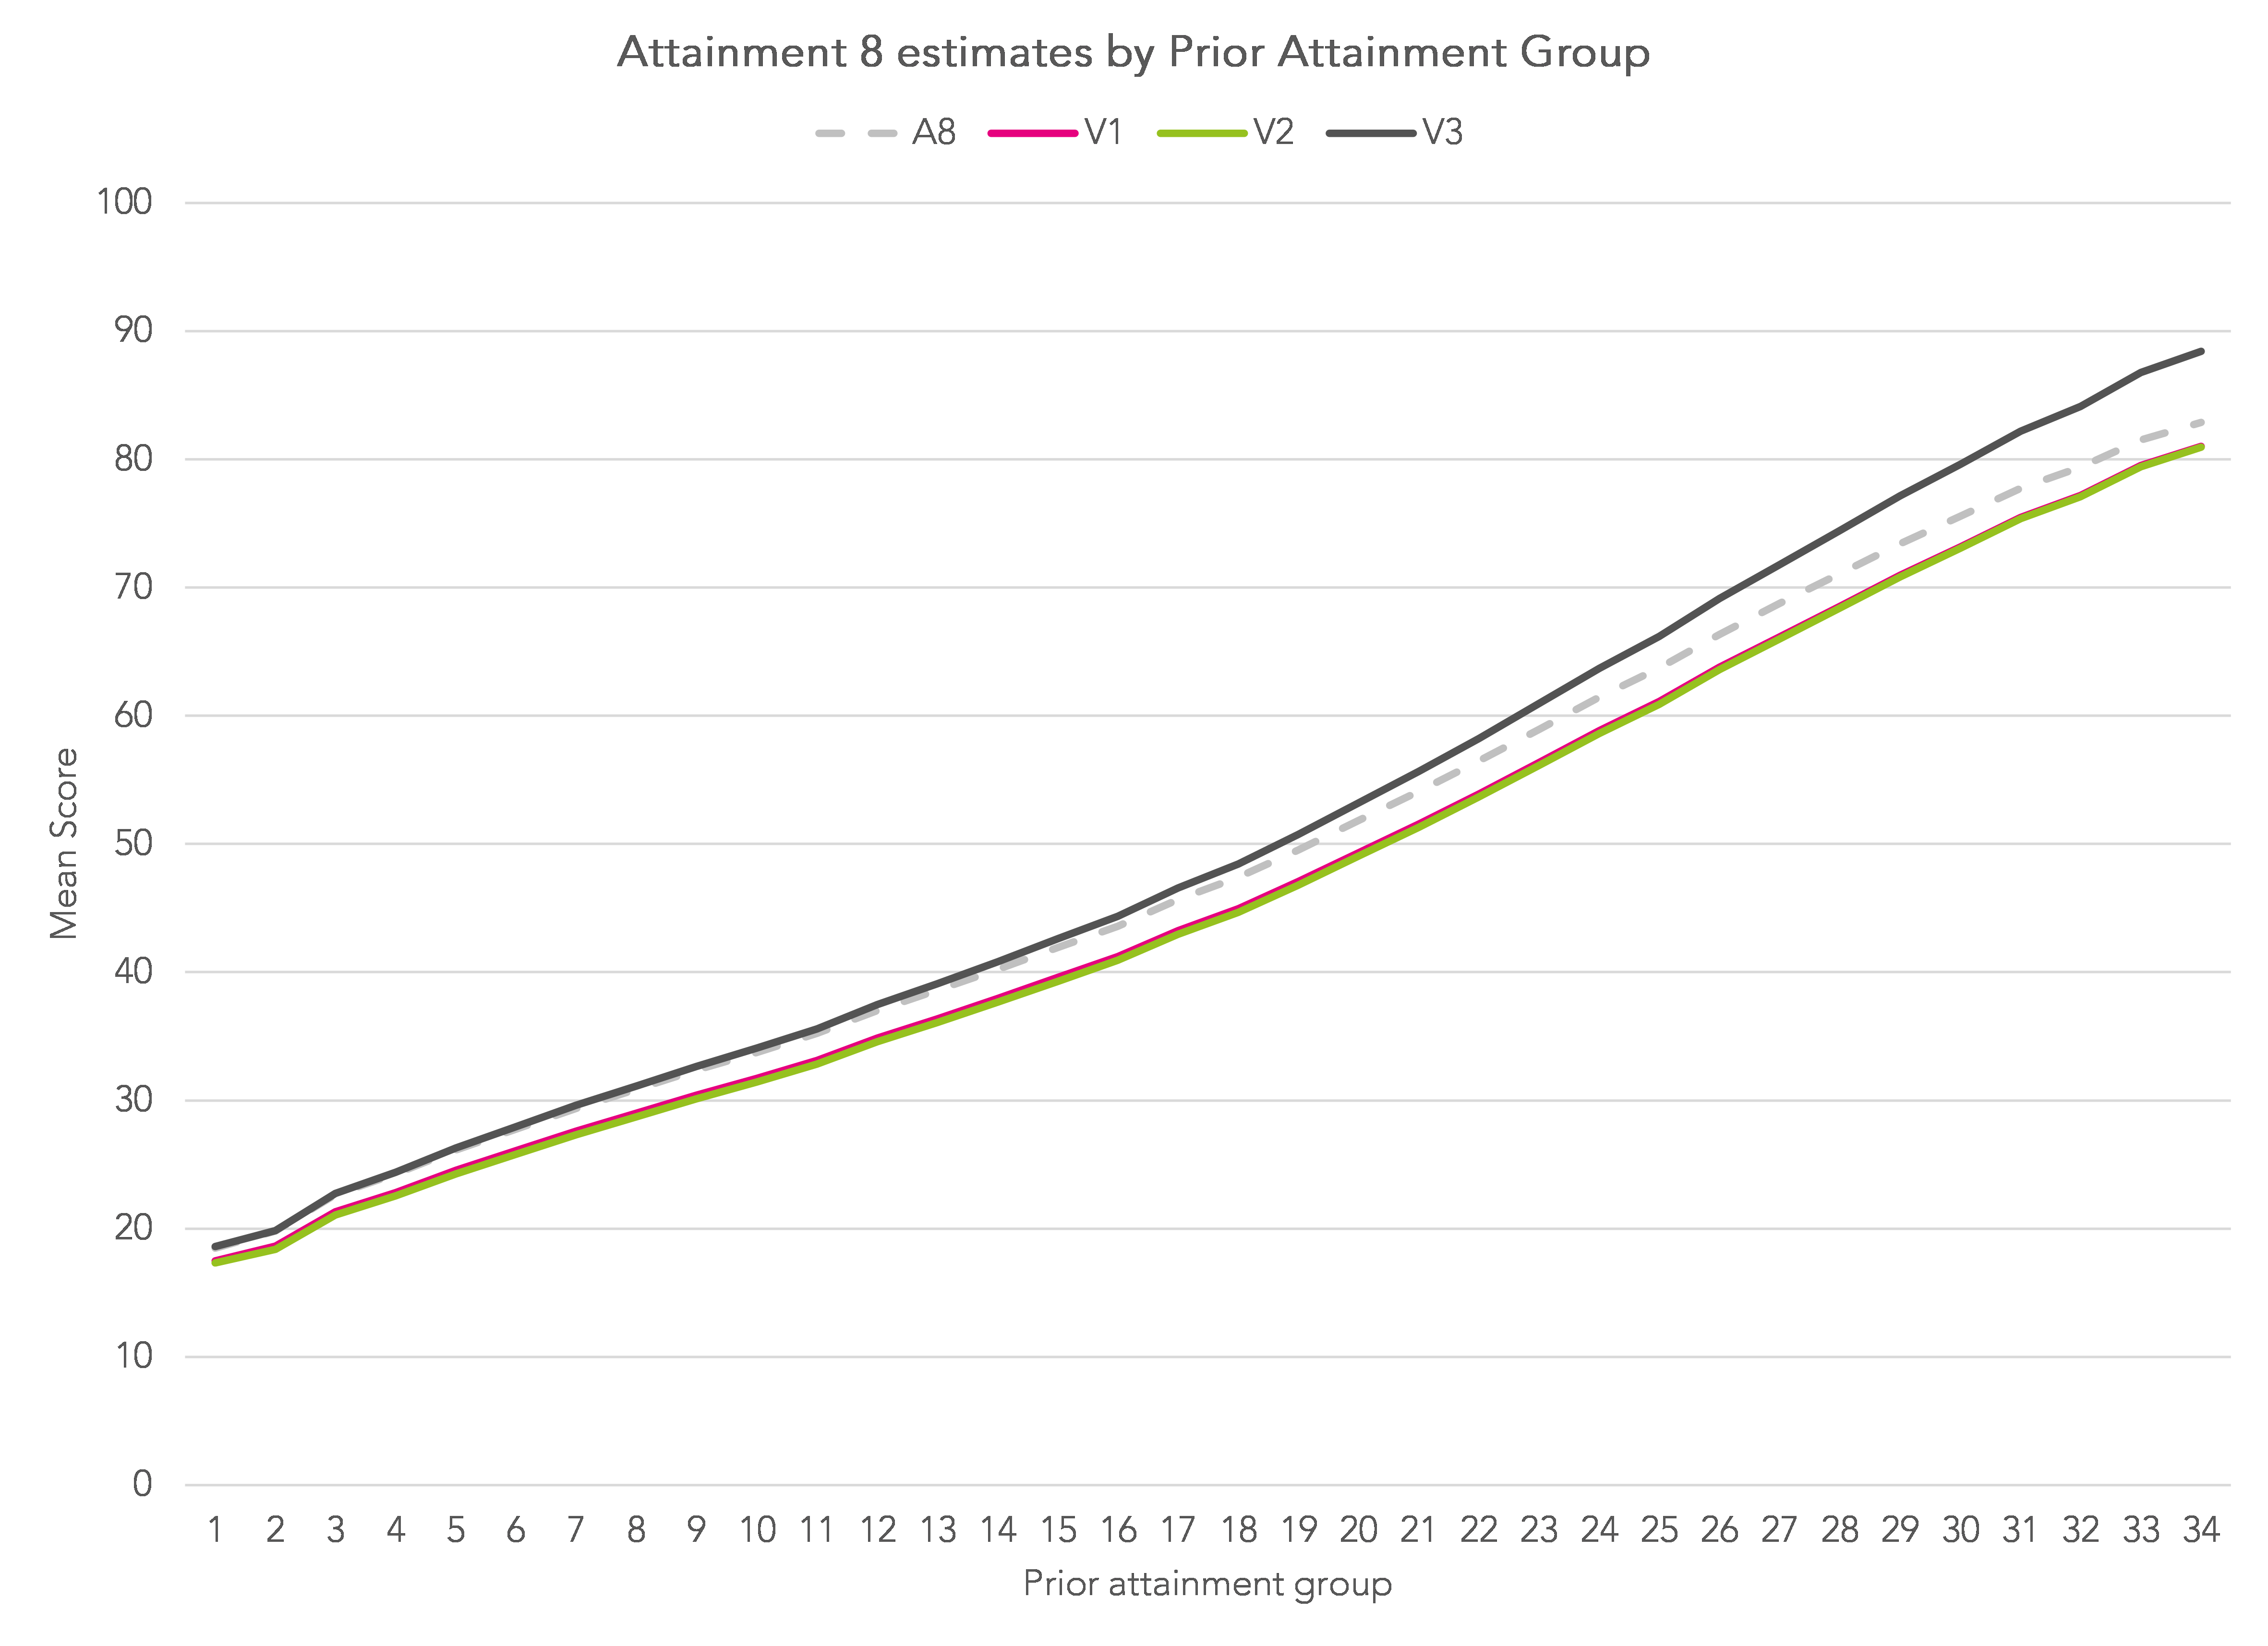
In general, the mean scores under V1 and V2 are very similar. V3 is similar to the current A8 measure for pupils at the lower end of the prior attainment distribution but becomes larger among pupils with higher levels of prior attainment.
We can also see the impact of creating specific slots for each EBacc subject in the chart below. This shows how the mean score varies across the prior attainment distribution under V1 (with one slot per subject).
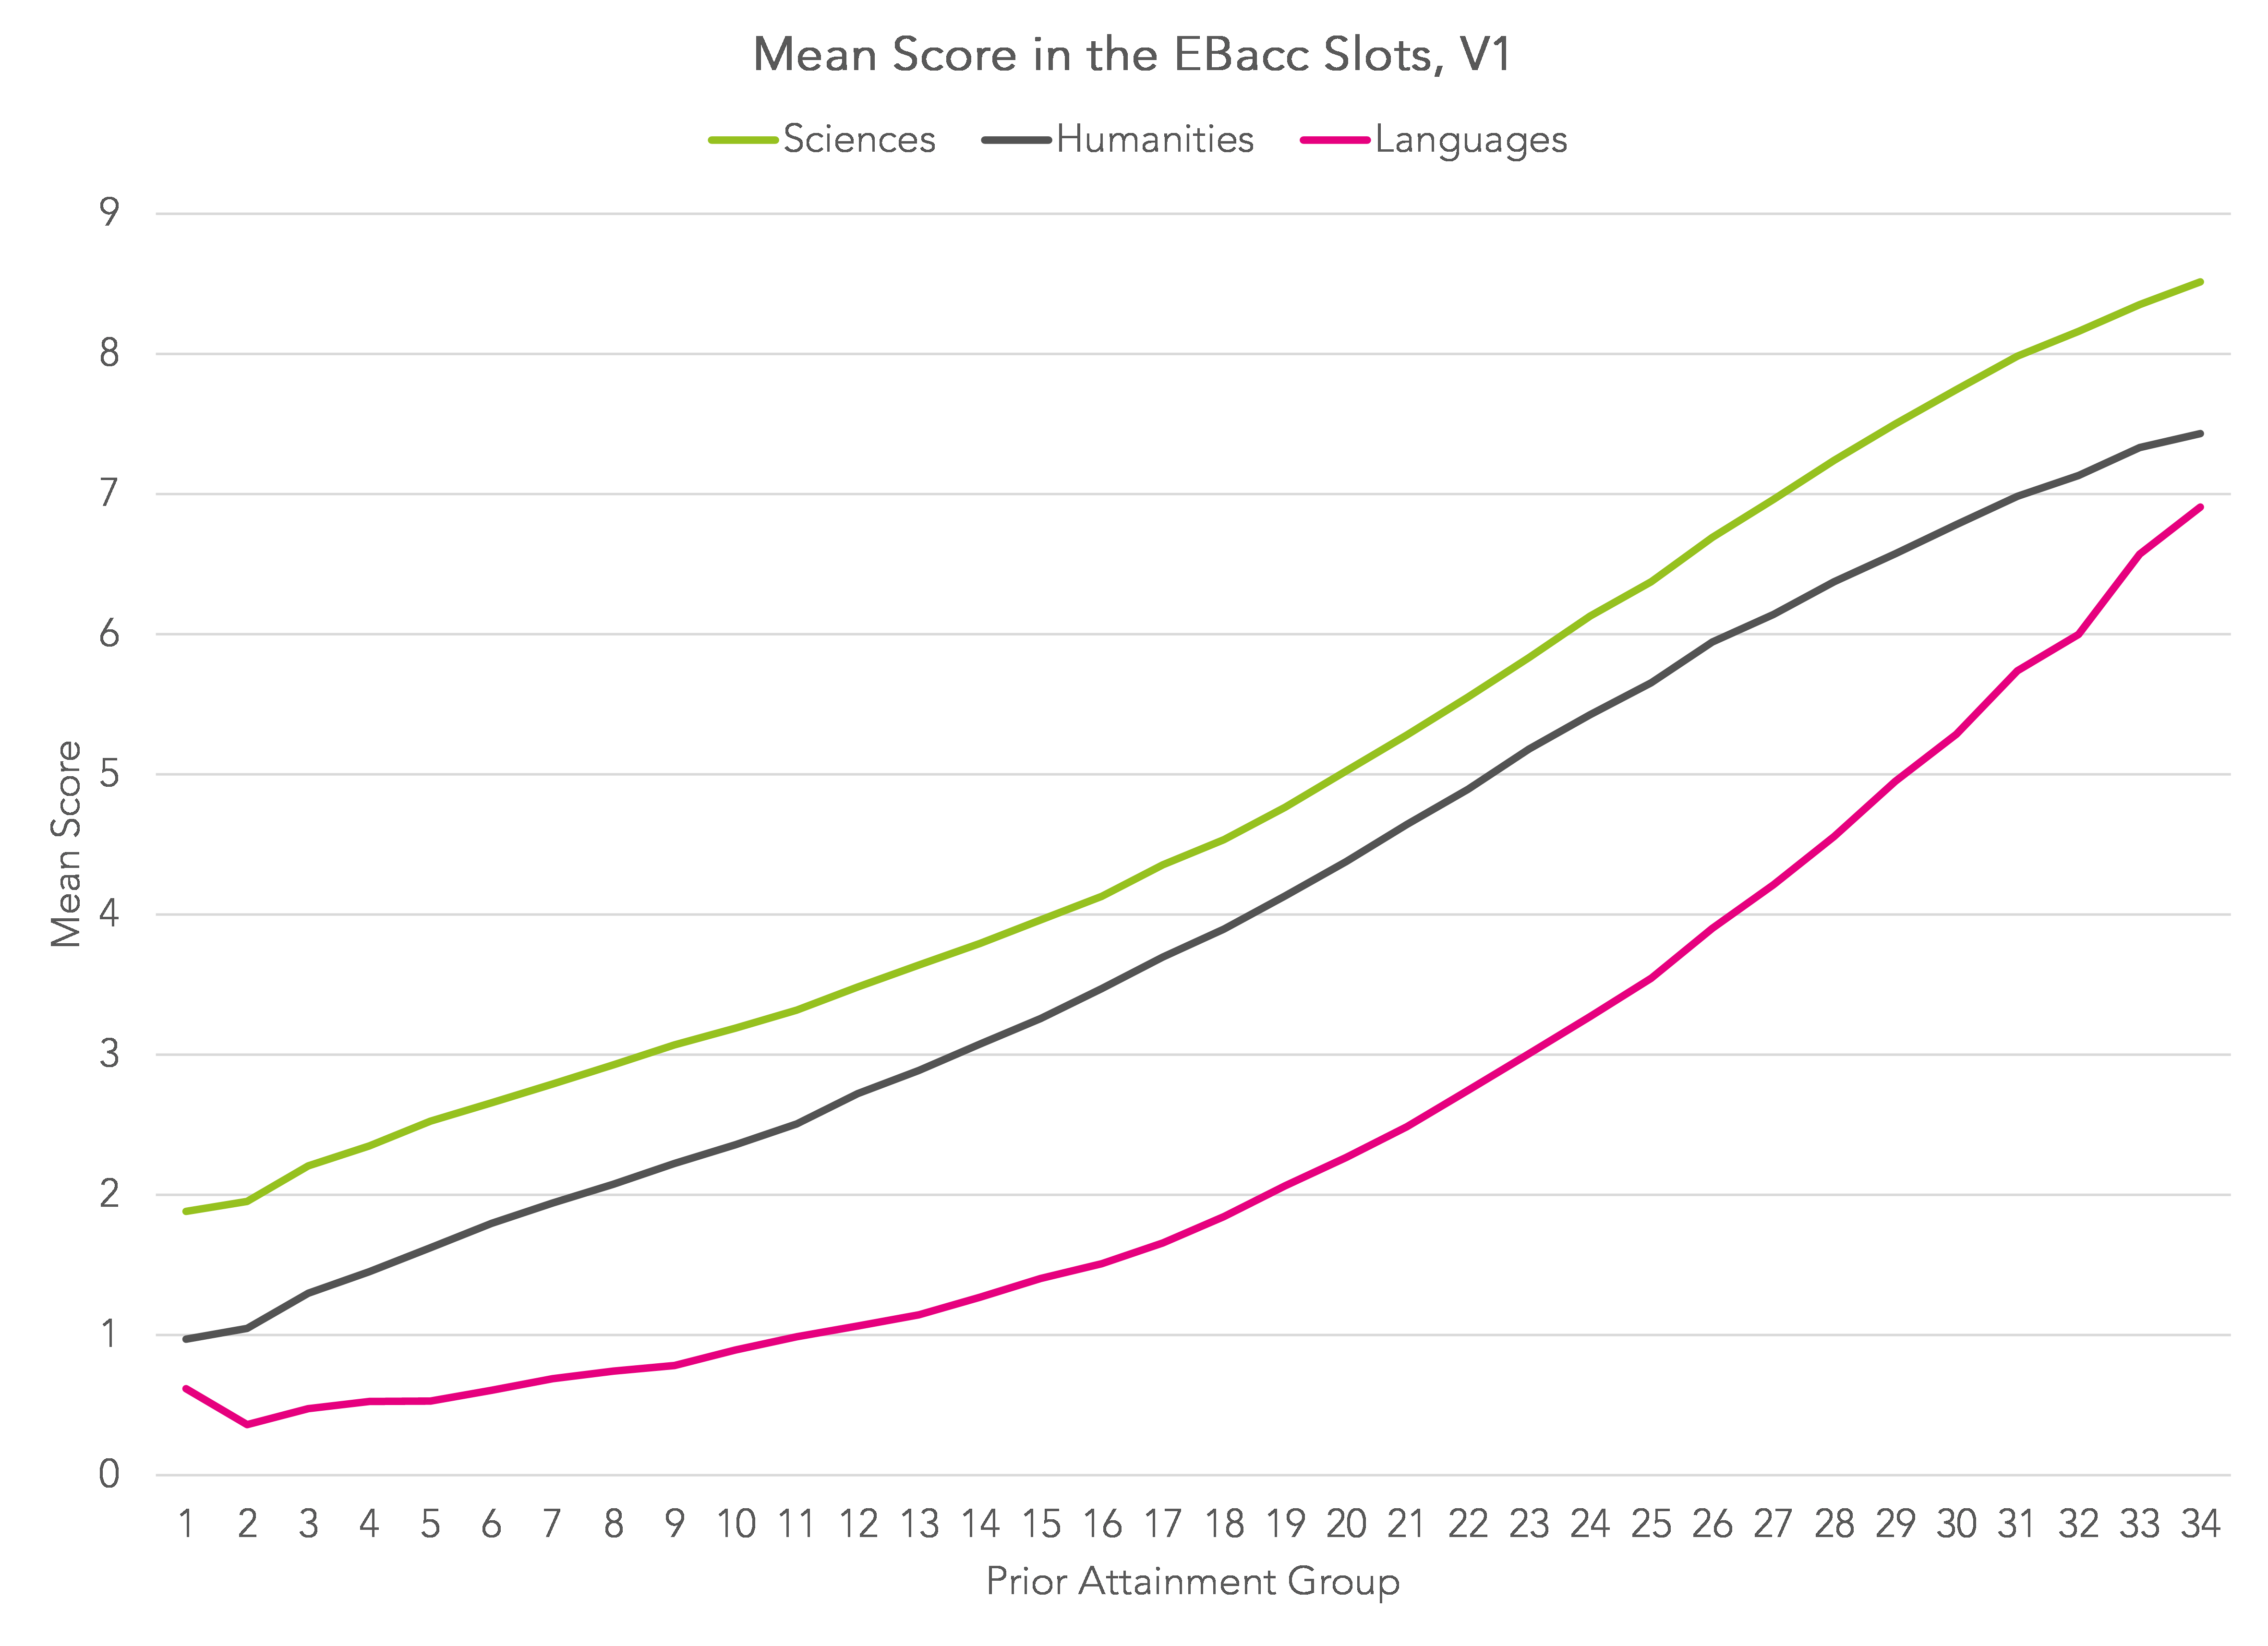
Scores in languages tend to be much lower than other subjects. This is a function of 2 things: 1) a lower entry rate in languages (hence lots of pupils scoring 0) and 2) more severe grading in languages.
In the table below, we show the average score in each version compared to the current P8 measure broken down by the EBacc entry rate of the school attended by each pupil.

As can be seen, those schools with above average EBacc entry rates would tend to see their P8 scores increase if one of V1-V3 were introduced. By contrast, schools with below average entry rates would tend to see their results fall. This would include schools that don’t have EBacc-aligned curricula such as UTCs, studio schools and FE Colleges with 14-16 provision.
The downside of doing this would be that gaps between disadvantaged pupils and their peers would increase since the former are less likely than the latter to enter all 6 subjects of the EBacc.

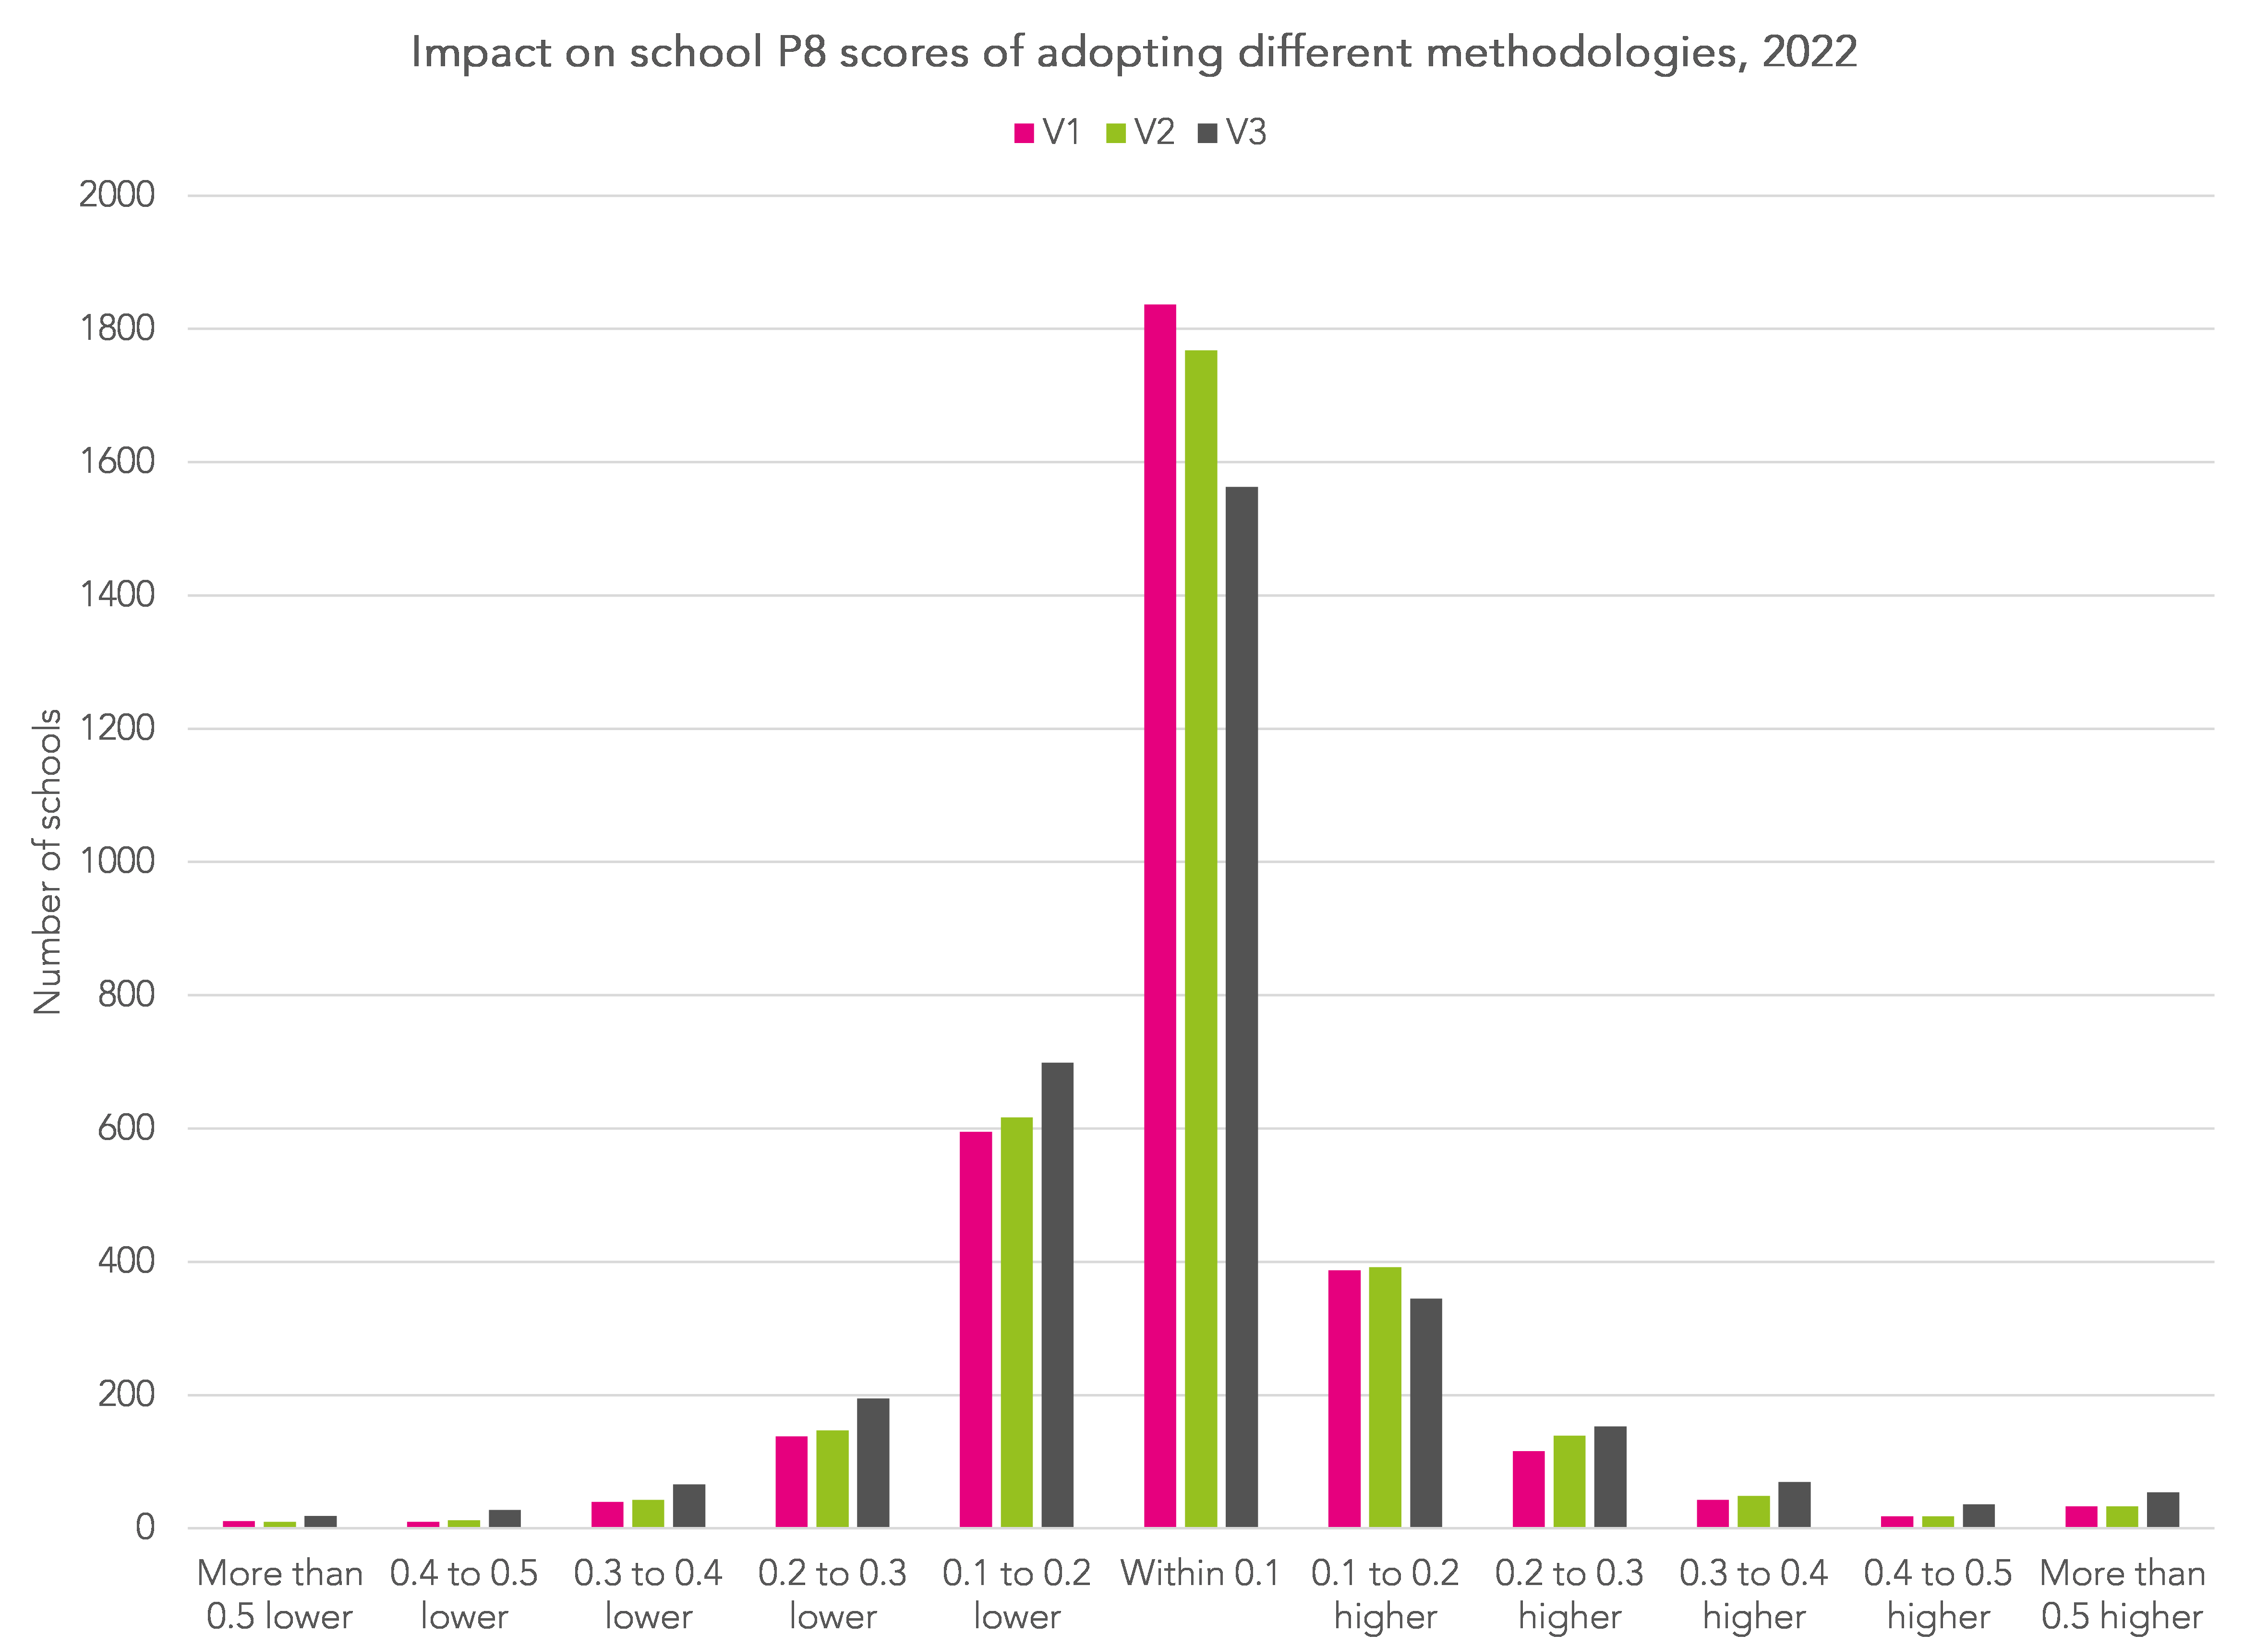
Some school-level changes would be quite large. If V1 were adopted, 33 schools (out of 3228) would see their P8 score increase by 0.5 and 13 would see their score fall by a similar margin. However, many schools’ scores would barely change: over half for V1 and V2 and just under half for V3.
Summing up
The EBacc has been with us as a performance measure since 2010. Since then, the percentage of pupils entering all 5 subjects has barely changed.
Given that entry in the EBacc is already one of the headline measures, and this does not seem to have driven up entry, it is hard to see that changing the EBacc average point score would have much effect.
Arguably, changing Progress 8 would have more effect. We have shown various options for doing this by creating specific “slots” for each EBacc subject.
Ultimately, though, increasing EBacc entries comes down to increasing entries in languages. Unless there is a pool of teachers out there schools can recruit, quite what effect schools can have, even if incentivised to do so by the mechanics of Performance Tables, is unknown.
- If both GCSE English language and GCSE English literature are entered
Want to stay up-to-date with the latest research from FFT Education Datalab? Sign up to Datalab’s mailing list to get notifications about new blogposts, or to receive the team’s half-termly newsletter.


Hi Dave
I have some secondary data I need to analyse for a masters research project on Teacher’s perceptions on parental engagement. Is this something you would be able or willing to help with. I am a great believer in asking. Sorry if this appears a rude or cheeky request.
Hi Bernard. Happy to have a quick look- send us an email educationdatalab@fft.org.uk
The fundamental problem is that EBacc is not an appropriate pathway for all students. We’ve seen a school who increased their entry rate for EBacc but saw no real increase in their APS, because when pupils were pushed onto an academic pathway their average grades dipped – it wasn’t just that they fluffed French instead of smashing Sports Science, they were enjoying school less and not achieving as well in English, maths and science.
So on the one hand, yes I want to see schools improve their take up of languages GCSE (and that’s a real issue for us), but on the other hand I don’t want that to be at the expense of doing what is right for that school’s cohort.
Wouldn’t increasing the prominence of the ‘% entered for triple science’ also potentially impact on entry patterns and the alternative progress 8 modelling? Triple science may not be right for many students but by adding it as a headline measure won’t schools feel pressured to change their entry patterns (and hence knock on which subjects feed in to EBacc or open buckets of progress 8 / 9…. As has been flagged, these changes to accountability need to be matched with changes to funding to support recruitment of appropriate staffing….
Maybe. But EBacc entry has been a headline measure for some time and many schools haven’t changed their entry patterns much. P8 seems (to me at least) the only one that really drives behaviour.
I could be wrong but was part of Michael’s point that with the DfE increasing the prominence of the triple science entry, it could be at logger heads with increasing full EBacc take up. Many schools offer triple science as an extra optional subject, so therefore one less place for students to choose the other subjects needed for full EBacc take up?
Thanks Rich, yes that’s a good point. Of course, if a pupil entered triple science, plus a humanity and a language (to meet the EBacc criteria) then they could potentially take up 5 of the 6 P8 slots for EBacc and “other” subjects. So potentially increasing triple science may come at a cost to non-EBacc subjects.
Did examinations taken in 2022 count for the performance tables in 2023? Many school sit Eng Lit early in Y10 ( in this case 2022) and then all other GCSE subjects in 2023. I guess this would make a difference to schools P8 as the 2022 outcomes were based on more generous grading.
Hi Tim. Yes they did. There weren’t many of them (relative to exams taken in 2023) and Y10 grades tend to be slightly lower than Y11 grades (IIRC) but yes, they might have had a small difference.
Dear Dave Thomson,
What would be the impact of fewer students taking languages at GCSE on progress 8 as a measure? In your experience does it matter if schools compel students to take languages at GCSE or not on their overall P8 score?
Good question. I was pretty sure I’d looked at this before (as best I can with the data available as its hard to infer which schools compelled students) but it must have been something I started and not finished. Leave that with me.