Amanda Spielman’s reign as His Majesty’s Chief Inspector of Schools comes to an end this month.
The last couple of months have been particularly turbulent with criticism of Ofsted as a whole and her personally following the inquest into the death of Ruth Perry. Several organisations have called for reform of Ofsted (such as IPPR) and concerns about the consistency and reliability of grading are not going away.
In this article we are going to look back at the full seven years of her tenure to examine how schools’ inspection outcomes have changed since she took up position in January 2017.
During this time, a new inspection framework was introduced (from September 2019) that can probably be summed up in one word: curriculum.
Data
We use data on schools’ most recent inspections as at 31st December 2016 and 30th November 2023 from Ofsted management information.
Back in 2017, when schools had replaced a closed school (e.g. when a school became a sponsored academy), the inspection outcome of the previous school was not linked to the new school in Ofsted data. Instead, it would have appeared to have no inspection outcome at all (just as if it were a brand new school).
Ofsted then changed their reporting in March 2018 to include the inspection outcome of the predecessor school. We update the 2017 data to add inspection outcomes for predecessor schools.
Between 2017 and 2023 some schools merged (2 or more schools became 1 school) or re-organised in some other fashion. In these cases, we treat the current school as a new school (i.e. we don’t try to establish a 2017 outcome for them).
We base most of our analysis on full inspections. In other words, we disregard short, ungraded inspections.
All schools
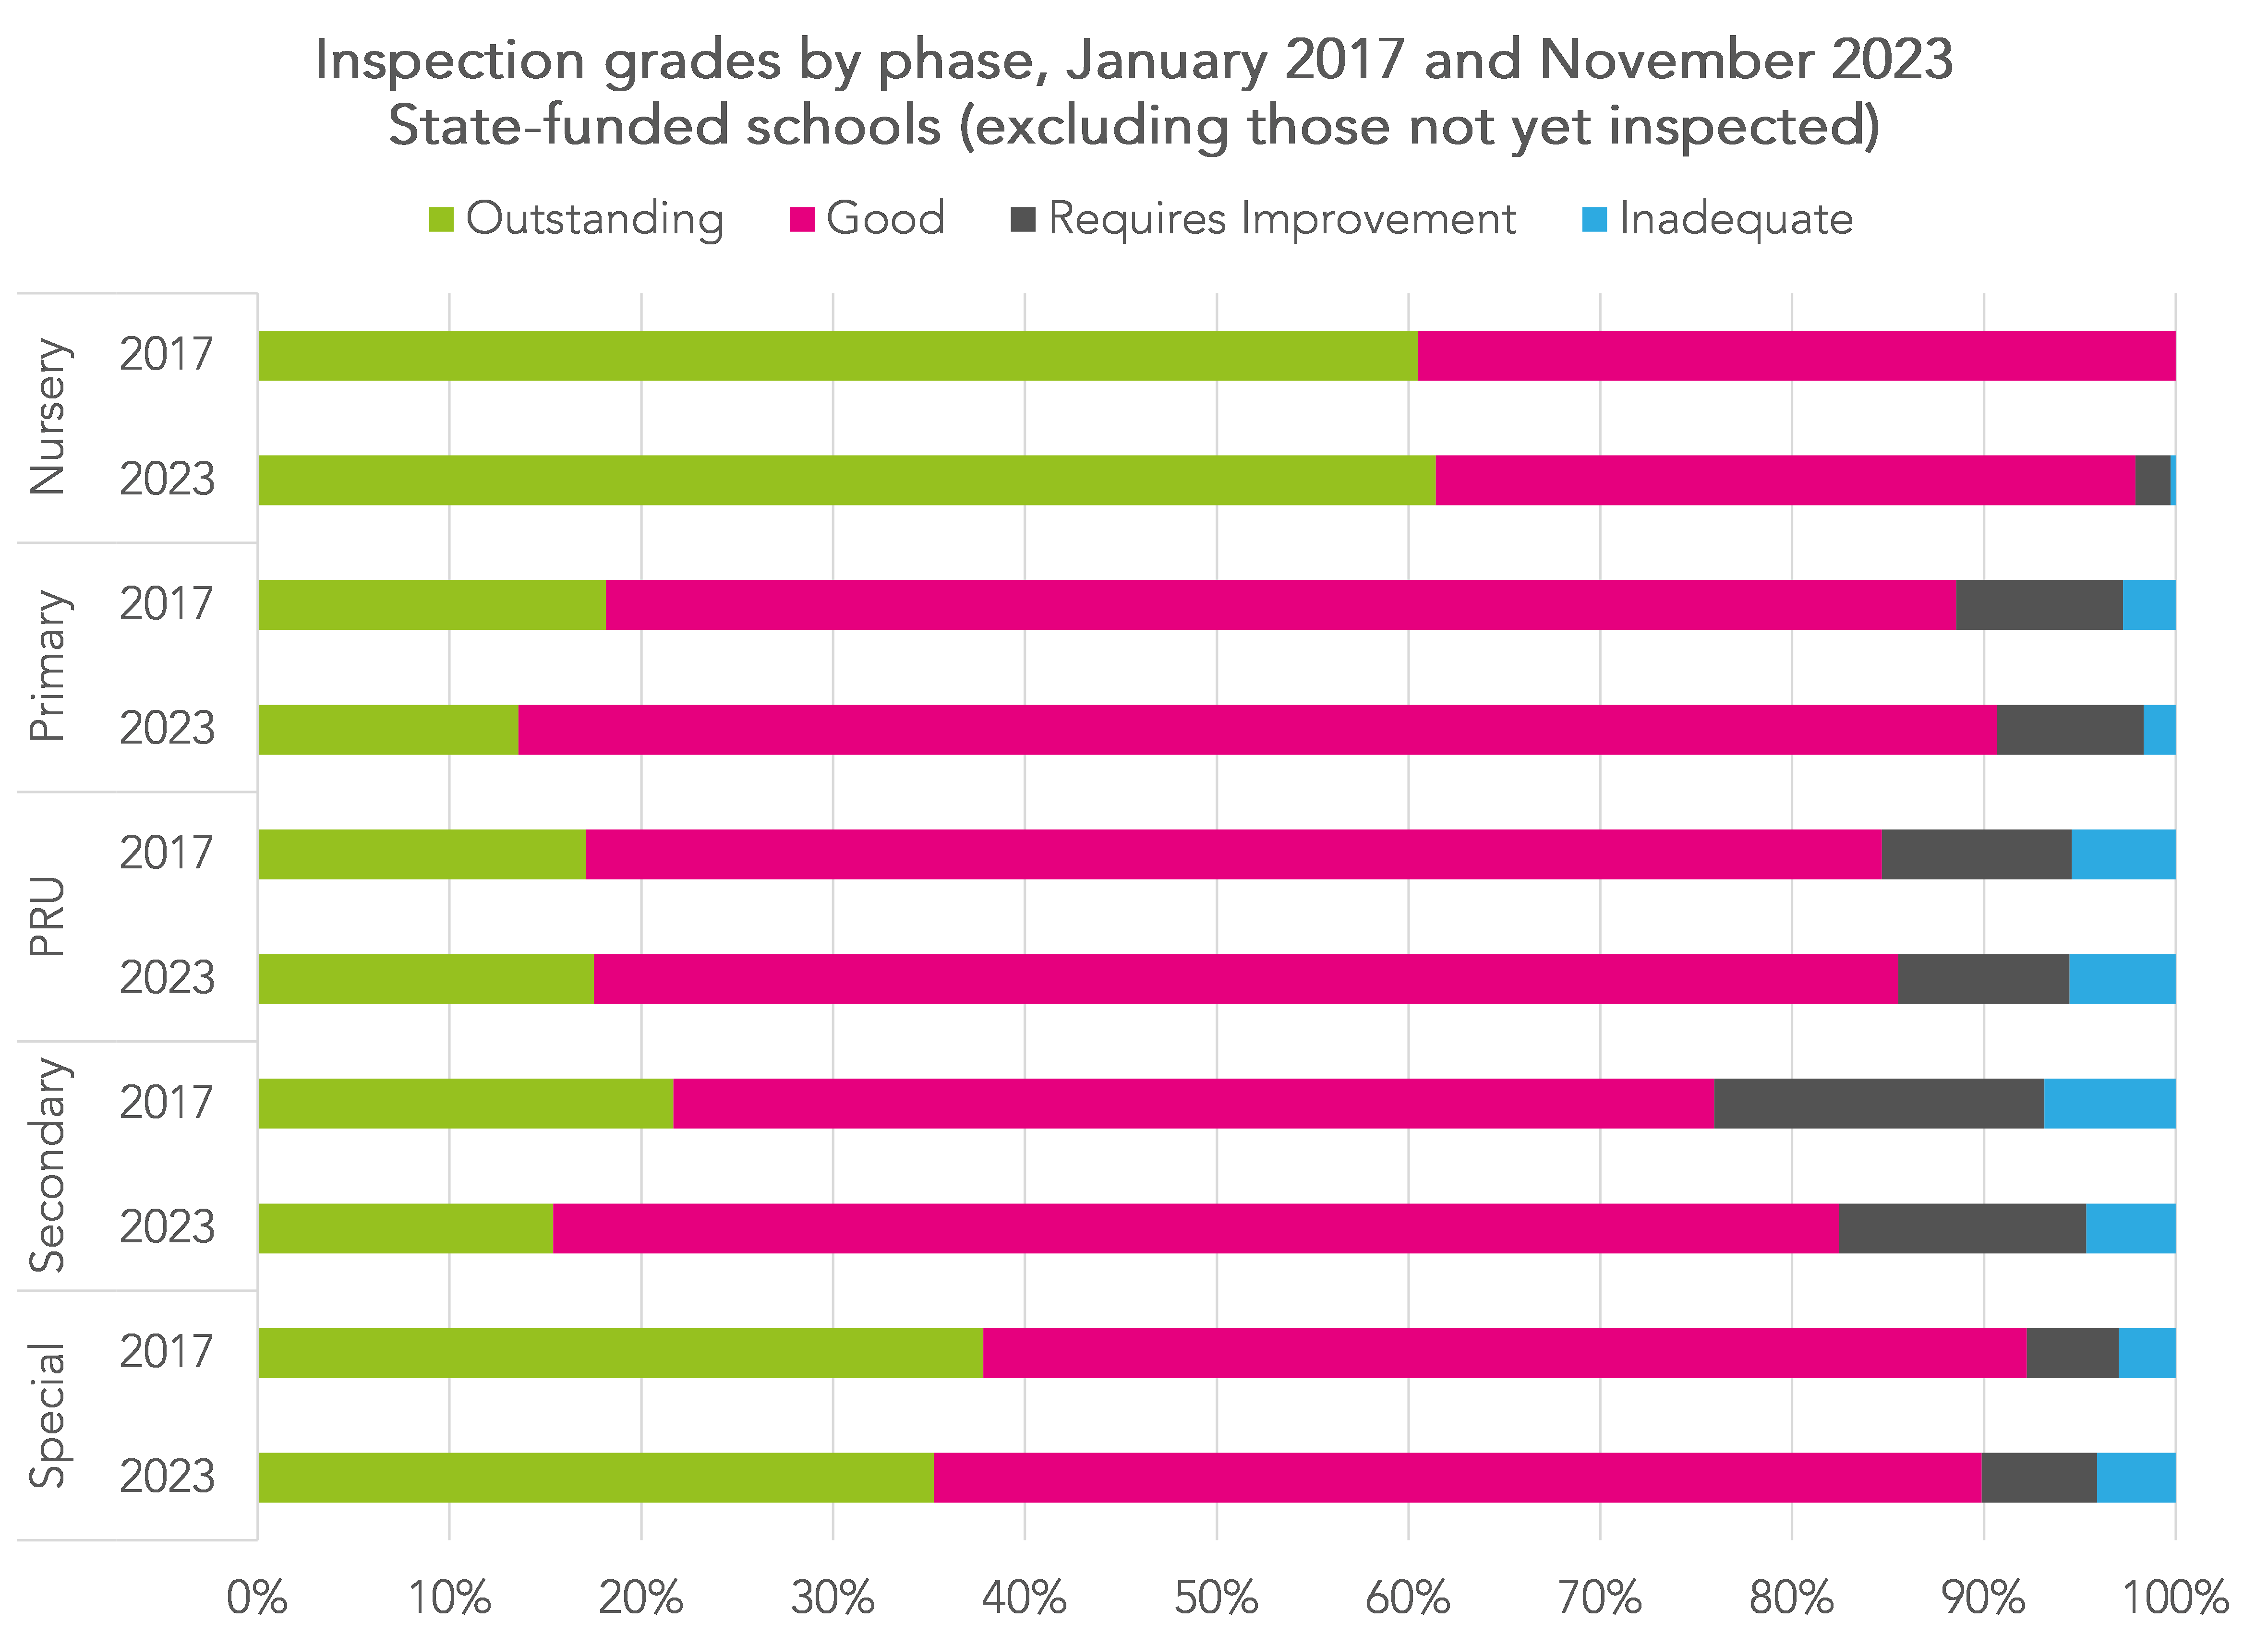
Firstly, we can look at the current inspection outcomes of all schools in England and compare this to the position in January 2017.

There are fewer outstanding schools, chiefly as a result of the re-introduction of routine inspection for previously outstanding schools, but also fewer schools graded inadequate or requires improvement.
Breaking this down by phase, we see an increase in the proportion of primary schools and (especially) secondary schools graded good or better, and a slight fall (from a higher base) among special schools.
How many schools were inspected?
54% of currently open schools have had a full inspection since January 2017. This figure is likely to have been higher if the COVID-19 pandemic had not taken place.
Another 37% had at least one ungraded inspection.

Over two-thirds (69%) of secondary schools have had a full inspection since 2017. Rates among special and nursery schools were much lower- although a much lower proportion of these tend to have been judged inadequate or requires improvement.
Secondary schools that have not had a full inspection since 2017 tend to have achieved higher Progress 8 measures in 2023. This is much more likely to be the result of Ofsted’s risk-based approach to identifying schools for inspection rather than the result of not being inspected.

Changes in grade
Now let’s look at changes in grade among those schools that have had a full inspection since January 2017.
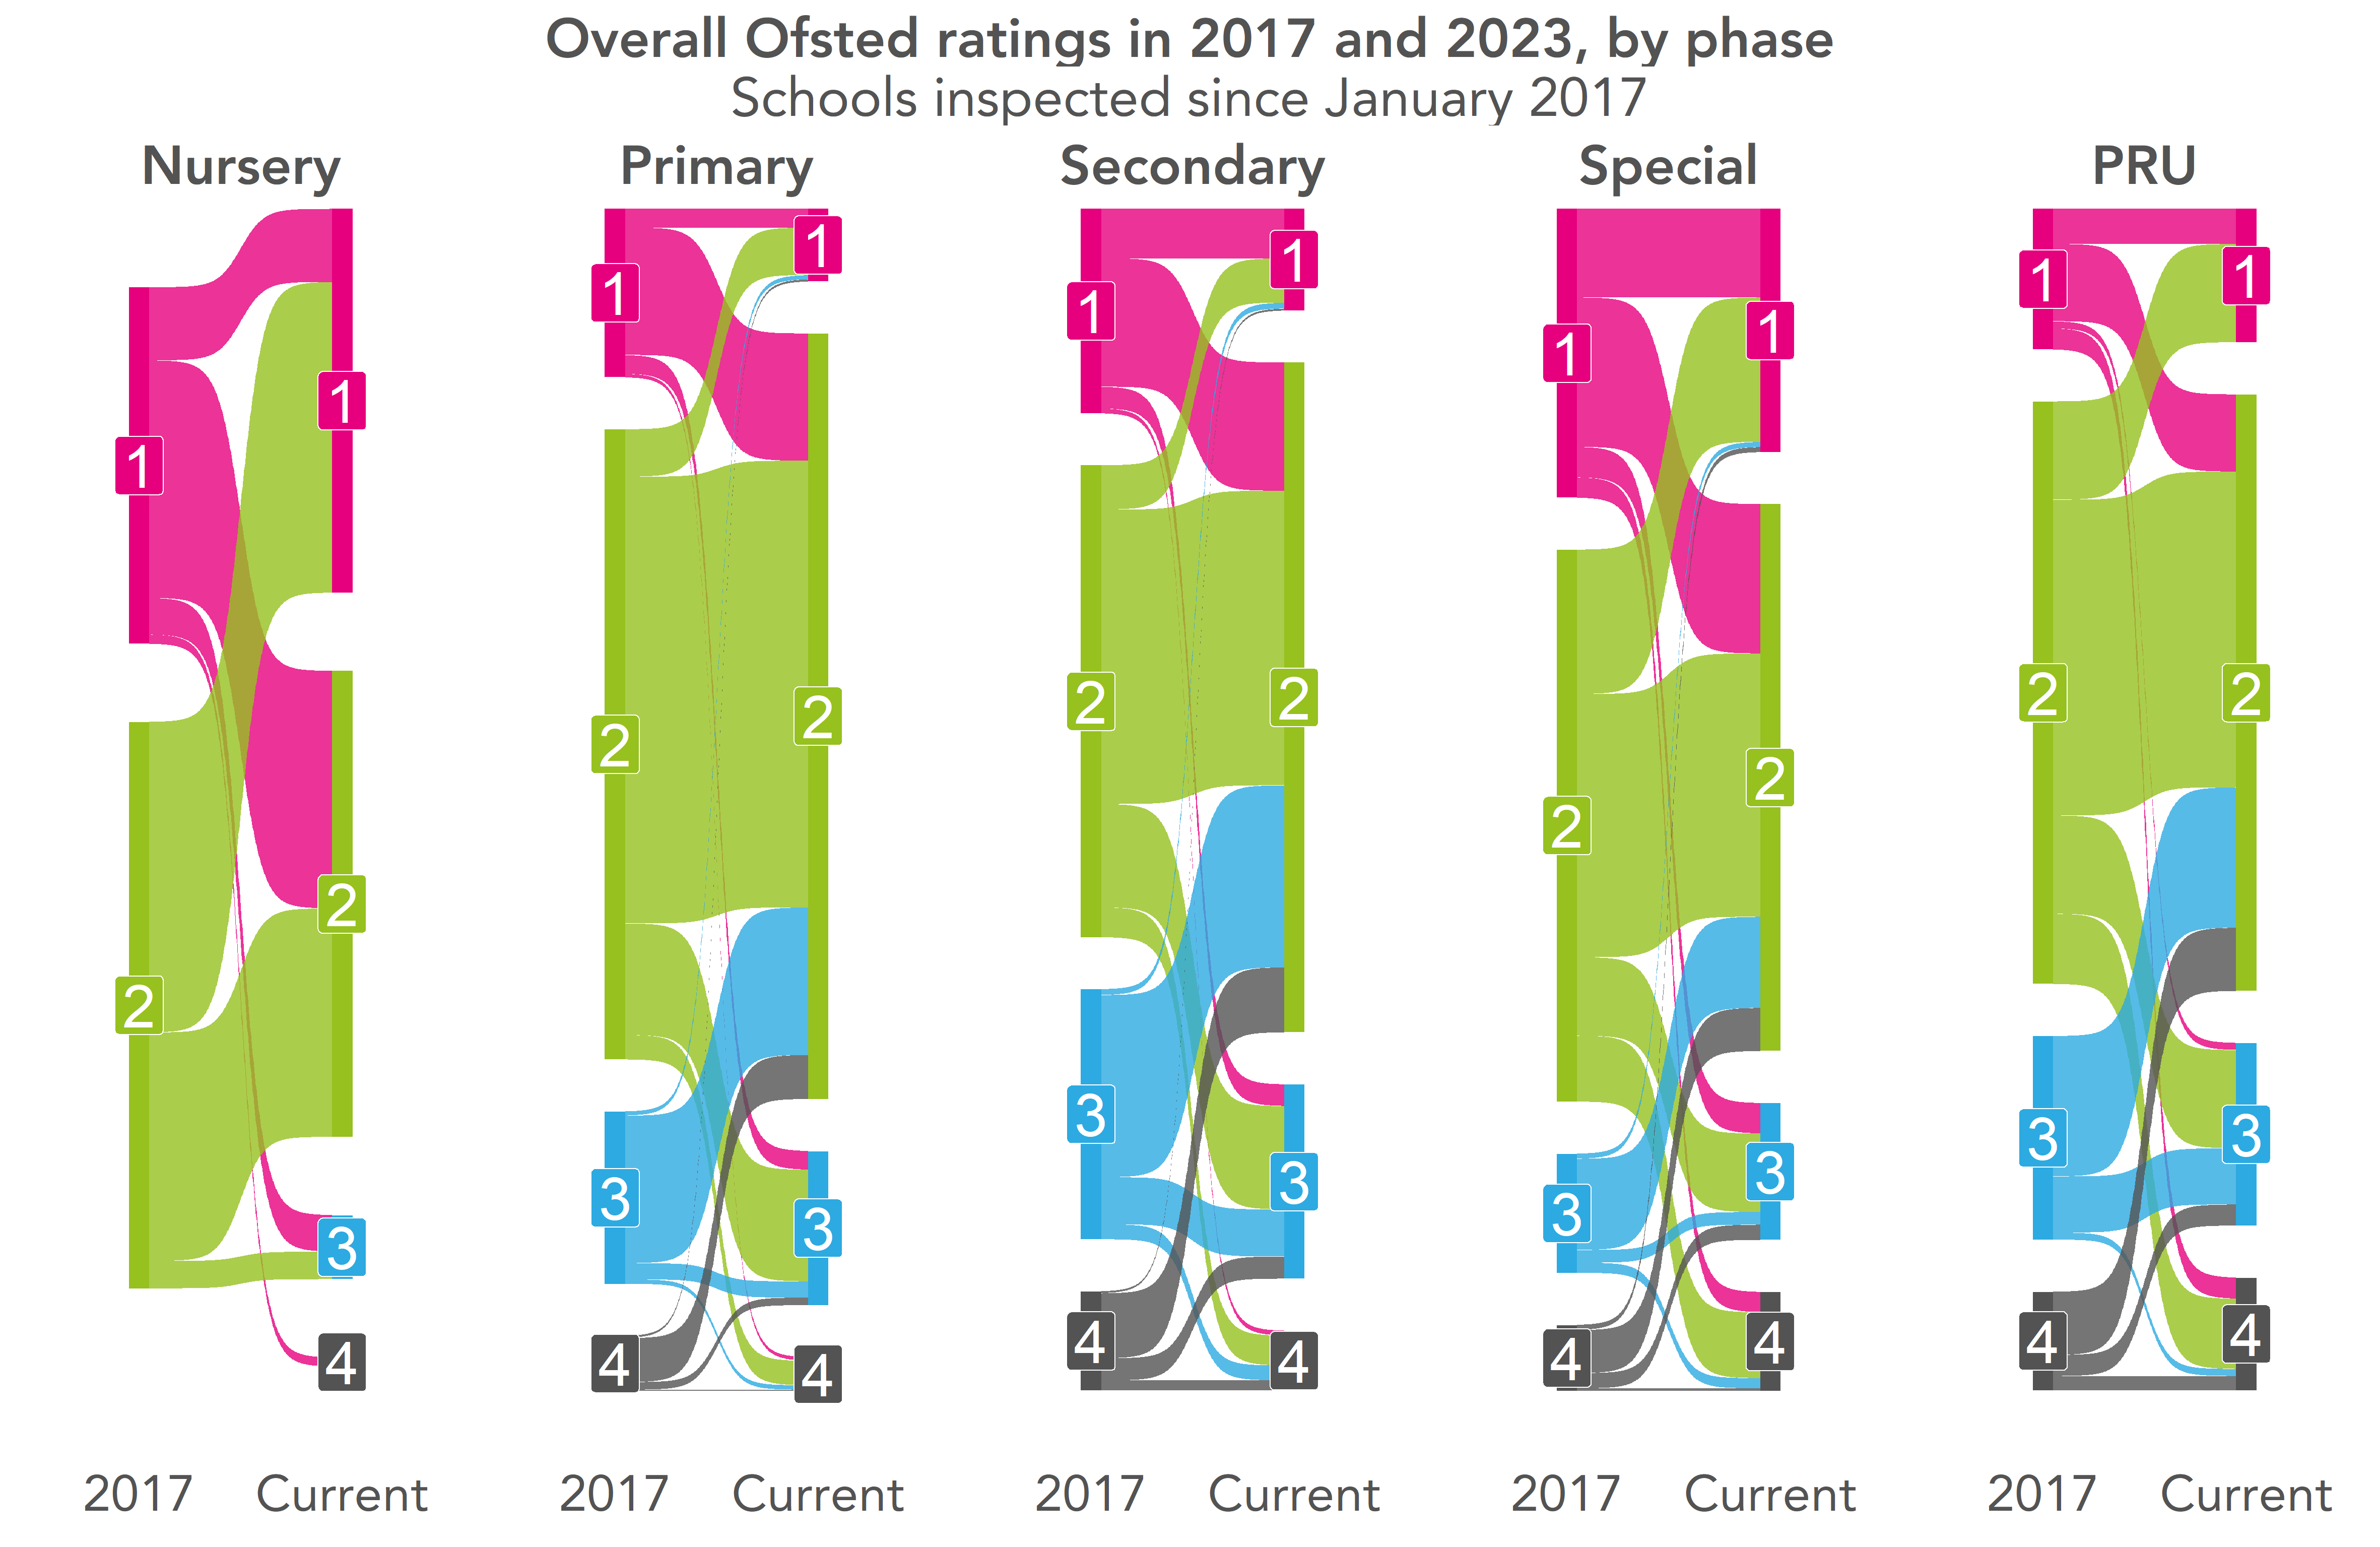
Two features stand out.
Firstly, the reduction in the number of schools graded outstanding (1), largely as a result of outstanding schools only being reinspected due to triggering a risk assessment. This policy was discontinued in 2020 and outstanding schools were once again subject to routine inspection.
Secondly, more schools are now graded good (2).
Relatively few schools that were graded RI (3) or inadequate (4) in 2017 remain so today. Among schools inspected since 2017, just 3% of primary, 4% of special schools and 9% of secondary schools were graded less than good in both 2017 and 2023.
Based on all schools open in 2017 and 2023, those figures become 1%, 2% and 6% respectively.
For primary and secondary schools, let’s now look at how grades changed with respect to school-level deprivation. We base this on the percentage of pupils eligible for free school meals in 2017 divided into five evenly size groups (quintiles). We recognise that schools may have been in a different quintile had we used 2023 data.
Changes in inspection outcomes for each quintile are plotted in increasing order of deprivation from left to right.
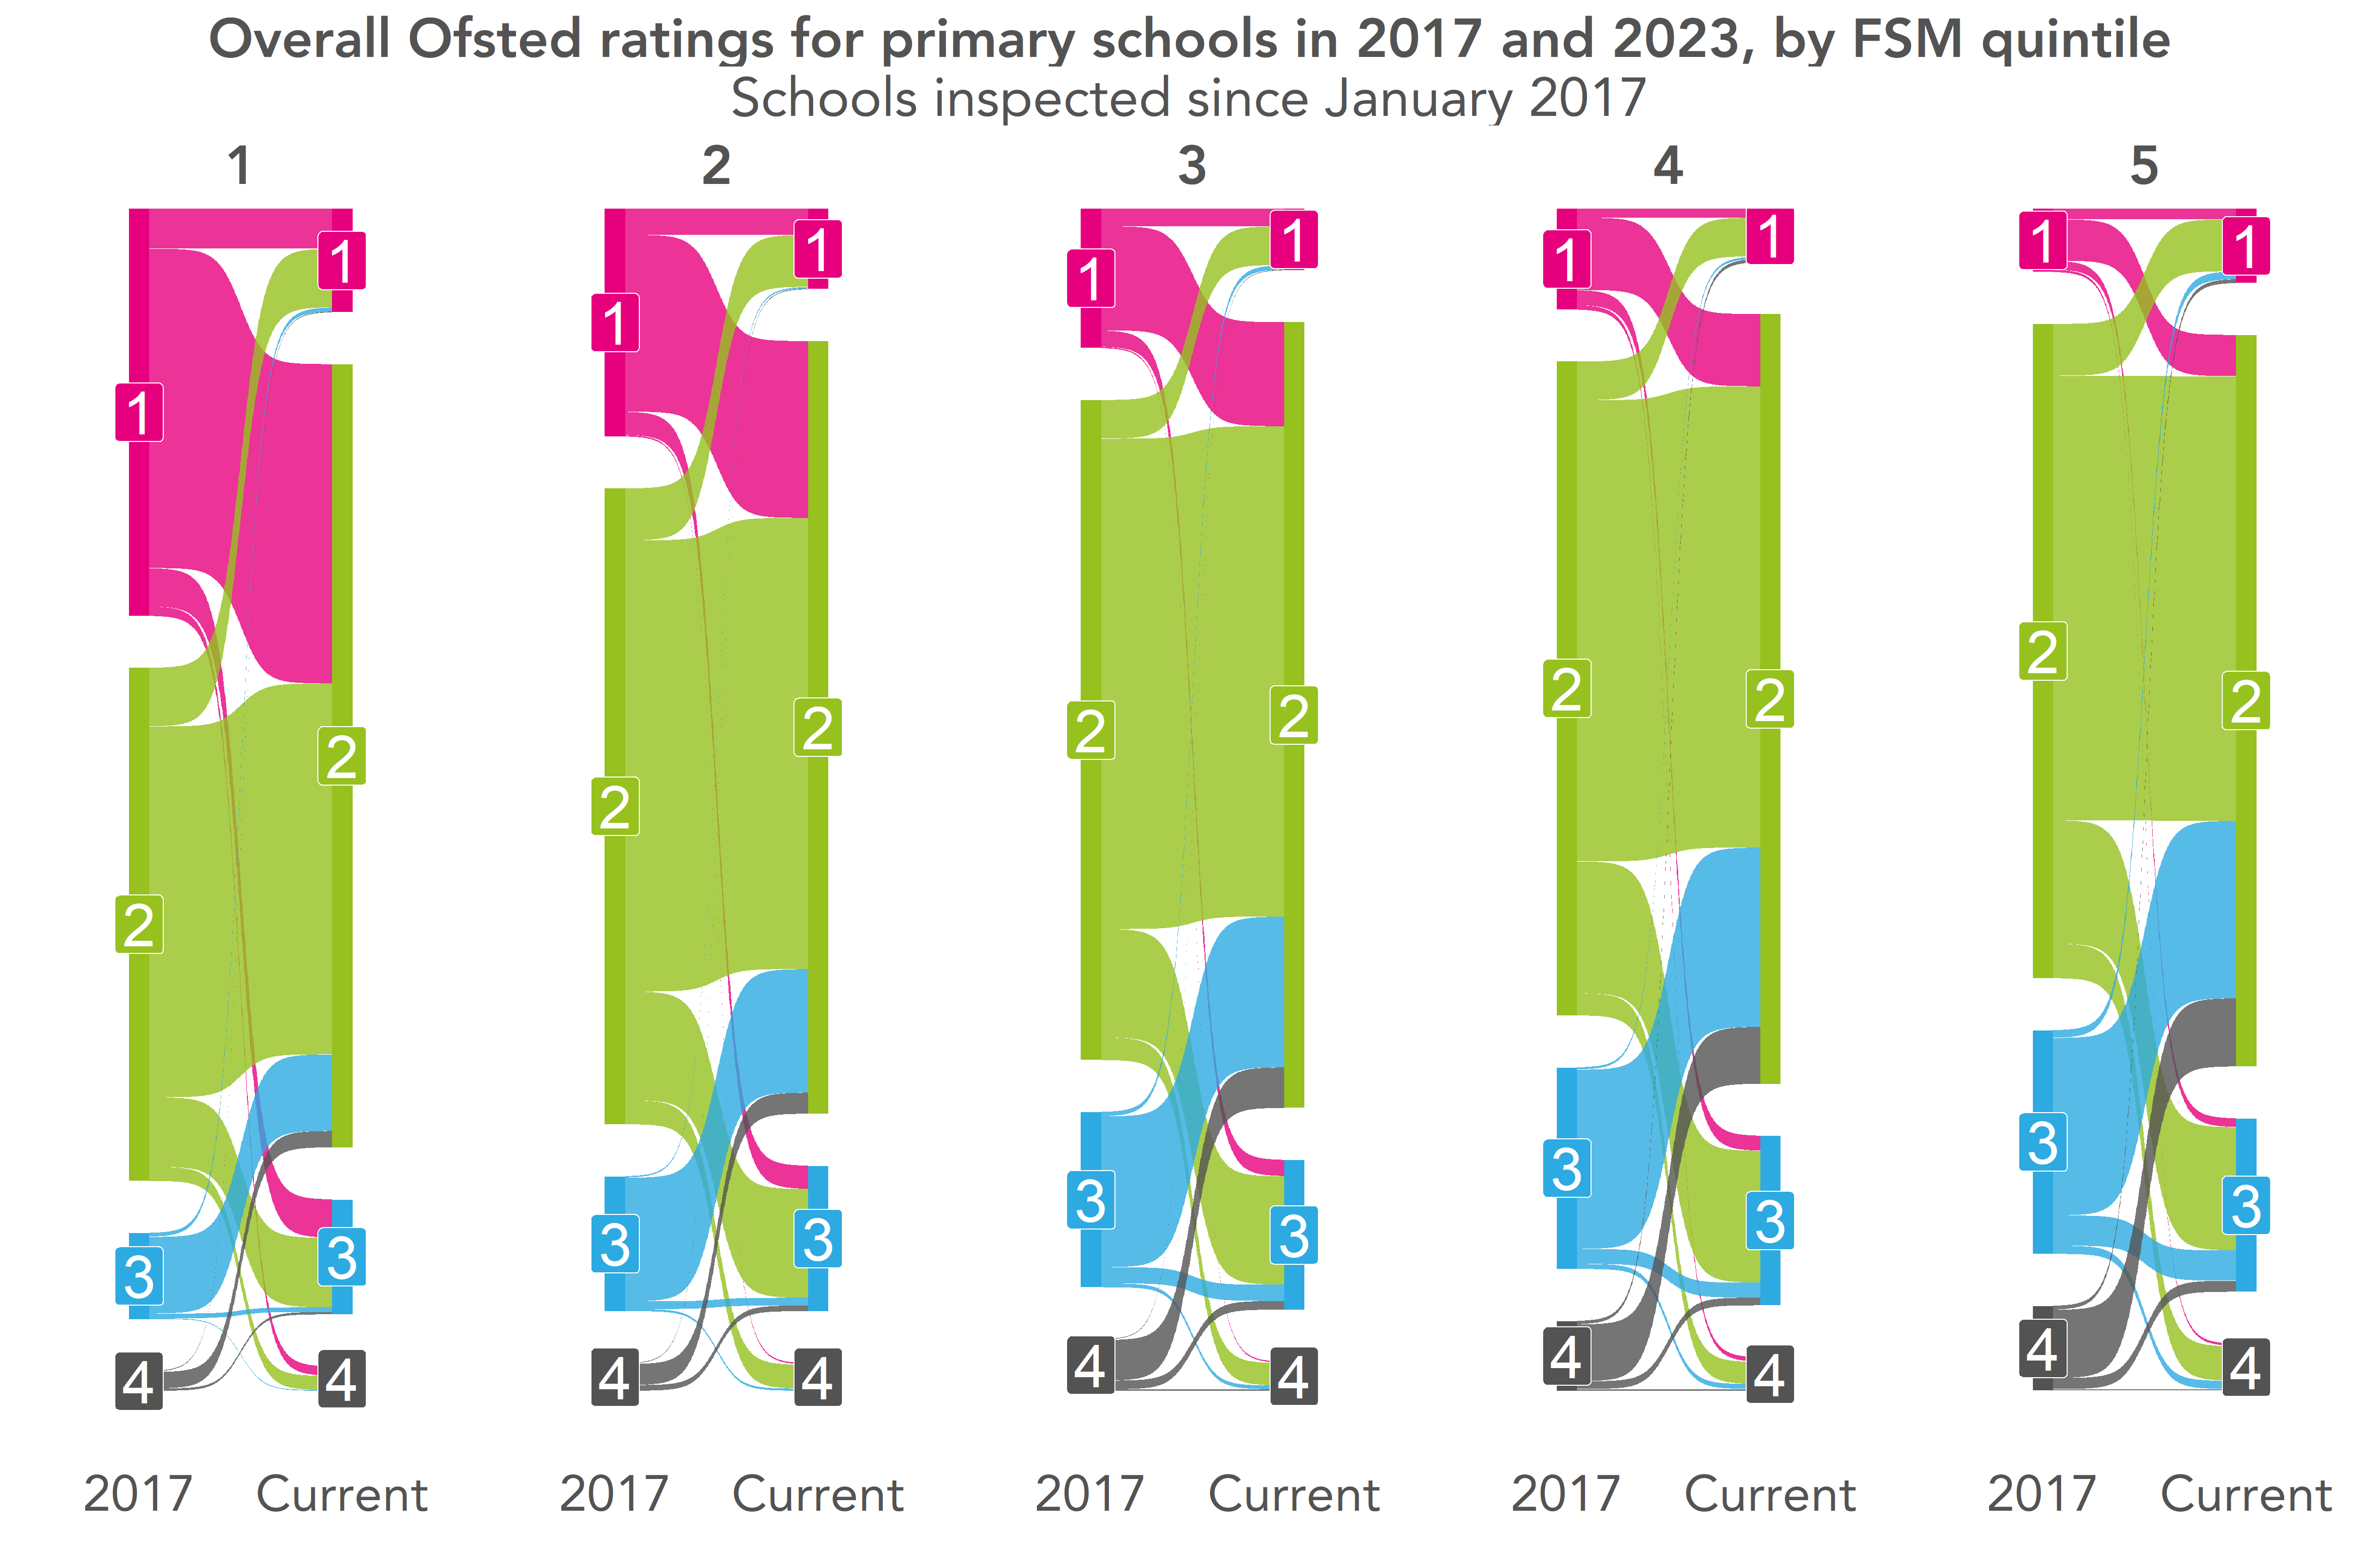

In the lowest two quintiles, we see actually see a reduction in the number of schools graded good or outstanding in both the primary and secondary sectors.
Schools in the top 3 quintiles tended to have improved on re-inspection although they are still less likely to be judged good or outstanding than less deprived schools.
Does this show improved grades for more disadvantaged schools? On the surface yes, but it’s hard to tell from this analysis given that the likelihood of having had a full inspection since January 2017 varies across the quintiles.
The most deprived schools were more likely to have had a full inspection since January 2017 than the least deprived schools.

Moreover, many of the least deprived schools had previously been judged outstanding and some will have been re-inspected having triggered a risk assessment. In other words, they were at greater risk of being downgraded.
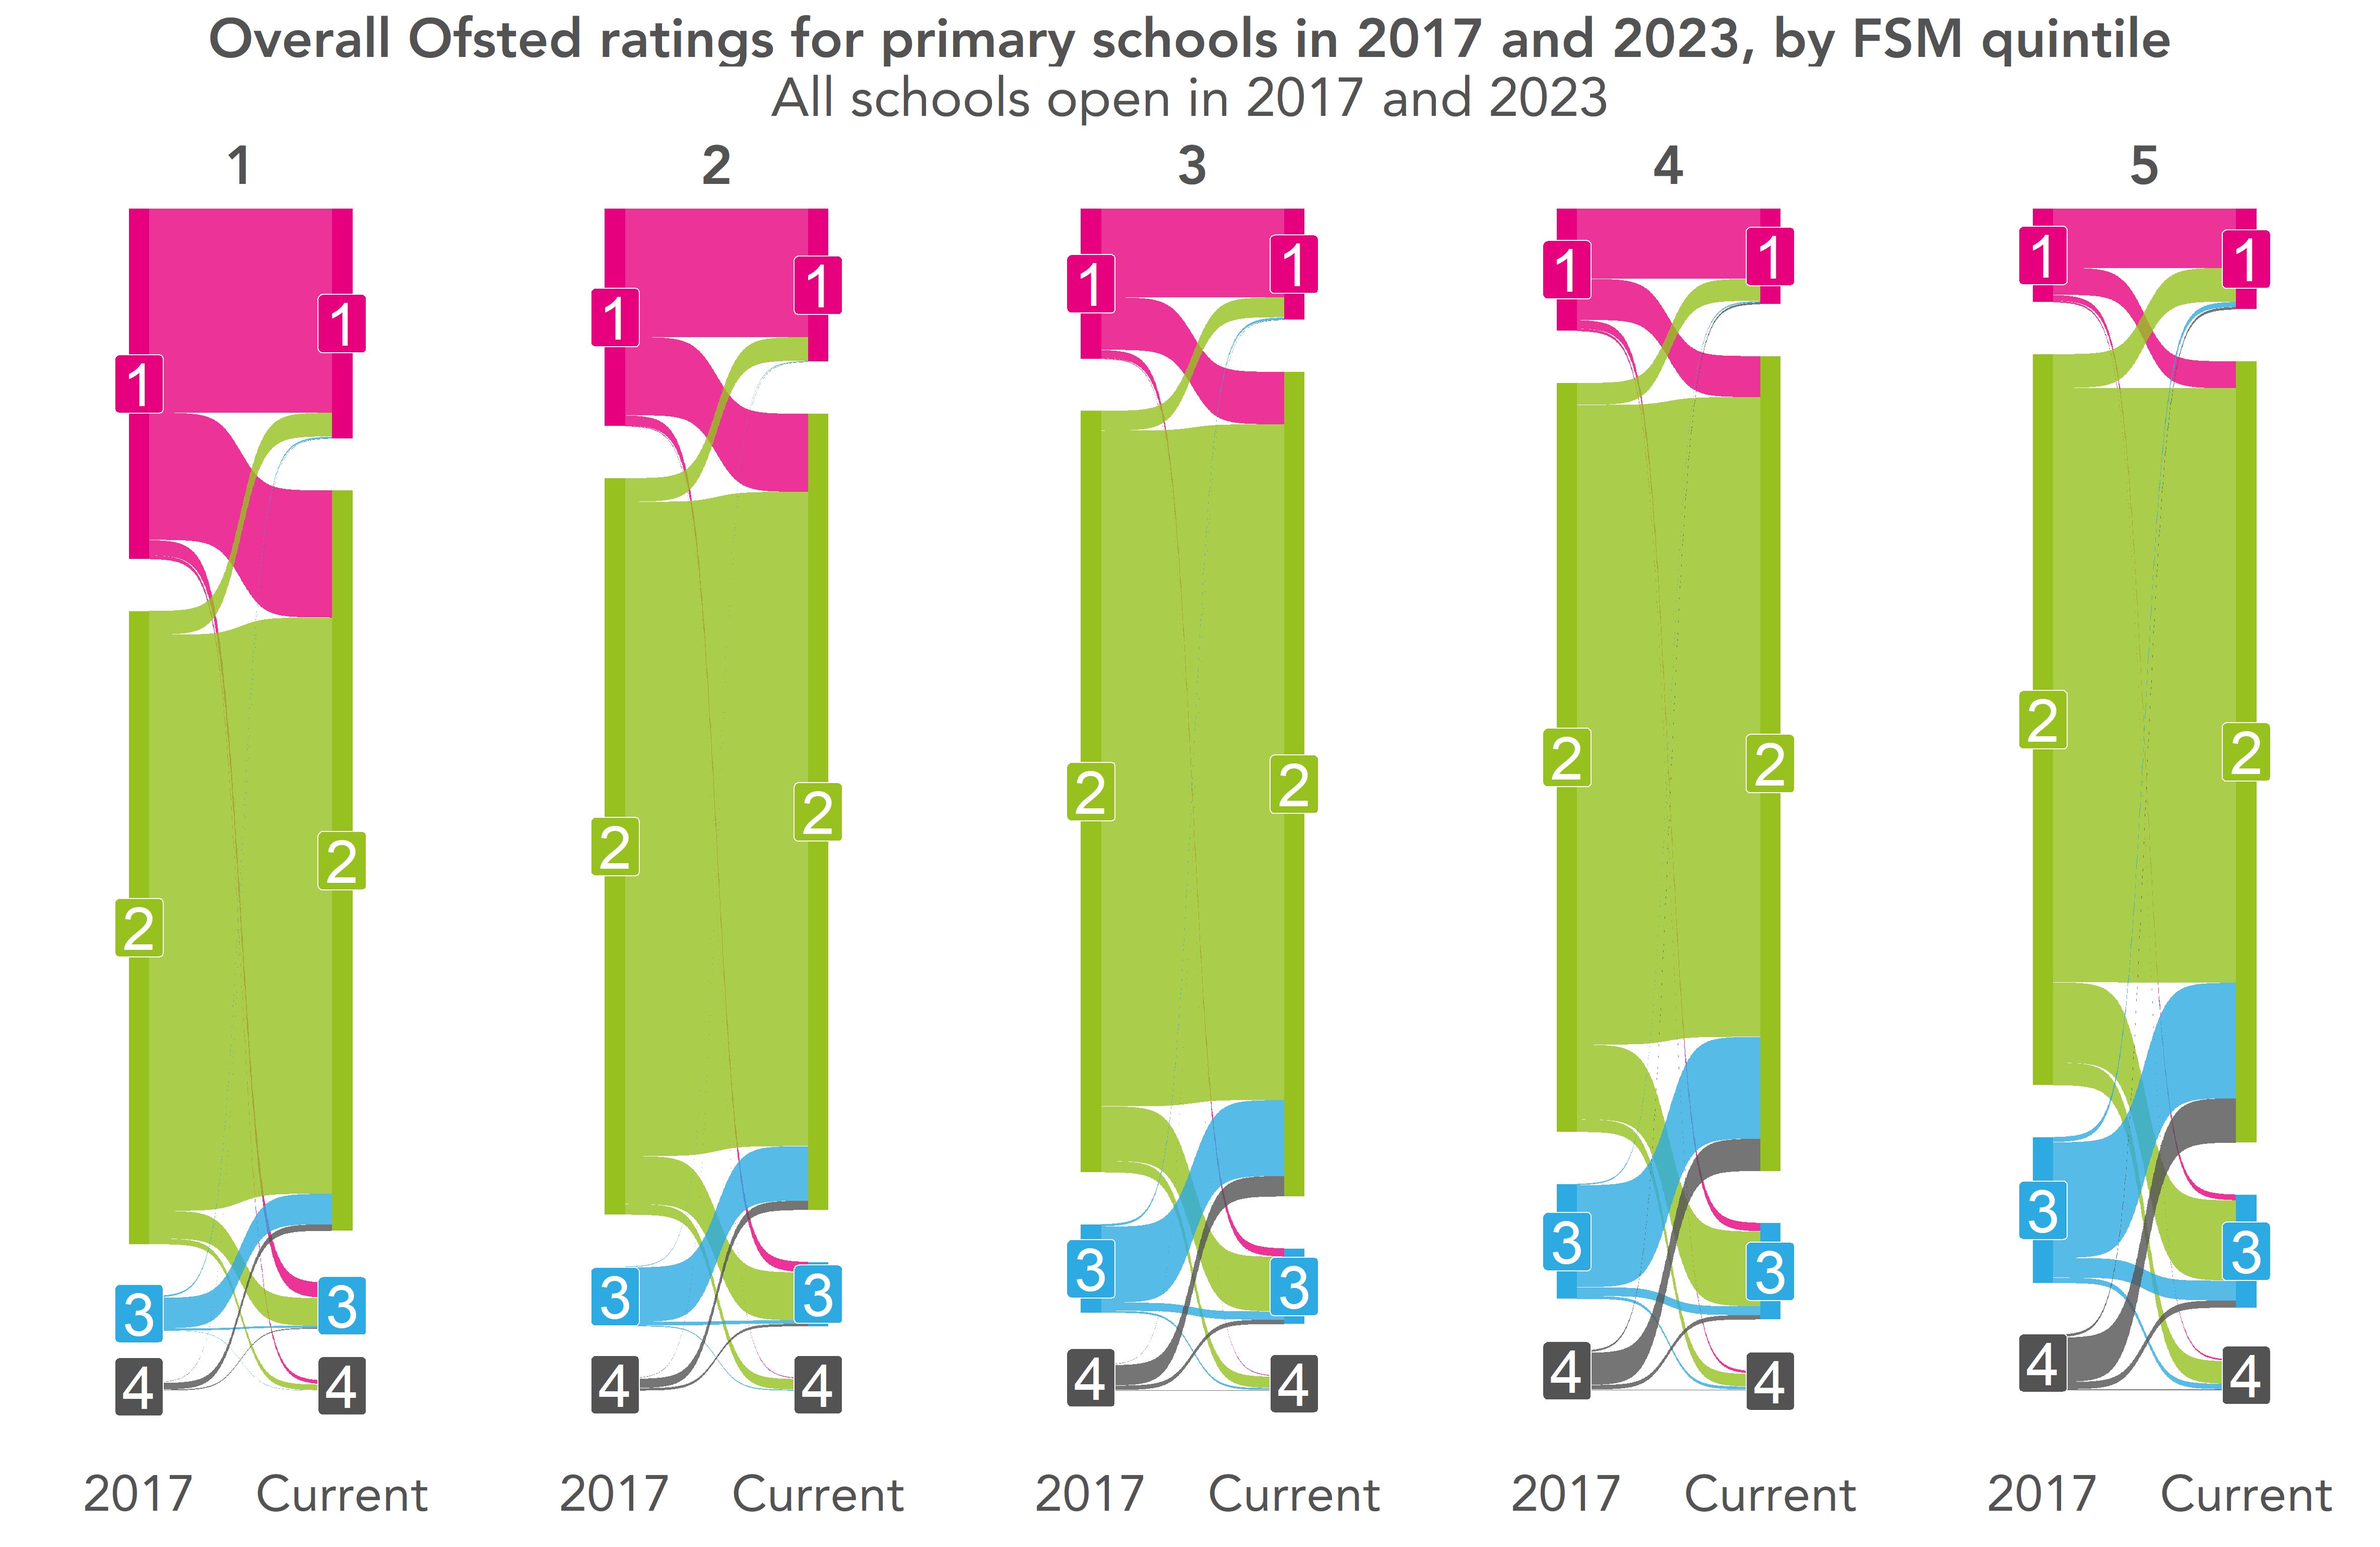
Both of these features affect our ability to make comparisons between schools in different circumstances.
If we include all schools in the charts, the broad pattern remains. The most disadvantaged schools now tend to have slightly better inspection outcomes and the least disadvantaged tend to have slightly worse outcomes.

The relationship between latest inspection outcomes and latest performance data
A school’s latest inspection outcome is just one imperfect proxy measure of school quality. As are published performance indicators.
Secondary schools that have been inspected since 2017 and are currently graded outstanding tend to have achieved higher Progress 8 scores in 2023 than other schools, with a few exceptions.
However, there is substantial overlap in Progress 8 scores between schools currently judged good, RI or inadequate although the good schools tend to have higher scores than RI schools, which tend to have higher scores than inadequate schools.
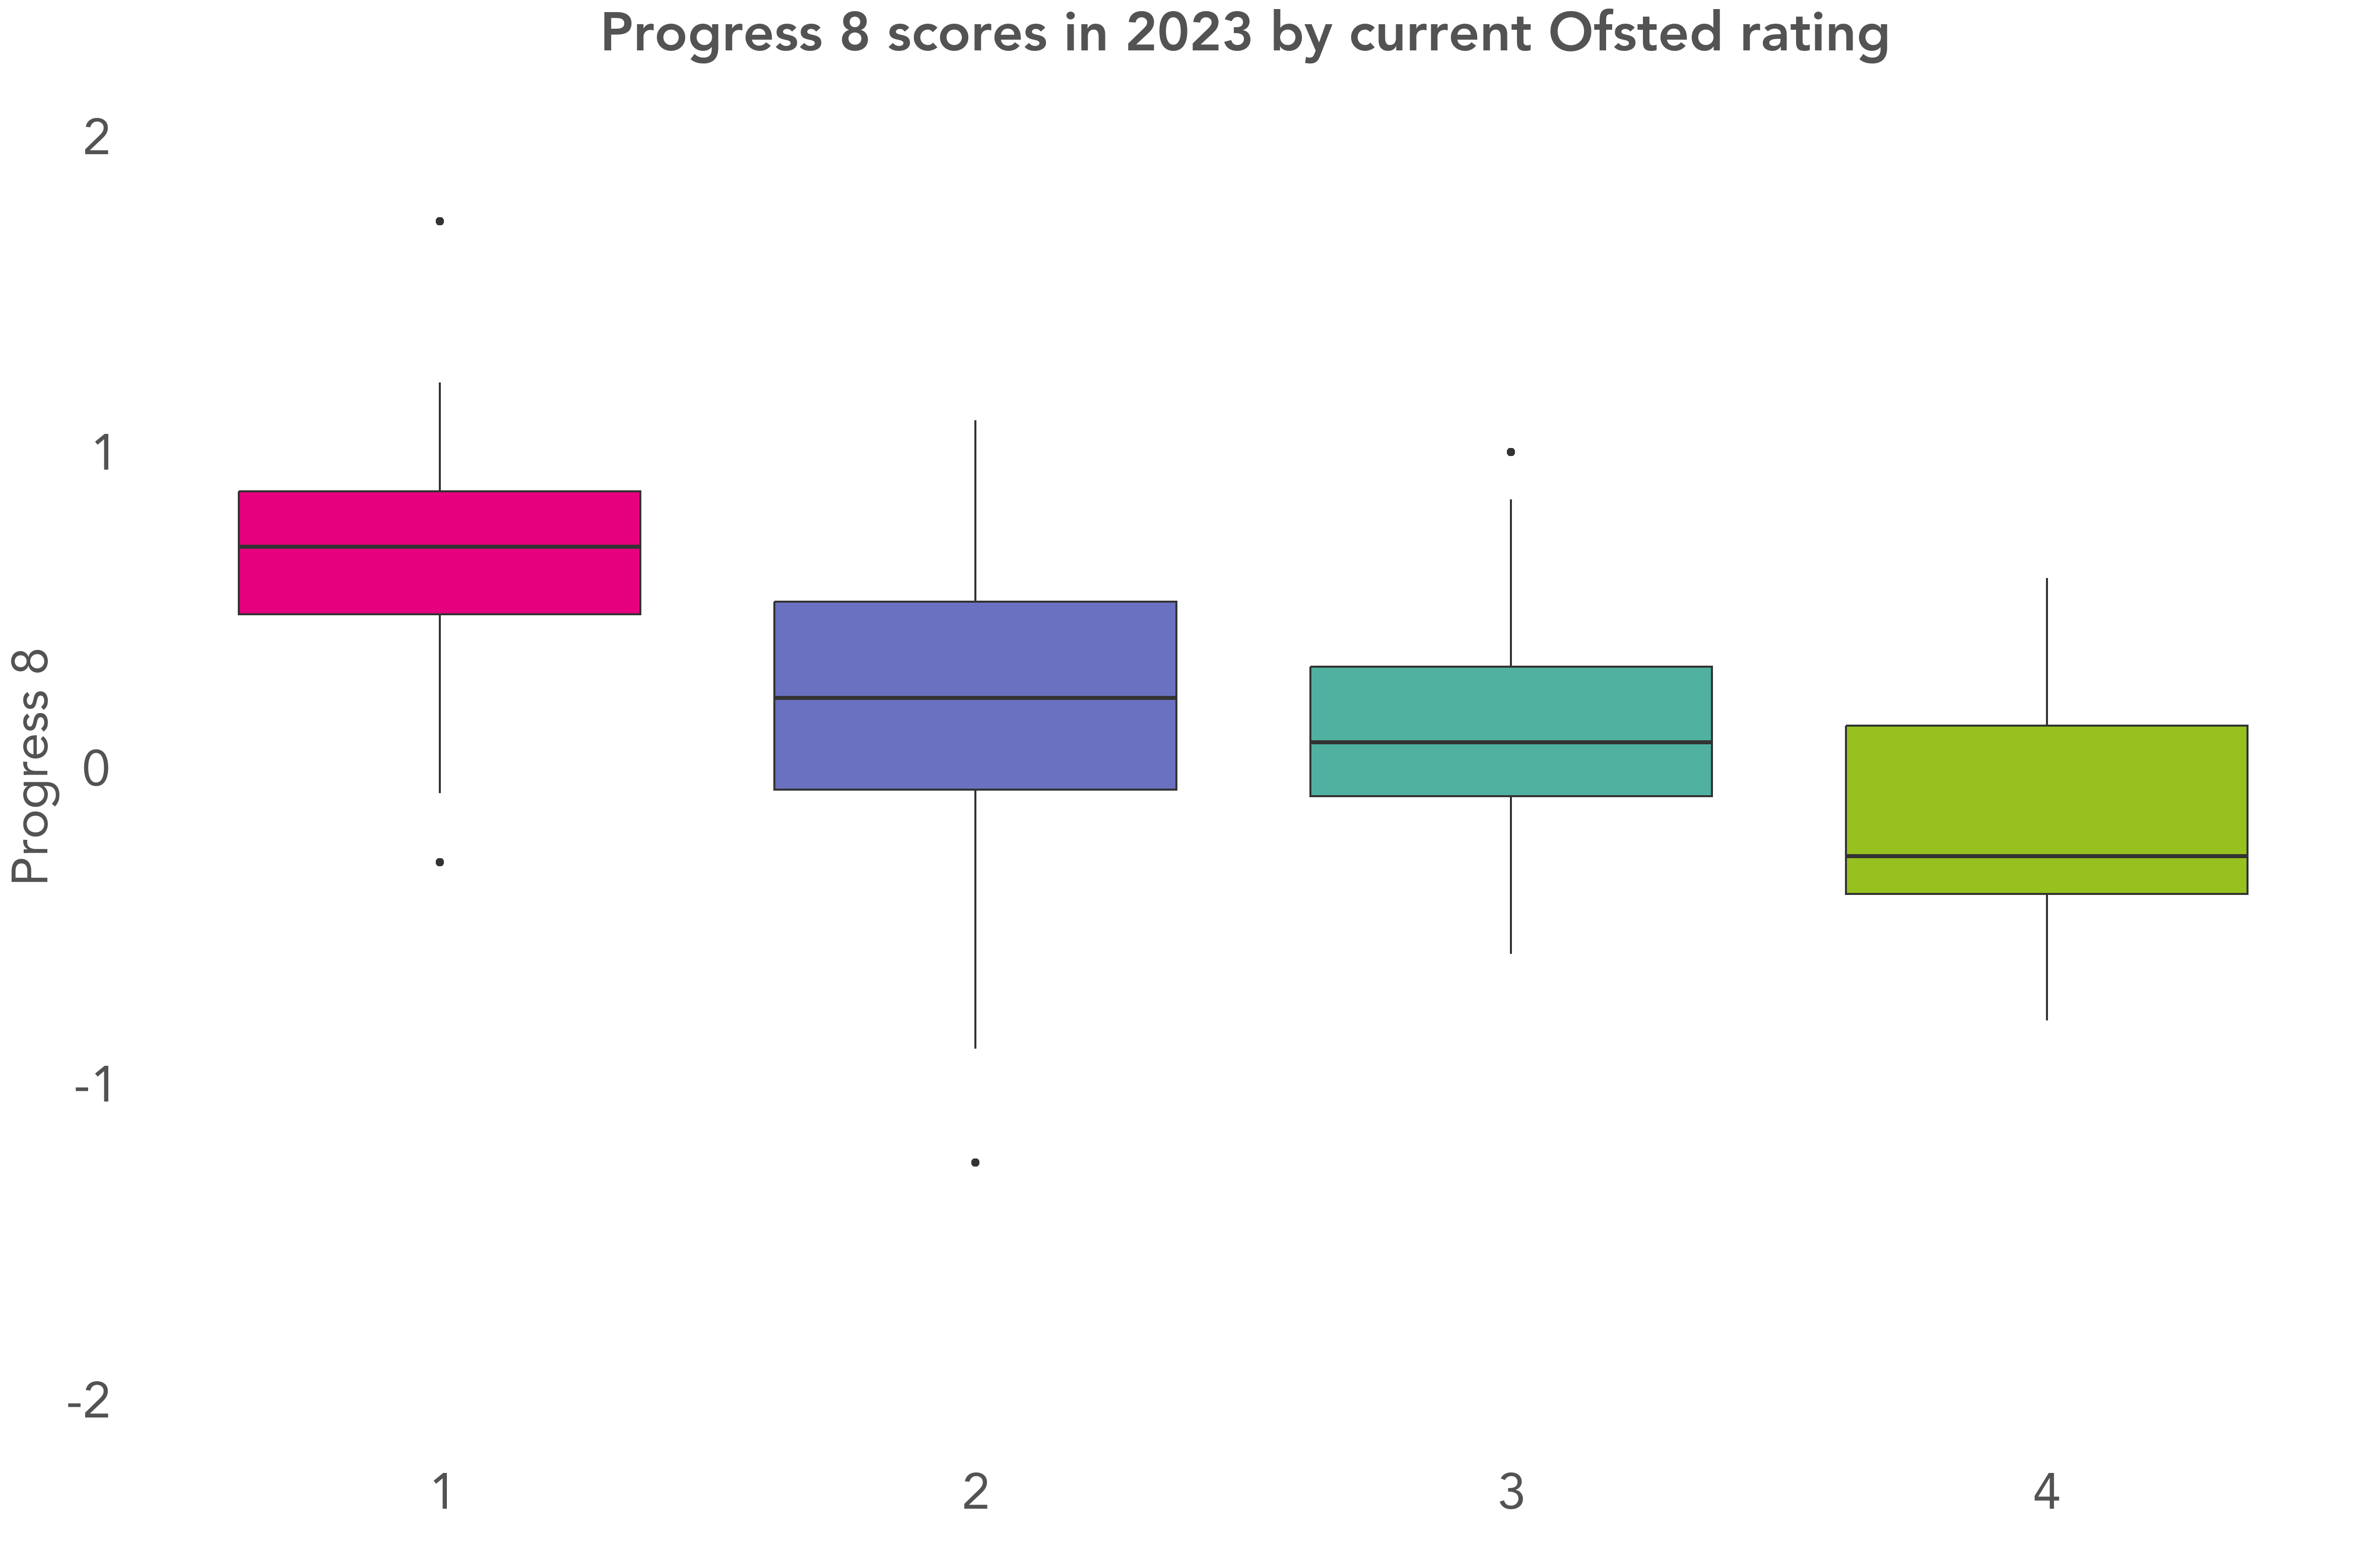
In other words, schools’ latest inspection outcomes and latest performance data may not be particularly well aligned.
Ofsted recently published some commentary on the alignment between inspection outcomes and Progress 8 measures for schools inspected in 2022/23. They claimed that an alignment rate of 64% between inspection outcome and “data band” (based on Progress 8) for secondary schools was good.
But repeating their methodology and replacing Progress 8 with percentage free school meals would yield an alignment rate of 51%. In fact, replacing it based on rank order of school reference number (called laestab) would produce an alignment rate of 48%. An alignment rate of 64% in comparison does not seem particularly high.
Multi-academy trusts
Since 2017, there has been a large increase in schools in large multi-academy trusts, which we define as trusts with 10 or more schools.
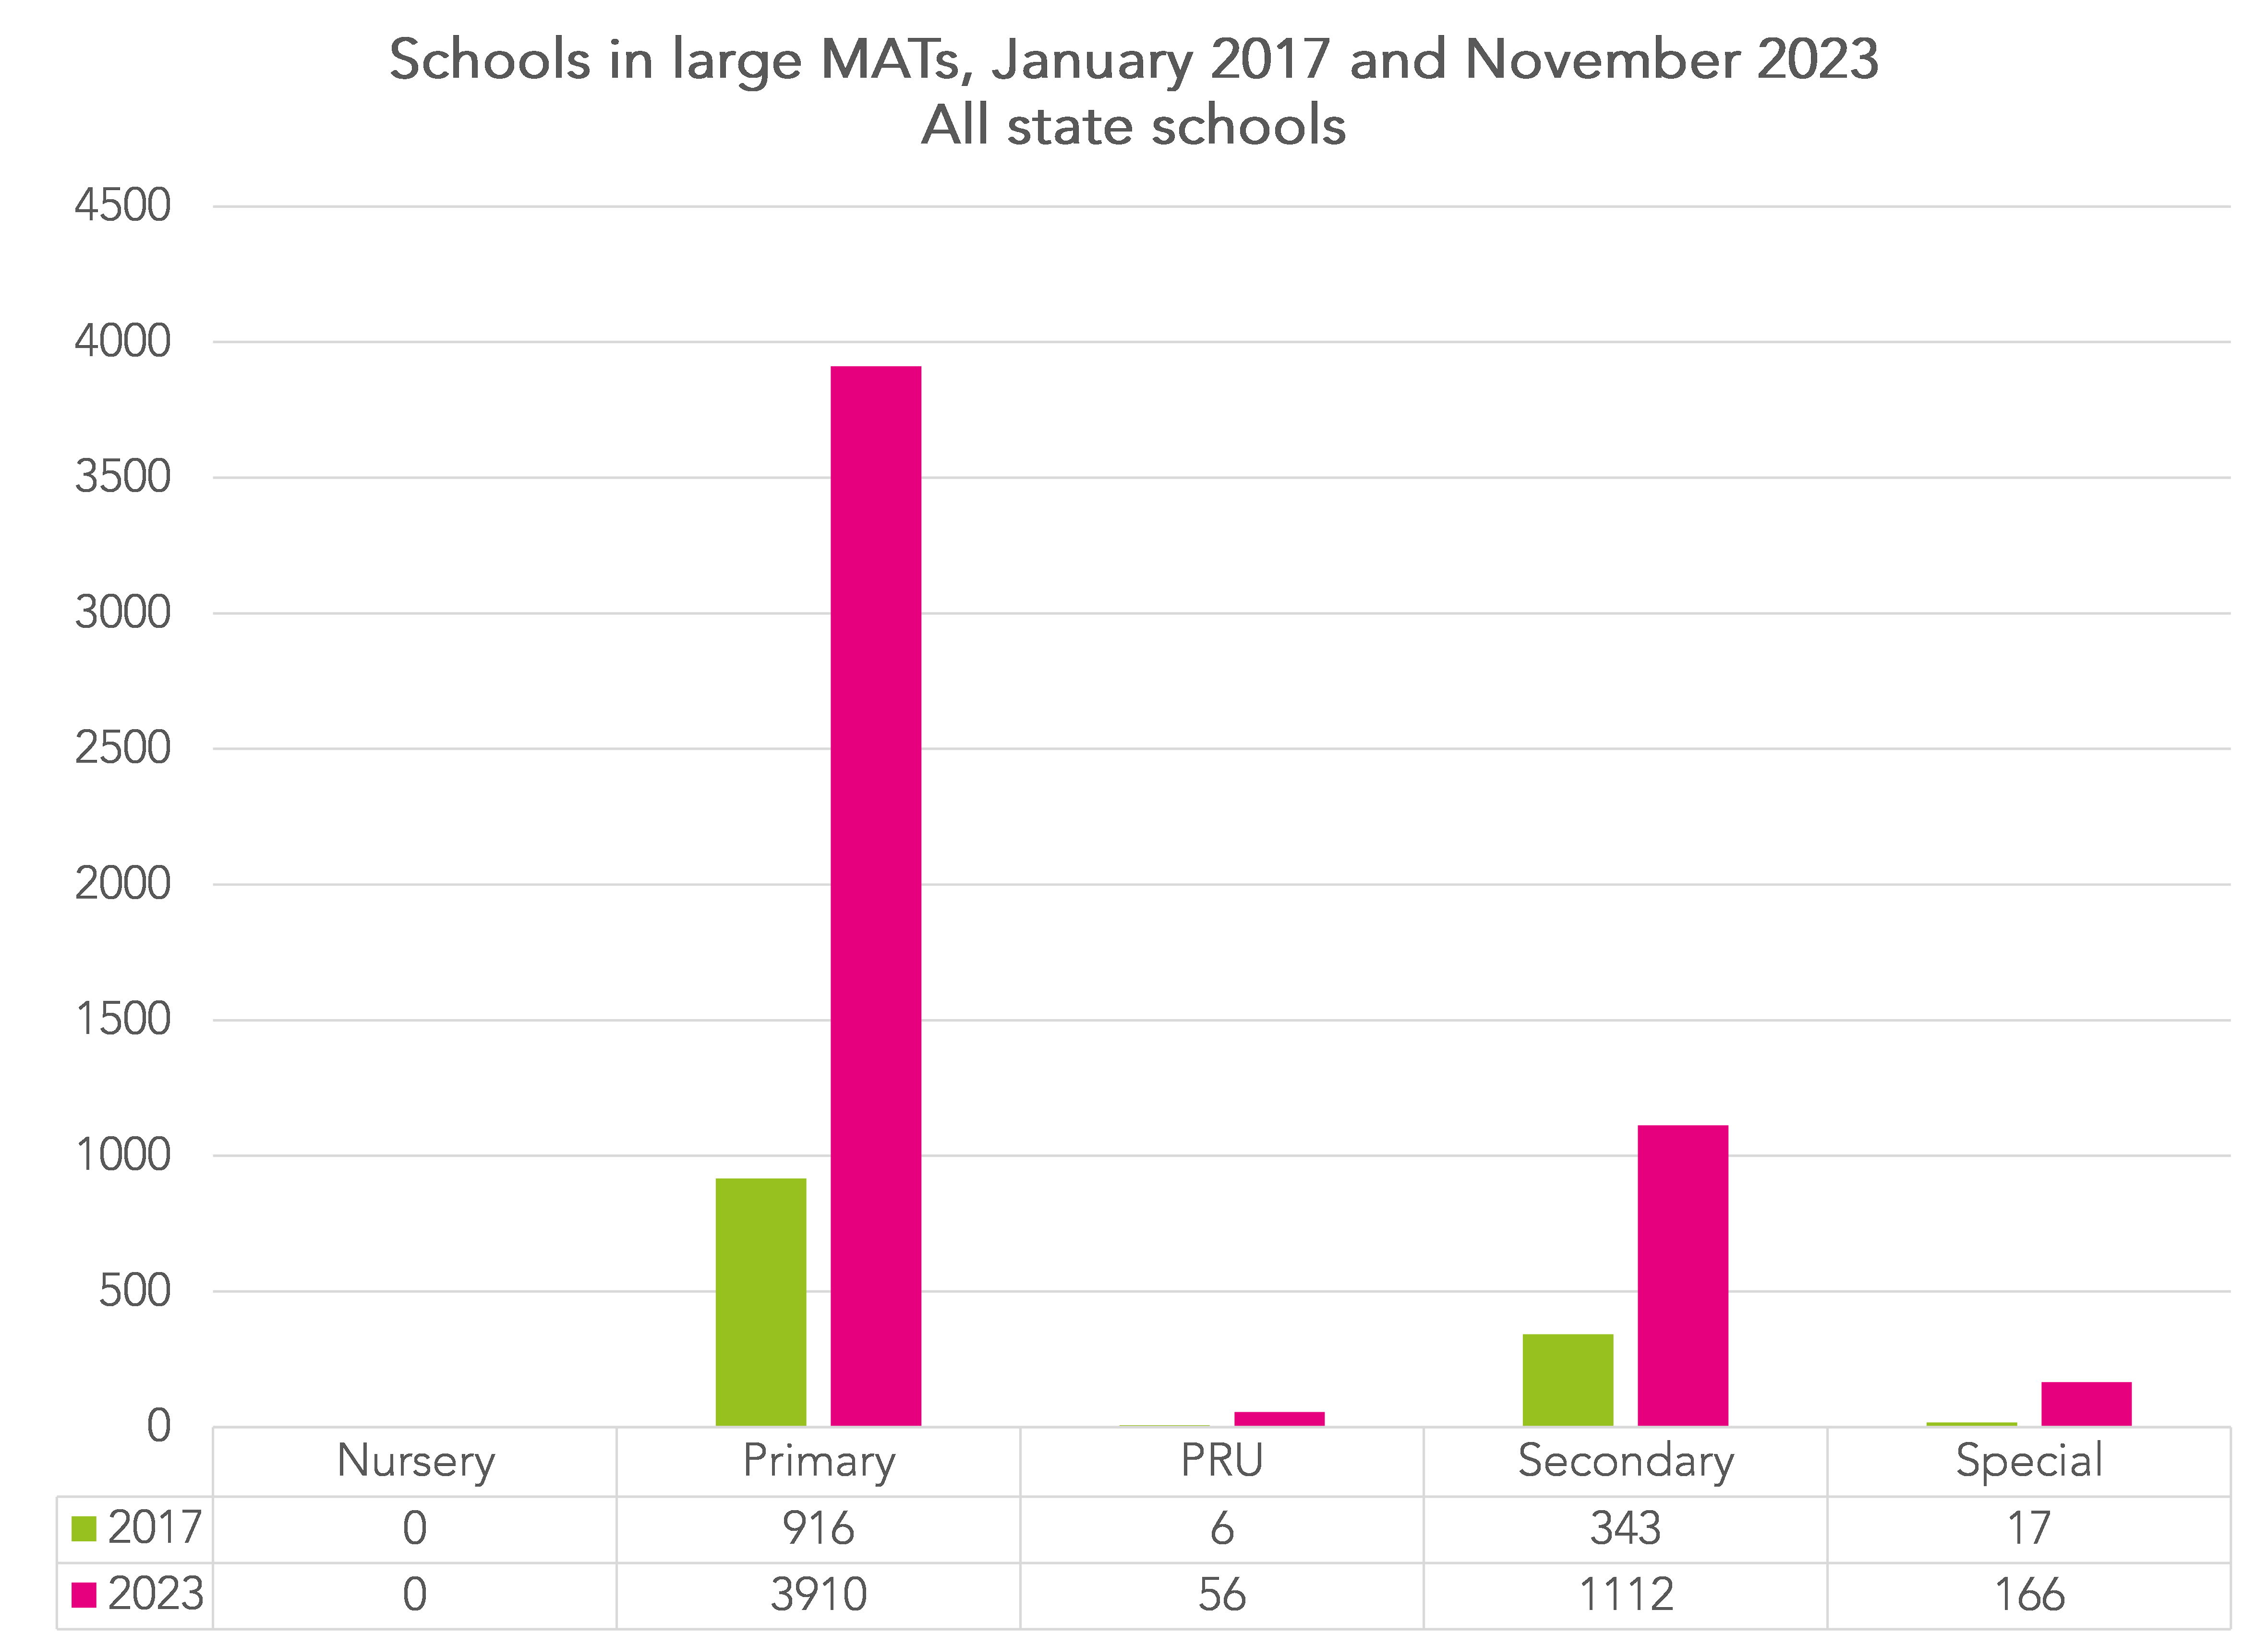
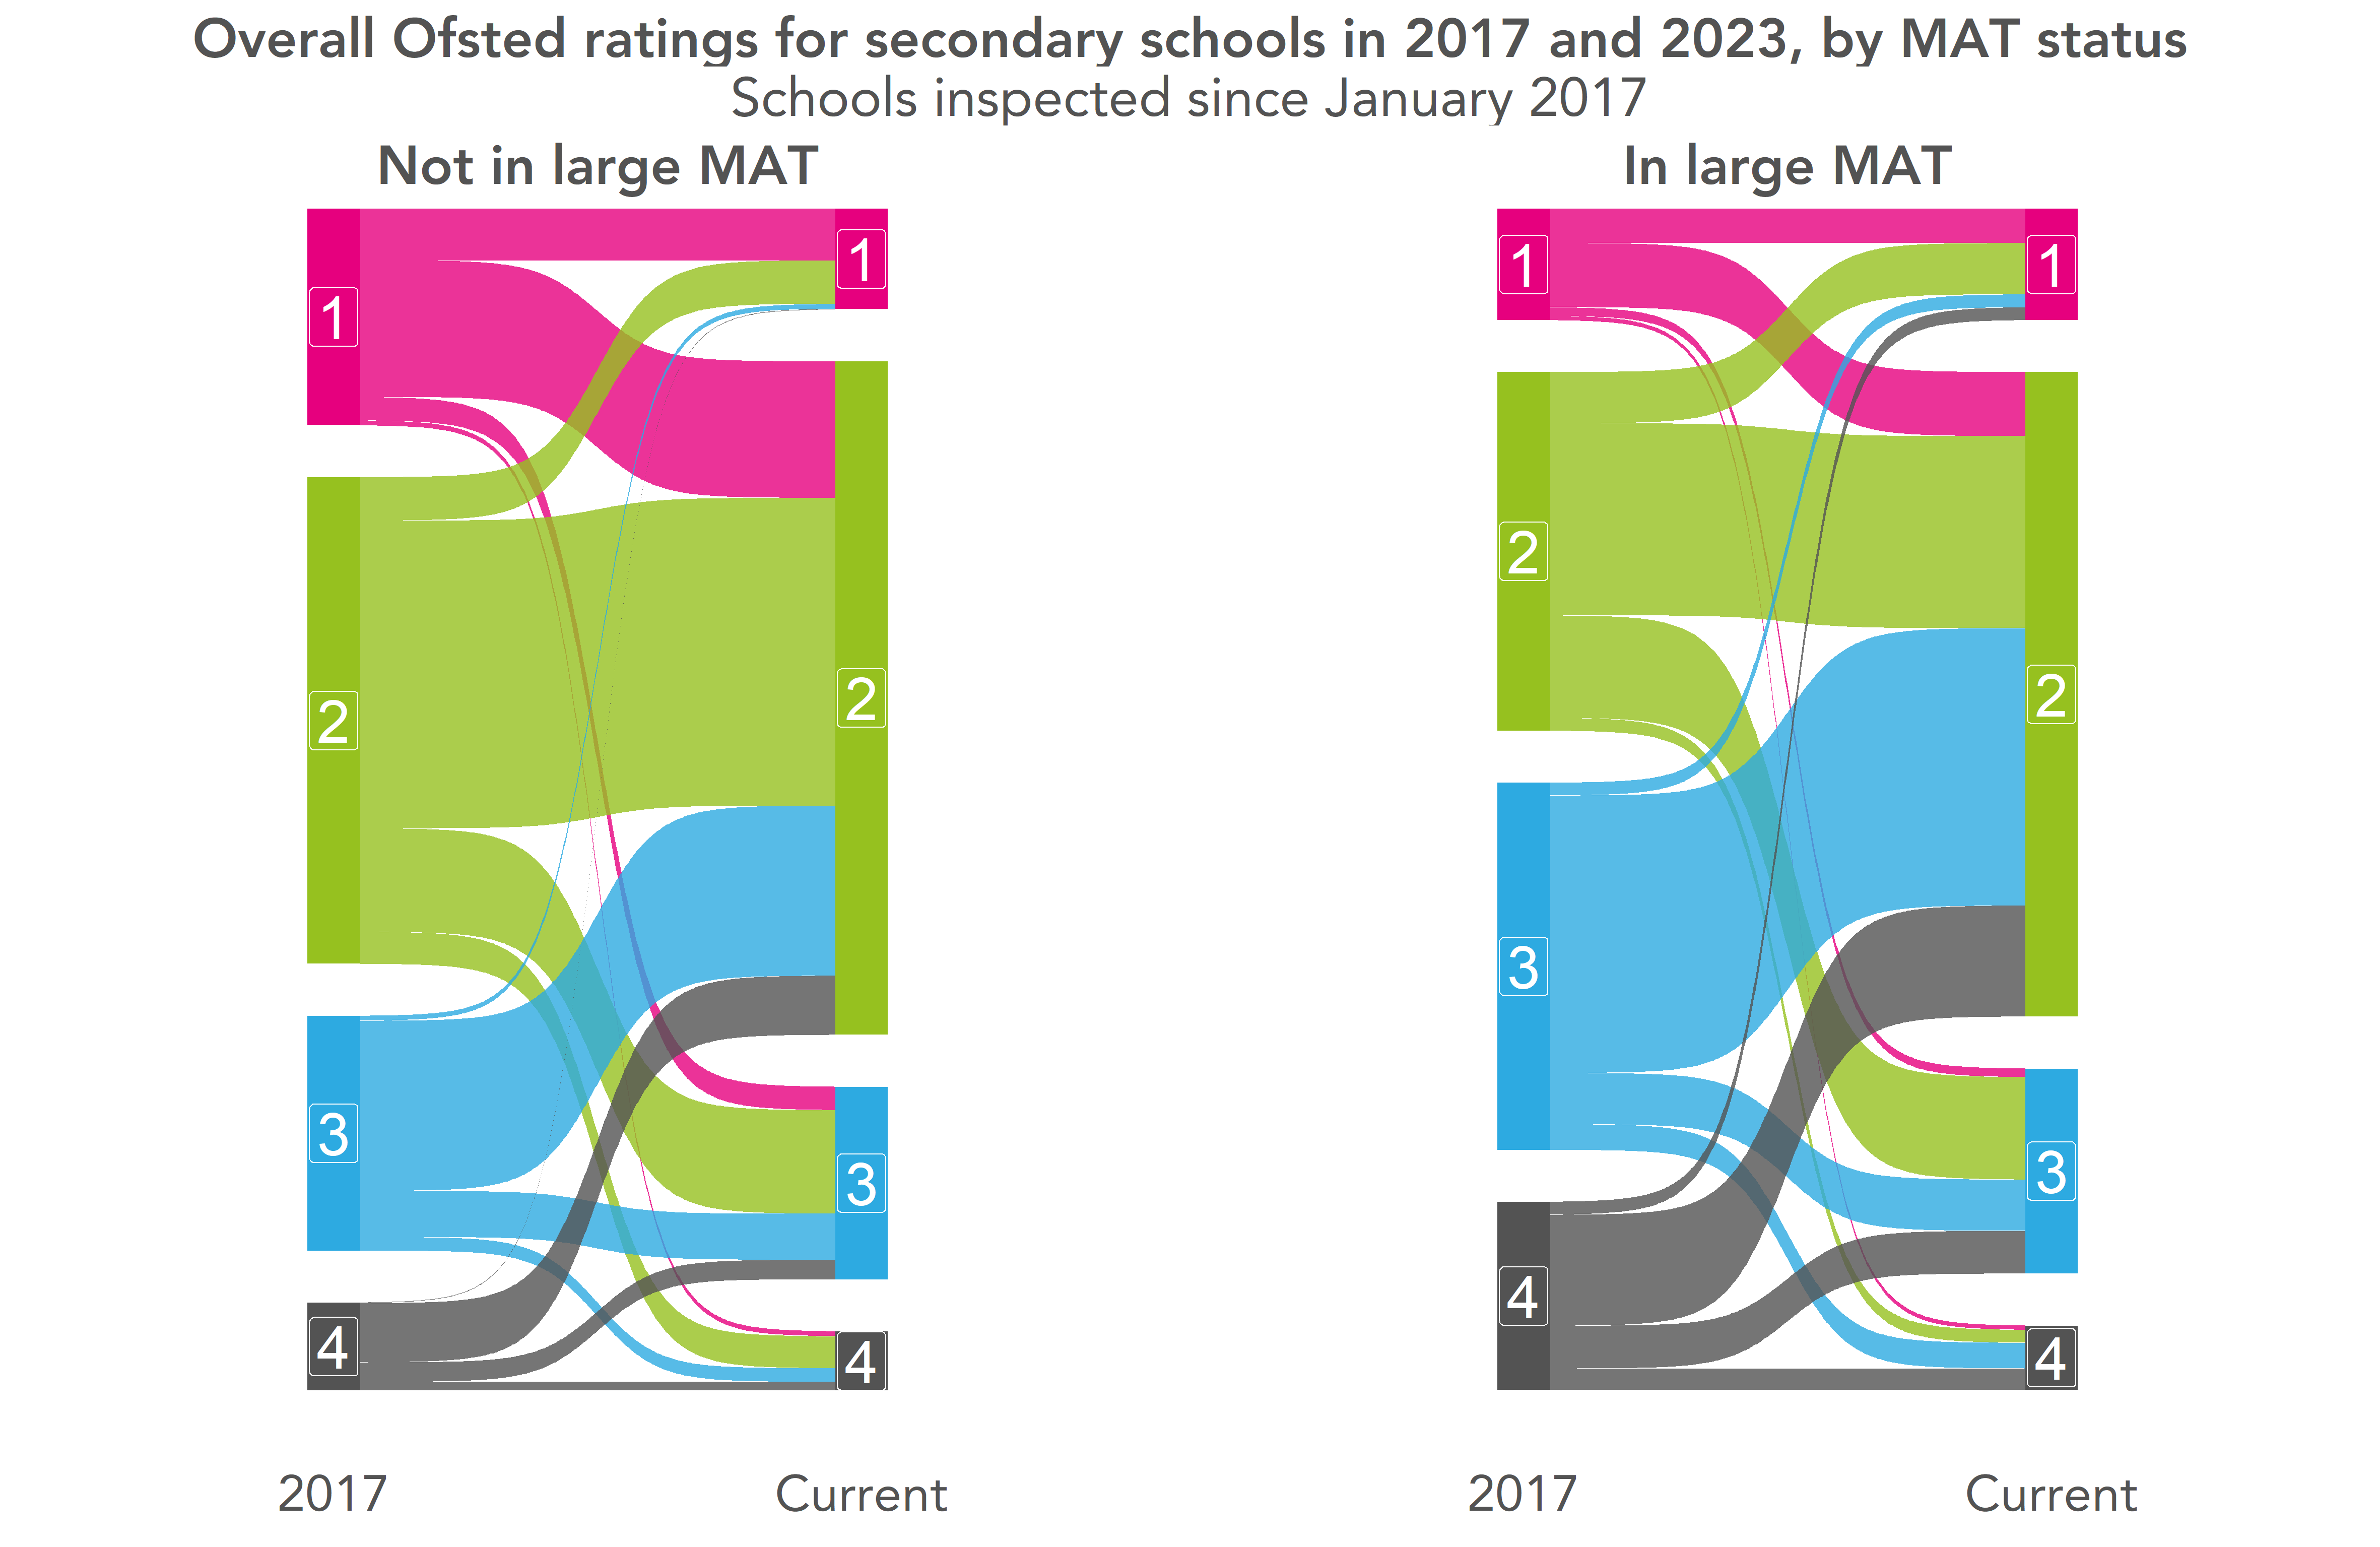
In the following charts, we examine changes in Ofsted inspection outcome for schools that were in large trusts in 2017 compared to those that were not.
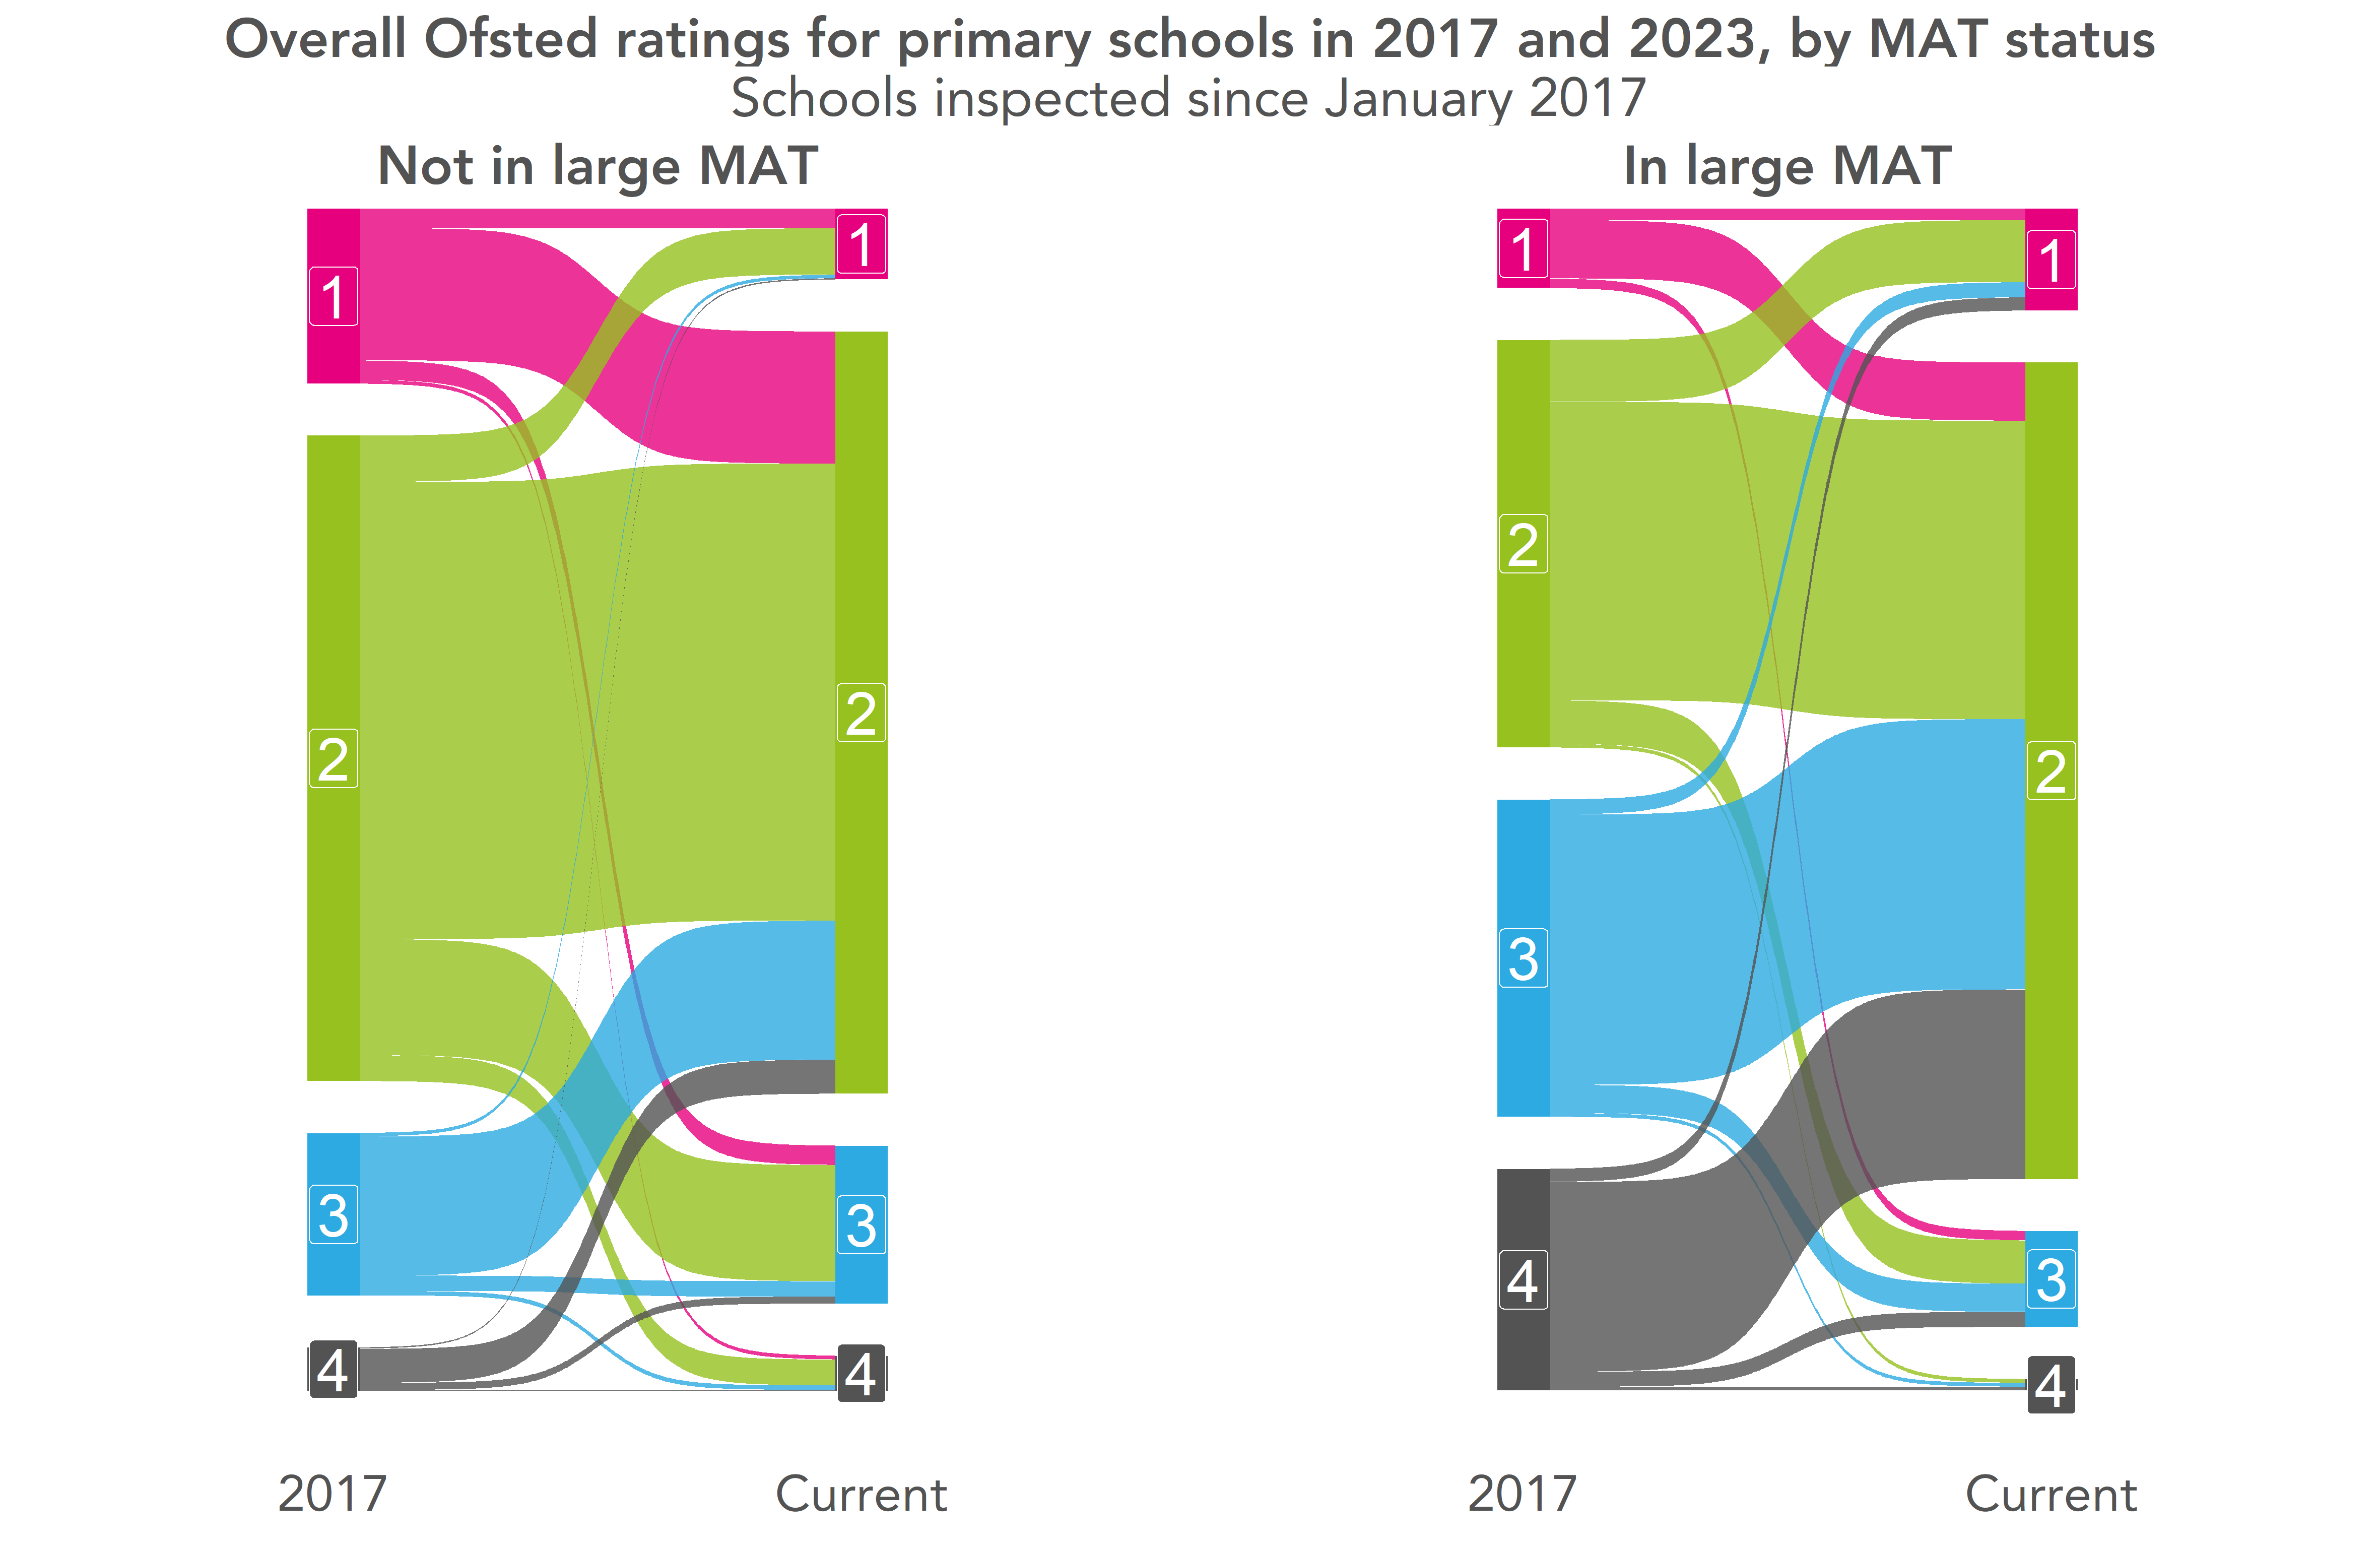
Schools that were already in large MATs in 2017 were much less likely than other schools to have been judged less than good back then.
But that’s not the case now. Proportionately more of the primary schools that were already in large MATs in 2017 are now judged good or better compared to other primary schools. Among secondary schools, the proportions graded good or better are now much the same.
If we just focus on those graded RI or inadequate in 2017:
- 91% of the 287 primary schools in large MATs in 2017 are now graded good or better. This compares to 86% of the 1578 primary schools that were not in large MATs
- 75% of the 130 secondary schools in large MATs in 2017 are now graded good or better. This compares to 73% of the 596 secondary schools that were not in large MATs
Much more needs to be done to establish causality, however.
Summing up
On the surface then, more schools are now judged good compared to when Amanda Spielman became His Majesty’s Chief Inspector of Schools.
That includes schools that have improved (from RI or inadequate) but also schools that have been downgraded from outstanding.
On the surface, the most disadvantaged schools are now more likely to be judged good or better than in 2017.
Why is this?
Is it the result of intervention following a poor inspection outcome?
Or would these schools have received better outcomes in 2017 had they been visited by an inspection team from 2023 equipped with the current framework?
This raises the question of what it means to be good. Is it the same standard as it was in the past? Did scrapping of the satisfactory outcome change lead to more schools being judged good? How well does the general public understand the differences in Ofsted framework and whether differences in framework could lead to different judgments about a school?
This matters because claims are made about the quality of the schools’ system based on increasing percentages of schools judged good or outstanding (such as this tweet by the current Secretary of State).
But I’m not sure we have much idea from this data whether schools are improving or not.
Want to stay up-to-date with the latest research from FFT Education Datalab? Sign up to Datalab’s mailing list to get notifications about new blogposts, or to receive the team’s half-termly newsletter.


This does not measure school quality, it never has. It measures a schools preparedness for and understanding of, the OFSTED system of inspection even whin performed well.
There is also an argument that the clear MAT growing agenda has influenced grading of unaffiliated schools.
The unreasonable pressure placed upon senior leadership in schools, where a less than good inspection can be career ending, or worse, is applied in a somewhat arbitary manner across inspections which appear to be neither standardised nor rigorously reviewed. There has been one instance to my knowledge where a complaint against an inspector was handled by their spouse.
Oversight is necessary, but reflective practice is supposed to be the basis of good educational practice. This system of inspection results in name and shame.