This week marks the release of a new Attendance Tracker report for schools in England – the termly 360 report.
It has a number of features to help you explore patterns in termly attendance at whole school, year group, and pupil group level, and see how these compare with national patterns.
You can also track the attendance of specific cohorts of pupils, for example, comparing the attendance of your Year 6 pupils in Autumn 2023 with the attendance of those same pupils in Autumn 2022, when they were in Year 5.
This is the feature we’re going to explore in this post, by looking at how attendance varies nationally at the transition points between different year groups.
Aspire Attendance Tracker
Schools can track, analyse and compare their attendance data against 1,000s of other FFT schools using Aspire Attendance Tracker.
Log in to Aspire to access Attendance Tracker – log in here.
Not an FFT Aspire user? Learn more here.
Data
As usual, we’ll use data from our 10,000 Attendance Tracker schools. We’ll compare pupils’ absence rates in Autumn 2023 with the absence rates of the same pupils in Autumn 2022.
Due to the way the data is structured, we’re only able to look at transitions of pupils who were in the same school in Autumn 2022 and 2023. For this reason, we must exclude the Year 6 to 7 transition point. Though we intend to revisit this in a future post.
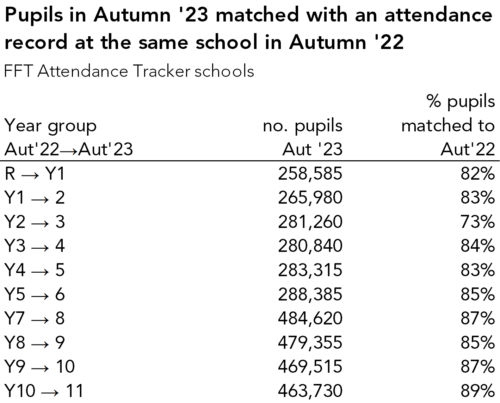
Below we summarise the percentage of pupils in each year group in Autumn 2023 who we were able to match with an attendance record in Autumn 2022[1]. Note the relatively low match rate for pupils moving from Year 2 into Year 3. This is due to pupils who attended separate infant and junior schools.
Overall changes in absence rates
To start, let’s look at the percentage of sessions missed in Autumn 2023, and compare it with the percentage of sessions missed by the same pupils in Autumn 2022. We’ll split the data by year group.
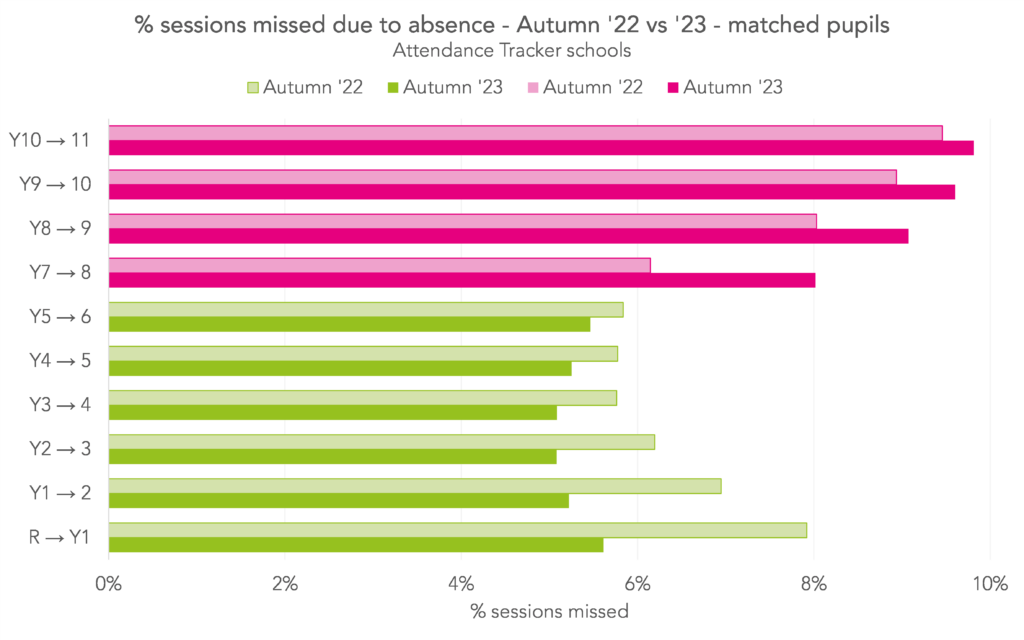
On average, pupils in all primary year groups had lower absence rates in Autumn 2023 than 2022. The biggest drops were seen among the youngest pupils. Those moving from Reception into Year 1 saw a drop in absence of 2.3 percentage points (from 7.9% in Autumn 2022 to 5.6% in Autumn 2023). Pupils moving from Year 5 into 6 saw a smaller drop of 0.3 percentage points (from 5.5% to 5.8%).
Conversely, pupils in all secondary year groups had higher absence in Autumn 2023 than Autumn 2022, with the biggest increases among the youngest pupils. Those moving from Year 7 into 8 saw an increase of 1.9 percentage points (from 6.1% in Autumn 2022 to 8.0%). Those moving from Year 10 into 11 saw an increase of 0.3 percentage points (from 9.5% to 9.8%).
When interpreting these results, we must bear in mind that absence overall was lower in Autumn 2023 than 2022, particularly so in primary schools[2]. We might expect that if we compared two time periods where absence rates were more similar, we would see absence increase from year to year for some primary year groups. Particularly for older pupils where the observed drops were smaller.
Changes by gender
Now let’s look at how changes in absence were related to pupil characteristics. Here we plot the same chart, separately for girls and boys.
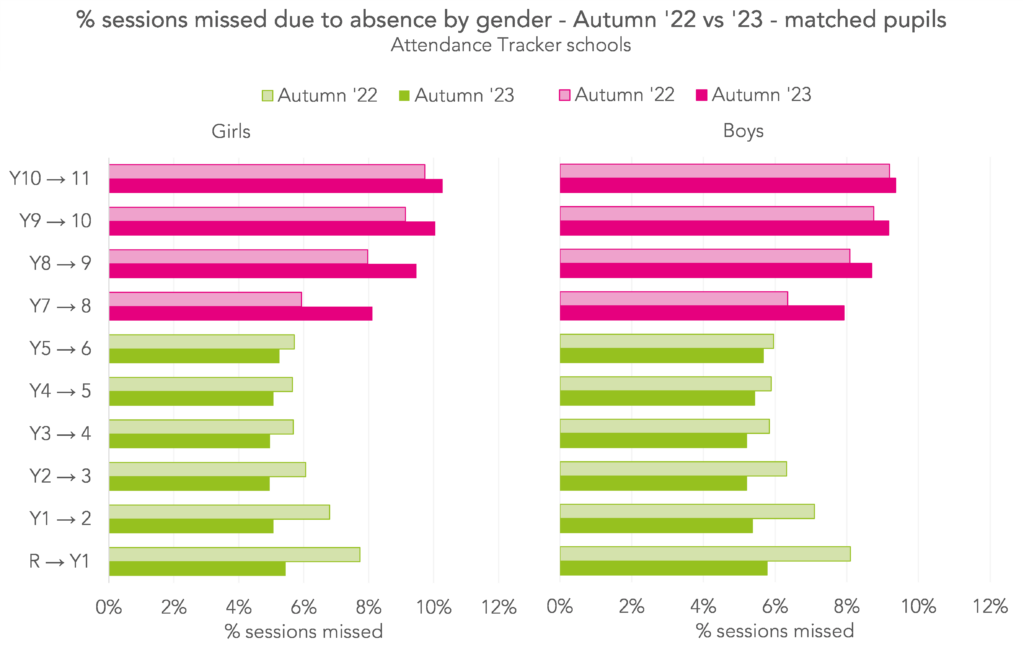
Among primary pupils, although boys tended to have slightly higher rates of absence than girls, the change from one year to the next didn’t seem to have any relationship with gender at all.
At secondary though, it’s a different story. Absence for girls increased by more than for boys at every transition point. The biggest difference was for pupils moving from Year 8 into 9, where absence for boys increased by 0.6 percentage points compared with 1.5 percentage points for girls. (From 8.1% in Autumn 2022 to 8.7% in Autumn 2023 for boys, and from 8.0% to 9.5% for girls.)
Changes by disadvantage
To finish, let’s look at the pattern by disadvantage. Here we plot the same chart, this time separately for pupils who were eligible for free school meals in the past six years (FSM6) and those who were not.
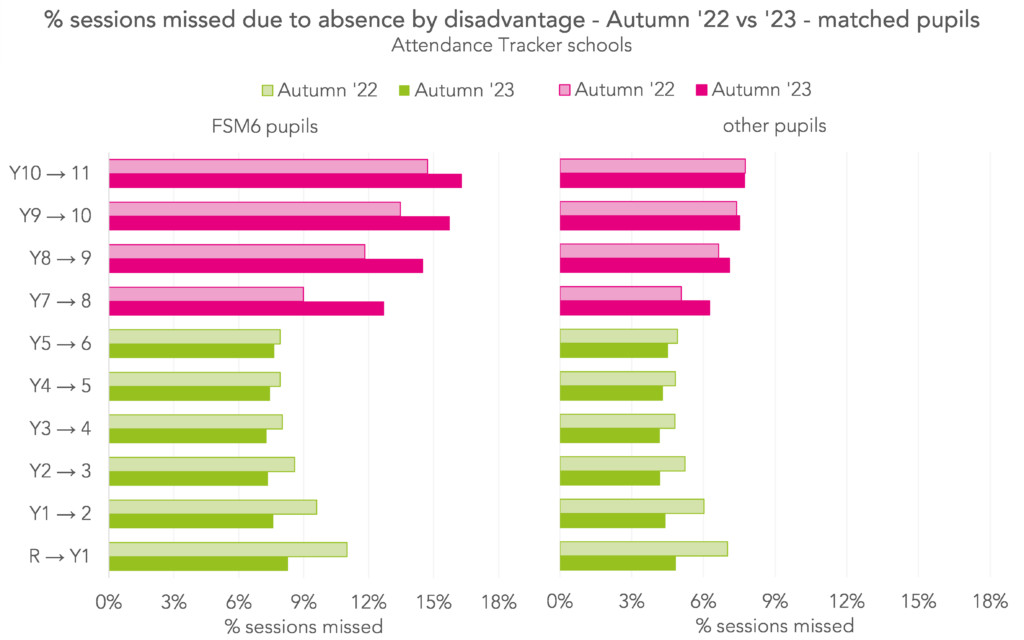
Broadly, at primary, both FSM6 and other pupils saw similar changes in absence at each transition point. The one exception was among the youngest pupils, where FSM6 pupils saw slightly bigger drops than their peers (albeit from a higher baseline). FSM6 pupils moving from Reception to Year 1 saw a reduction in absence of 2.7 percentage points (from 11.0% in Autumn 2022 to 8.3% in Autumn 2023), while non-FSM6 pupils saw a reduction of 2.2% (from 7.0% to 4.8%).
At secondary, again, the picture is quite different. At every transition point, absence for FSM6 pupils increased more than for their peers.
The biggest increase in absence among both FSM6 and non-FSM6 pupils was for those moving from Year 7 into Year 8, followed by Year 8 into 9. The increase was much bigger for FSM6 pupils than non-FSM6 pupils though. FSM6 pupils saw an increase of 3.7 percentage points between Year 7 and 8 (from 9.0% to 12.7%), while non-FSM6 pupils saw an increase of 1.2 percentage points (from 5.1% to 6.3%). Between Year 8 and Year 9, FSM6 pupils saw an increase of 2.7 percentage points (from 11.8% to 14.5%) compared with 0.5 percentage points for non-FSM6 pupils (from 6.6% to 7.1%).
There was little to no change for non-FSM6 pupils moving from Year 9 into 10 or Year 10 into 11. FSM6 pupils moving from Year 9 into 10 saw an increase of 2.3 percentage points (from 13.5% to 15.7%), and from Year 10 into 11 an increase of 1.6 percentage points (from 14.7% to 16.3%).
The smallest increase among FSM6 pupils, for those moving from Year 10 into 11, was larger in percentage point terms than the largest increase among non-FSM6 pupils, those moving from Year 7 into 8.
Summing up
We’ve seen that changes in absence rates from one year to the next varied by year group. The biggest drops were among the very youngest pupils, moving from Reception into Year 1, while the biggest rises were among those moving from Year 7 into 8, and Year 8 into 9.
There also seems to be a relationship between changes in absence and pupil characteristics, particularly among secondary pupils.
You can see what the picture looks like for your school by visiting the Attendance Tracker homepage, and selecting “Termly 360” from the top navigation bar.
Want to stay up-to-date with the latest research from FFT Education Datalab? Sign up to Datalab’s mailing list to get notifications about new blogposts, or to receive the team’s half-termly newsletter.


Do you have the absence reason codes in your dataset? I think it would be enlightening to compare the year on year without the effects of illness in the community (although that’s becoming flawed with campaigns on how ill you need to be to stay away from school)
Hi Michael, thanks for the suggestion. I’ve run the numbers again excluding absences coded as illness – results here (note the different x-axis scale vs the equivalent chart on the post). We get small increases for each primary transition, and much bigger increases for secondary transitions. Particularly Year 7 into 8. The context for this one is that non-illness absence stayed roughly the same at primary between Autumn ’22 and ’23, and increased by about half a percentage point at secondary (see our Autumn roundup post).
So we now see all year groups had higher absence in Autumn 2023 than Autumn 2022 which I’d argue is an even bigger cause for concern as it supports the hypotheses that attitudes to attendance have changed post pandemic across all year groups. There’ a separate hypothesis that Autumn 22 illness rates were higher than ‘usual’ in primary schools as pupils hadn’t built up natural immunity by mixing / catching childhood illnesses earlier because of Covid disruption.
I’m not sure I’d agree with your first conclusion. Or, rather, I don’t think you can make it based on this chart. All this chart shows is that each transition to an older year group was associated with an increase in non-illness related absence, particularly among secondary pupils. Given that older pupils have always had higher rates of unauthorised absence than younger pupils, this probably isn’t anything new. I think both of your hypotheses are better supported by looking at overall absence rates split by reason code, comparing pre-pandemic with Autumn ’22 and Autumn ’23 as we did in our Autumn roundup (there’s no breakdown by year group in there, but we could look at that in the Spring post).
You mention that you will be looking at the transition point between Y6 and Y7, as currently there is an issue between pupils who were not in a same school. Could Y2 to Y3 be included as well as there area number of Infant/ Junior schools, and attendee figures between the two settings can show differences.
Hi Rob, good point, thanks – we’ll look into it
Hello Kaite, The updated graph excluding absences coded as illness is interesting. Is it possible for an individual school to generate the same?
Hi John. Unfortunately, this particular breakdown doesn’t exist in Attendance Tracker at the moment. If you contact support@fft.org.uk with a few details to let them know it’s something you’d like to see, they can add it to the product development plan which they review regularly. New Attendance Tracker developments are driven by customer demand and available resource