A couple of months ago we looked at how absence changed as pupils passed from one year group into the next. However, due to data constraints at the time, we weren’t able to include the transition between Year 6 and Year 7.
Since then, we’ve been working hard behind the scenes. And today we’re going to deliver on our (weakly worded) promise to “revisit [the topic] in a future post”.
Here, we’re going to focus on how changes in attendance from Year 6 into Year 7 vary by disadvantage.
Data
As usual, we’ll be using data from our 10,000 or so Attendance Tracker schools. We have attendance records for around 230k pupils who moved from Year 6 to Year 7 in state-funded mainstream schools between 2022/23 and 2023/24.
We trim this number down to around 200k by excluding pupils with incomplete attendance records in Year 6 or in the first term of Year 7[1].
Around 95% of our 200k pupils moved schools between Year 6 and Year 7.
Overall absence
Let’s start by comparing the percentage of sessions missed by our sample of pupils in Year 6 and in Year 7. Here and throughout, we’ll be comparing the whole of the 2022/23 academic year with the Autumn and Spring Terms of 2023/24.
Below we plot the percentage of sessions missed in Year 6 and 7 by disadvantage, as measured by free school meal eligibility in the past six years (FSM6).
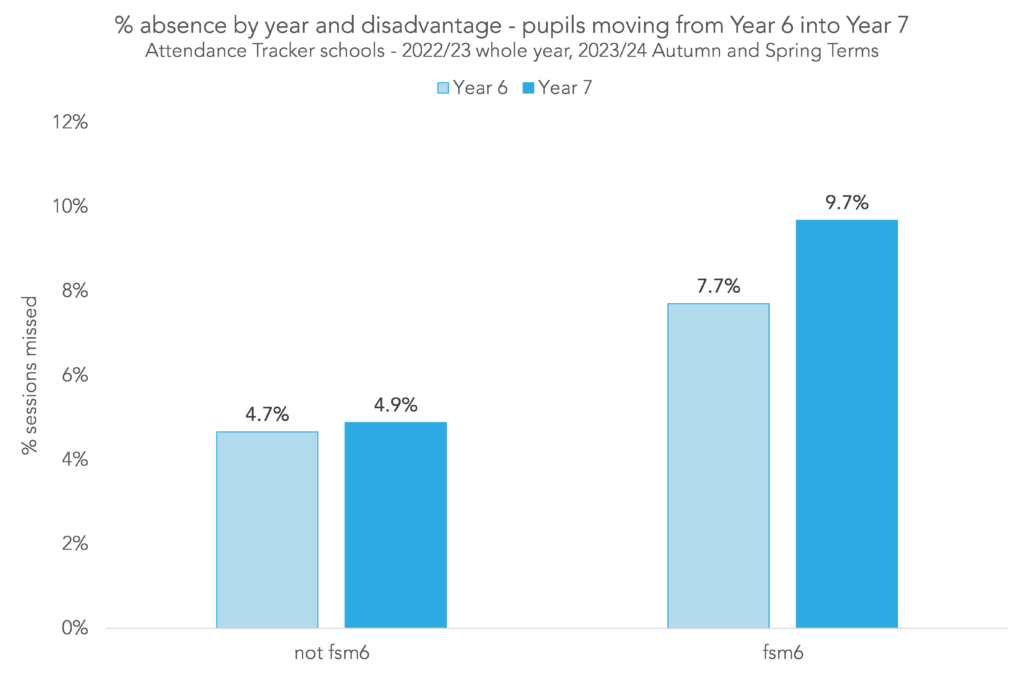
Absence among the non-disadvantaged pupils in our sample increased by 0.2 percentage points (pp) between Year 6 and Year 7. For disadvantaged pupils, the increase was much higher, at 2.0pp.
As a result, while the difference in absence between disadvantaged and non-disadvantaged pupils in Year 6 was 3.0pp, in Year 7 it had grown to 4.8pp.
Year 7 absence by Year 6 absence
One possible explanation for this is that pupils who already had problems with absence in Year 6 (disproportionately more likely to be disadvantaged) were likely to see those problems accelerate in Year 7.
We can test this by plotting Year 7 absence by disadvantage, but this time breaking the data down by Year 6 absence rates.
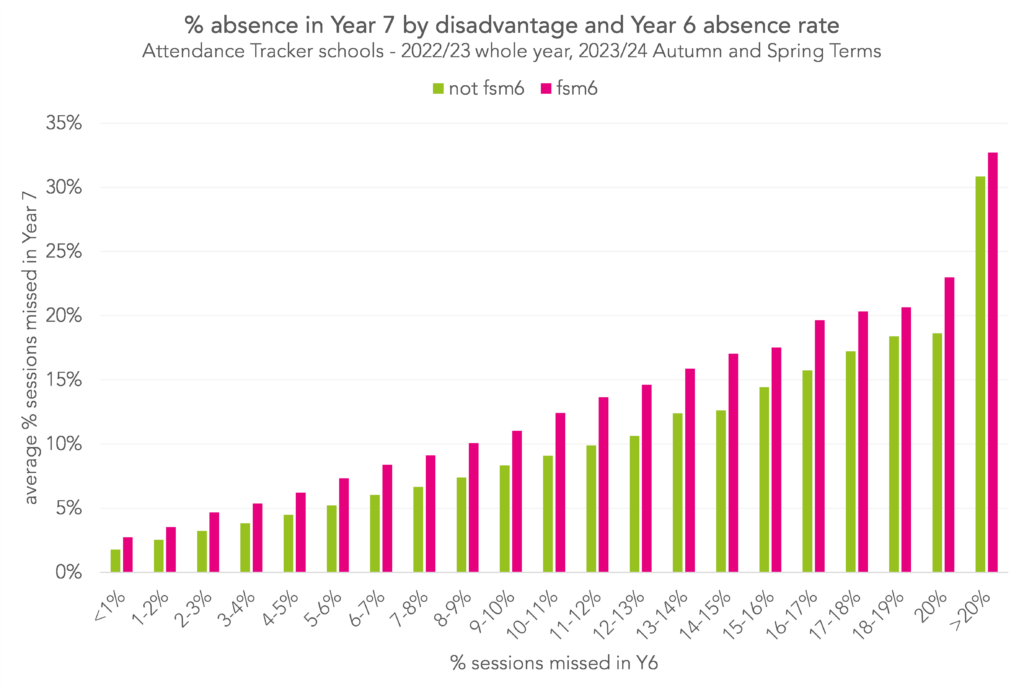
It’s clear that pupils with higher absence in Year 6 tended to also have higher absence in Year 7.
But if our hypothesis were true, we’d expect each pair of bars for disadvantaged pupils and others to be roughly the same size. We can see that they aren’t. For example, among pupils who missed 10-11% of sessions in Year 6, those who were disadvantaged went on to miss around 12% of sessions in Year 7, while those who weren’t went on to miss 9%.
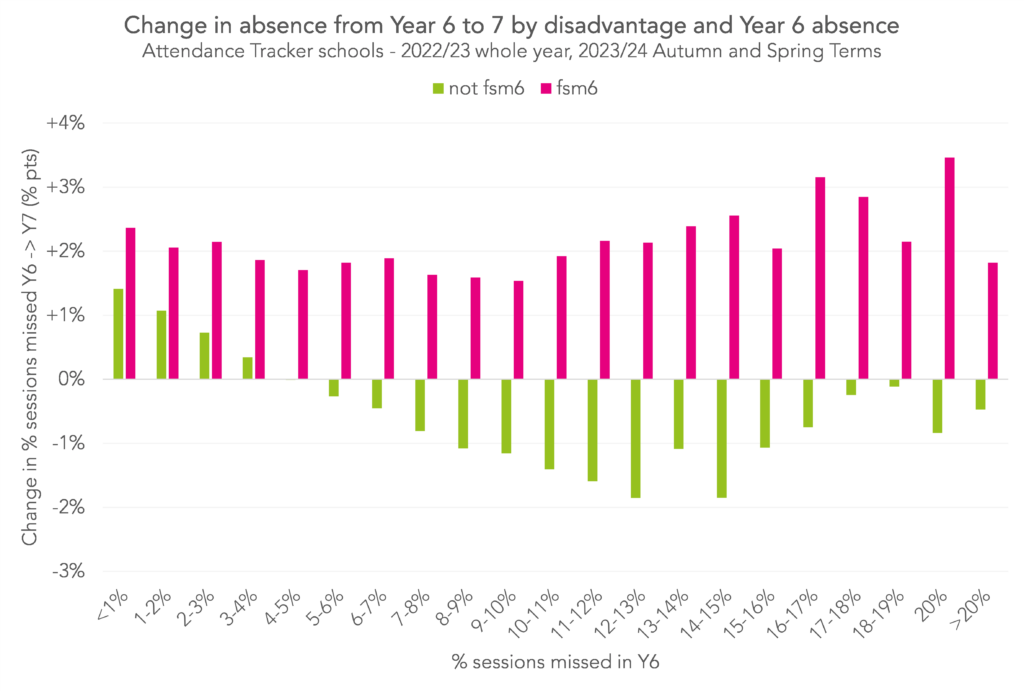
We can also see that pupils with the lowest absence rates in Year 6 tended to see their absence increase in Year 7 whether they were disadvantaged or not (albeit disadvantaged pupils saw bigger increases than non-disadvantaged pupils). But among pupils with higher absence rates, disadvantaged pupils tended to see further increases in Year 7, while non-disadvantaged pupils tended to see falls.
We can see this pattern more clearly by plotting the average change in absence between Year 6 and 7 by Year 6 absence rate and disadvantage.
Patterns of absence
This implies that the disproportionate increase in absence experienced by disadvantaged pupils isn’t solely down to the amount of absence they experienced in Year 6. So let’s turn to their patterns of absence.
We’ve seen before that persistently absent pupils with the same overall absence rates are more likely to stay persistently absent if they’d had lots of short spells of absence than if they’d had one or two longer spells.
Perhaps disadvantaged pupils tended to be off more frequently than other pupils, even if they had the same overall rates of absence.
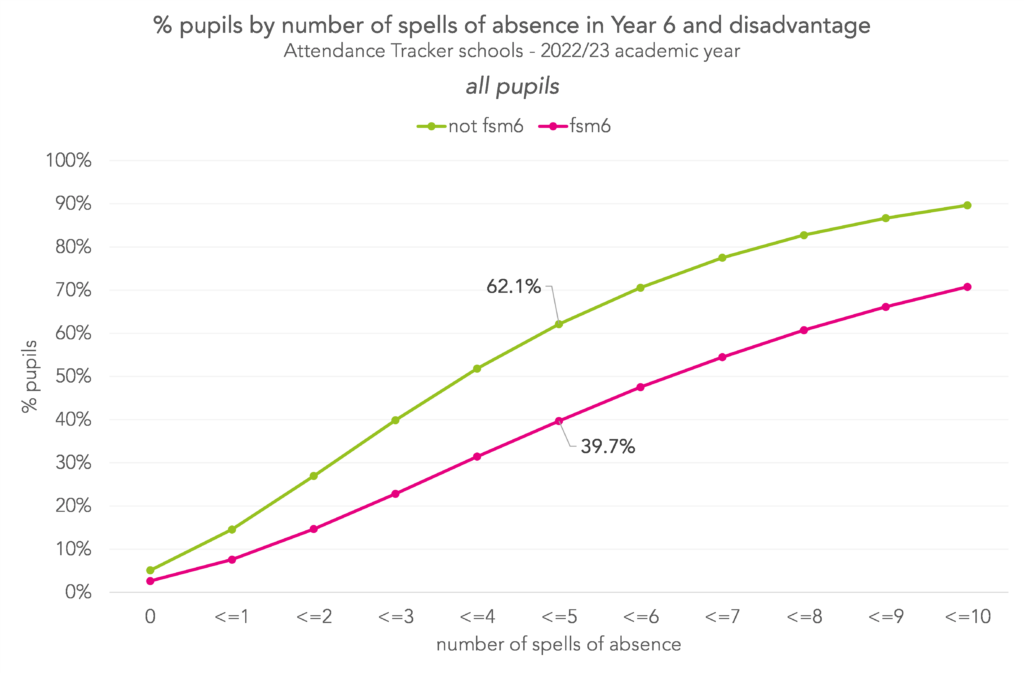
To explore this, let’s plot the percentage of pupils by the number of spells of absence they had in Year 6, split by disadvantage. Firstly, for all pupils:
and for pupils with similar rates of absence:
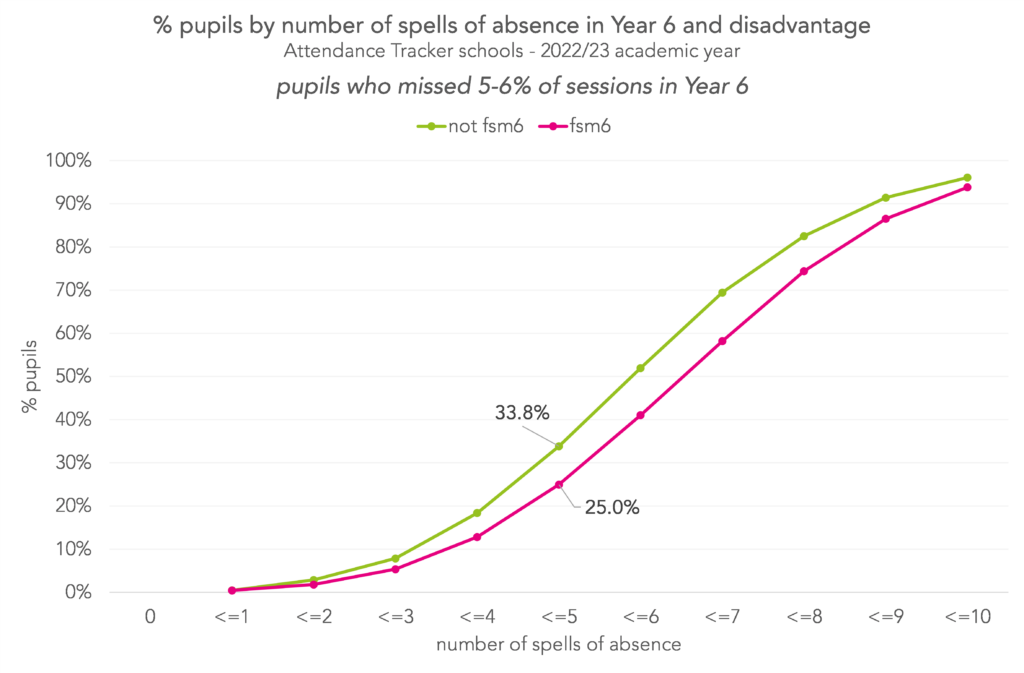
Overall, disadvantaged pupils tended to have more spells of absence than other pupils in Year 6. For example, while around 40% of non-disadvantaged pupils were off six times or more, this was true for 60% of disadvantaged pupils.
This relationship still exists, though is less pronounced, when we look at pupils with similar rates of absence. Among those who missed 5-6% of sessions in Year 6, around 66% of non-disadvantaged pupils were off six or more times compared with 75% of disadvantaged pupils.
Putting it all together
So disadvantaged pupils had higher absence rates than their peers in Year 6, and they also tended to be off more frequently. But how much did each of these factors contribute to the observed difference in Year 7 absence rates?
To find out, we decompose[2] the difference in Year 7 absence rates between disadvantaged pupils and their peers into the following components:
- One related to disadvantaged pupils having had higher absence rates in Year 6,
- One related to disadvantaged pupils having had more spells of absence in Year 6, and
- One not related to either of those things.
Doing this tells us that around two thirds of the difference is related to differences in Year 6 absence rates and numbers of spells, with the remaining third not related to either.
Within the two thirds explained by differences in Year 6 absence rates and spells, around half is explained by absence rates, and around half by numbers of spells.
Summing up
Absence rates among disadvantaged pupils increased by more between Year 6 and Year 7 than absence rates among their non-disadvantaged peers. For the pupils in our sample, the disadvantage gap in absence rates grew from 3.0pp in Year 6 to 4.8pp in Year 7.
The majority, around two-thirds, of the gap in Year 7 was related to pupils having different patterns of absence in Year 6. This underlines the importance of good data sharing practices at transition.
However, around a third of the difference was not related to differences in Year 6 absence patterns. Some of this may well be attributable to data we’ve not been able to include, such as pupils’ social care involvement or persistence of disadvantage. The rest will be related to things we can’t observe in the data, such as levels of parental support. This underlines the importance of the pastoral work done by transition teams.
Want to stay up-to-date with the latest research from FFT Education Datalab? Sign up to Datalab’s mailing list to get notifications about new blogposts, or to receive the team’s half-termly newsletter.
[1] We only include pupils where we observe them in their Year 6 school in July 2023, with at least 20 weeks of attendance data at that school in 2022/23, and in their Year 7 school in September 2023, with at least 10 weeks of attendance data at that school in 2023/24.
[2] Using a blinder-oaxaca decomposition – regressing Year 7 absence rate on number of spells and % absence in Year 6, with fsm6 as the grouping variable.


Kate, having interviewed/assessed year 7 pupils who begin to emerge as disruptive, arriving late, truanting lessons and days of school, these children eventually either stop attending school, or get a managed move or removal to an inclusion unit either on or off site. Every child I have interviewed/assessed expressed either:
1. Difficulties in relationships with teachers, so they stopped attending their lessons.
2. Difficulties accessing the universal curriculum offer, irrespective of KS2 scores of<80-120 in the cohort.
3. Majority have ACEs/and or SEND.
4. Many had a teaching assistant in primary, and not in secondary and could not keep up with the pace or demands of the curriculum.
Primary systems are better equipped to identify and meet a child's needs and remove barriers. Once children move to larger secondary, vulnerable children frequently get lost in the system when they enter year 7. Needs are not identified swiftly and every child is accessing the exact same curriculum sequence, often with a universal style pedagogy. This does not engage or support vulnerable children so they vote with their feet and stop attending school. These children have combined characteristics, not just FSM and therefore it increases their level of vulnerability.