In a previous blogpost, we examined how persistent absence might be measured in an era when absence rates are higher than pre-pandemic.
Our view was that it was important to look at the number of spells of absence alongside the rate of absence.
However, we noticed some errors in our calculations of number of spells. So, in this blog, we update our work.
We suggest a number of options for redefining persistent absence.
The first is to increase the threshold from 10% to 15%.
We then propose a simple “risk score” based on both absence rates and number of spells that is predictive of remaining a persistent absentee.
Data
The data we’ll use comes from FFT Attendance Tracker. 2,800 secondary schools and 7,800 primary schools currently make use of the system.
We calculate rates of persistent absence (based on being absent for 10% of sessions or more) for the Autumn term, Spring term and Autumn and Spring terms combined for 2022/23.
We also calculate the number of spells of absence for each pupil. These are continuous periods of time during which a pupil was absent from school. You can read more about this here.
The impact of disadvantage
Firstly, a recap of the persistent absence rates by disadvantage.

Persistent absence rates were lower in Spring than in Autumn. Disadvantaged pupils were about twice as likely to be persistent absentees as other pupils.
Curious readers might note that the “Autumn and Spring” bar in the chart above exceeds the “Autumn” bar for disadvantaged pupils in secondary schools.
This is because persistent absence calculations are based on enrolments rather than pupils. For example, a pupil who attended one school in Autumn and another school in Spring would be counted as two enrolments (one at each school).
What we find is that 7% of persistent absentees in Autumn were not on roll in Spring (across all groups). These enrolments would be in the numerator and denominator for Autumn (and Autumn and Spring combined) but not Spring.
Overall, we find that 19% of primary age pupils and 27% of secondary age pupils missed 10% or more sessions in the Autumn and Spring term combined. However, our figures for the Autumn term are a percentage point higher than published DfE statistics (sourced from School Census rather than schools’ management information systems).
Reasons for absence
Illness is the underlying reason for absence for the majority of persistent absentees.
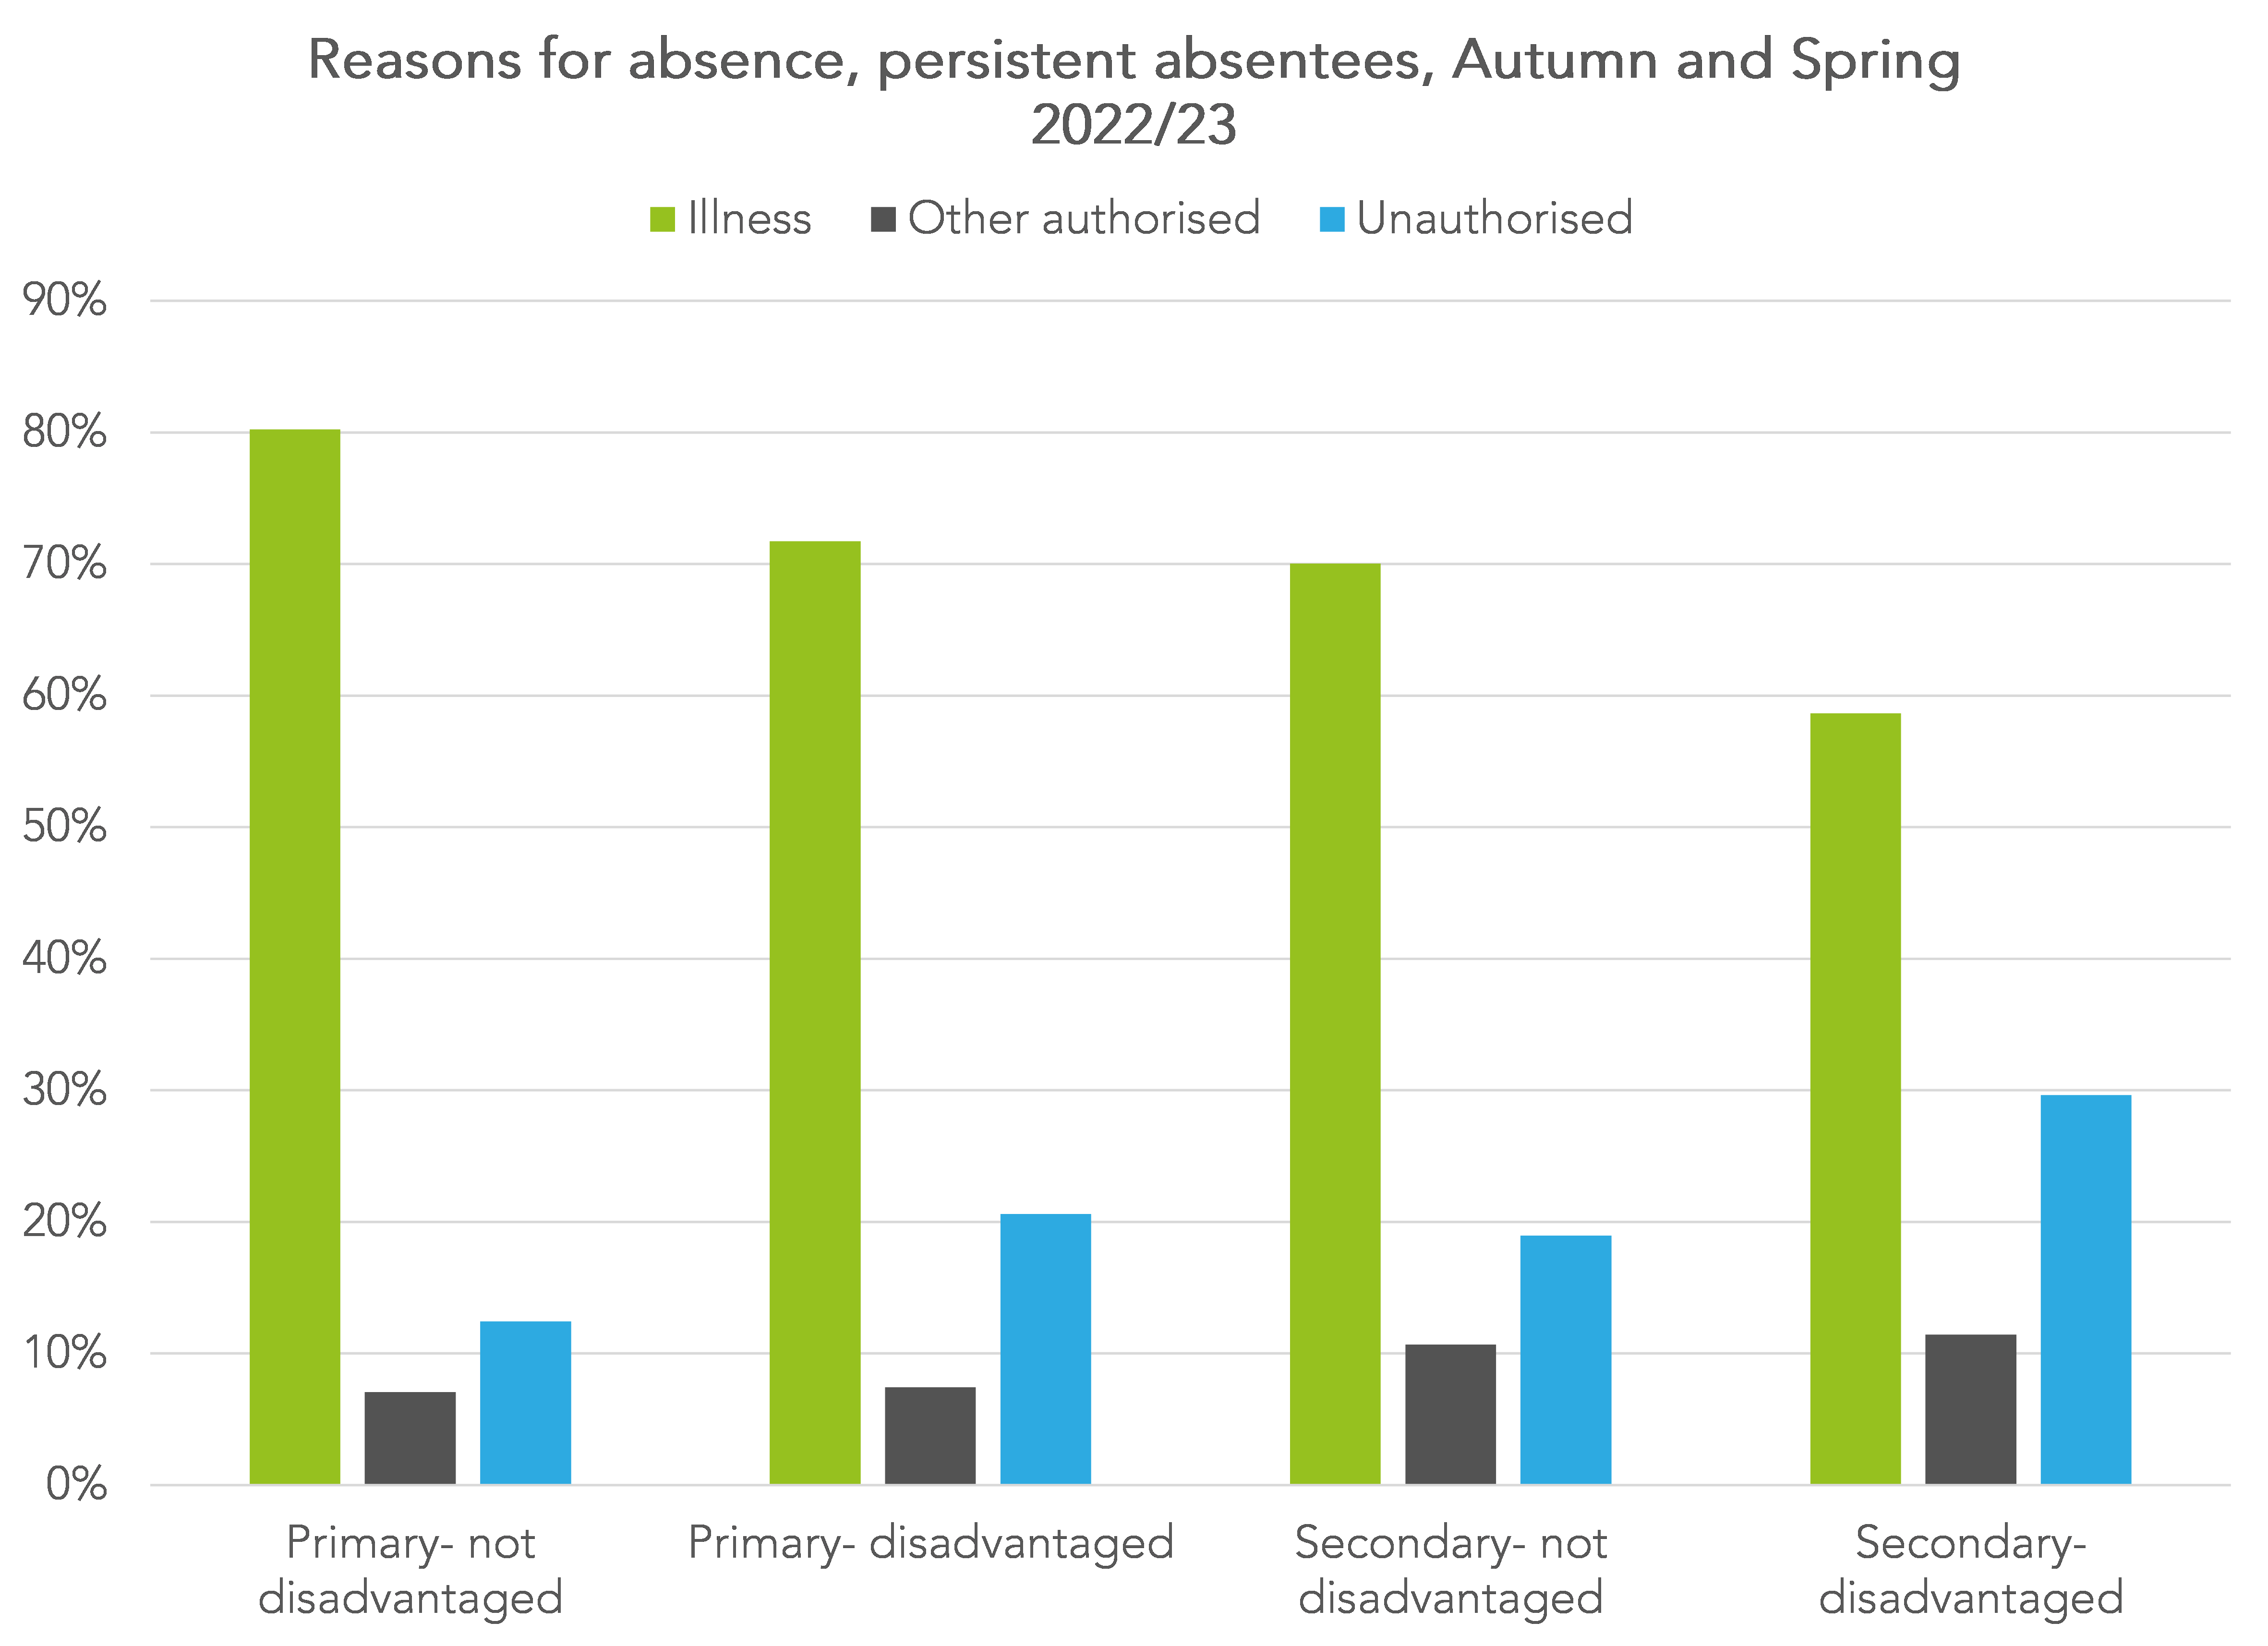
However, unauthorised absence is more of a factor for disadvantaged pupils, particularly in the secondary phase.
Predicting persistent absence
The propensity to be persistently absent in the Spring term is associated with absence rates in the Autumn term as the following chart shows.
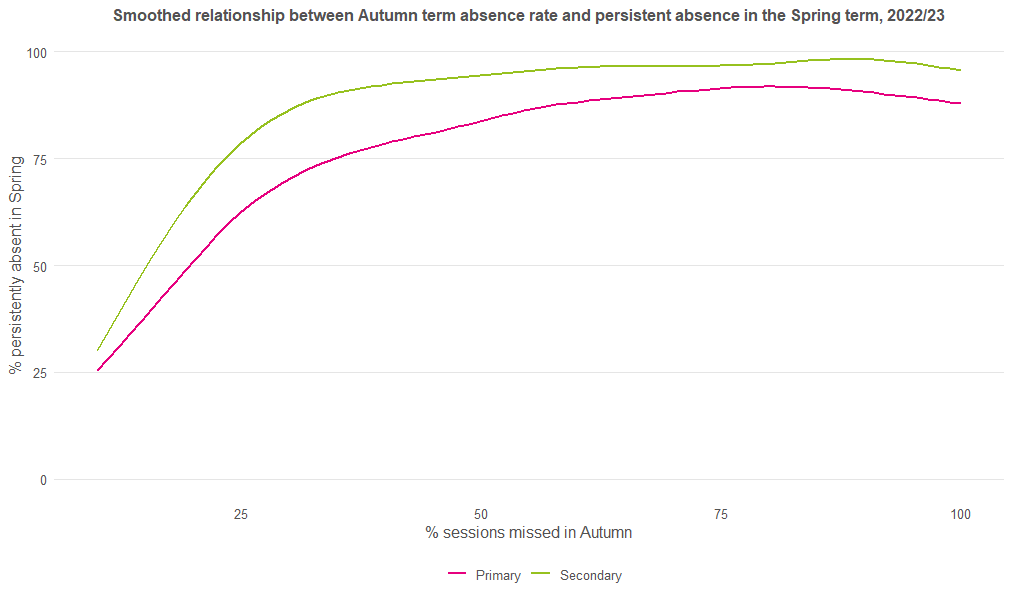
The risk of remaining a persistent absentee in Spring increases with Autumn term absence rate. This increases sharply for pupils with 10% to 25% absence. Around 90% of secondary age pupils with an Autumn term absence rate of 40% or more remained a persistent absentee in Spring.
It is worth reminding ourselves here that schools are taking action to improve attendance. Without this, Autumn term absence rates and the percentage of Spring term persistent absentees could have been even higher.
Spells of absence
Propensity to remain persistently absent also increases with the number of spells of absence. In the chart below, we look at pupils with an absence rate between 10-11% in the Autumn term (so those who were “only just” a persistent absentee).
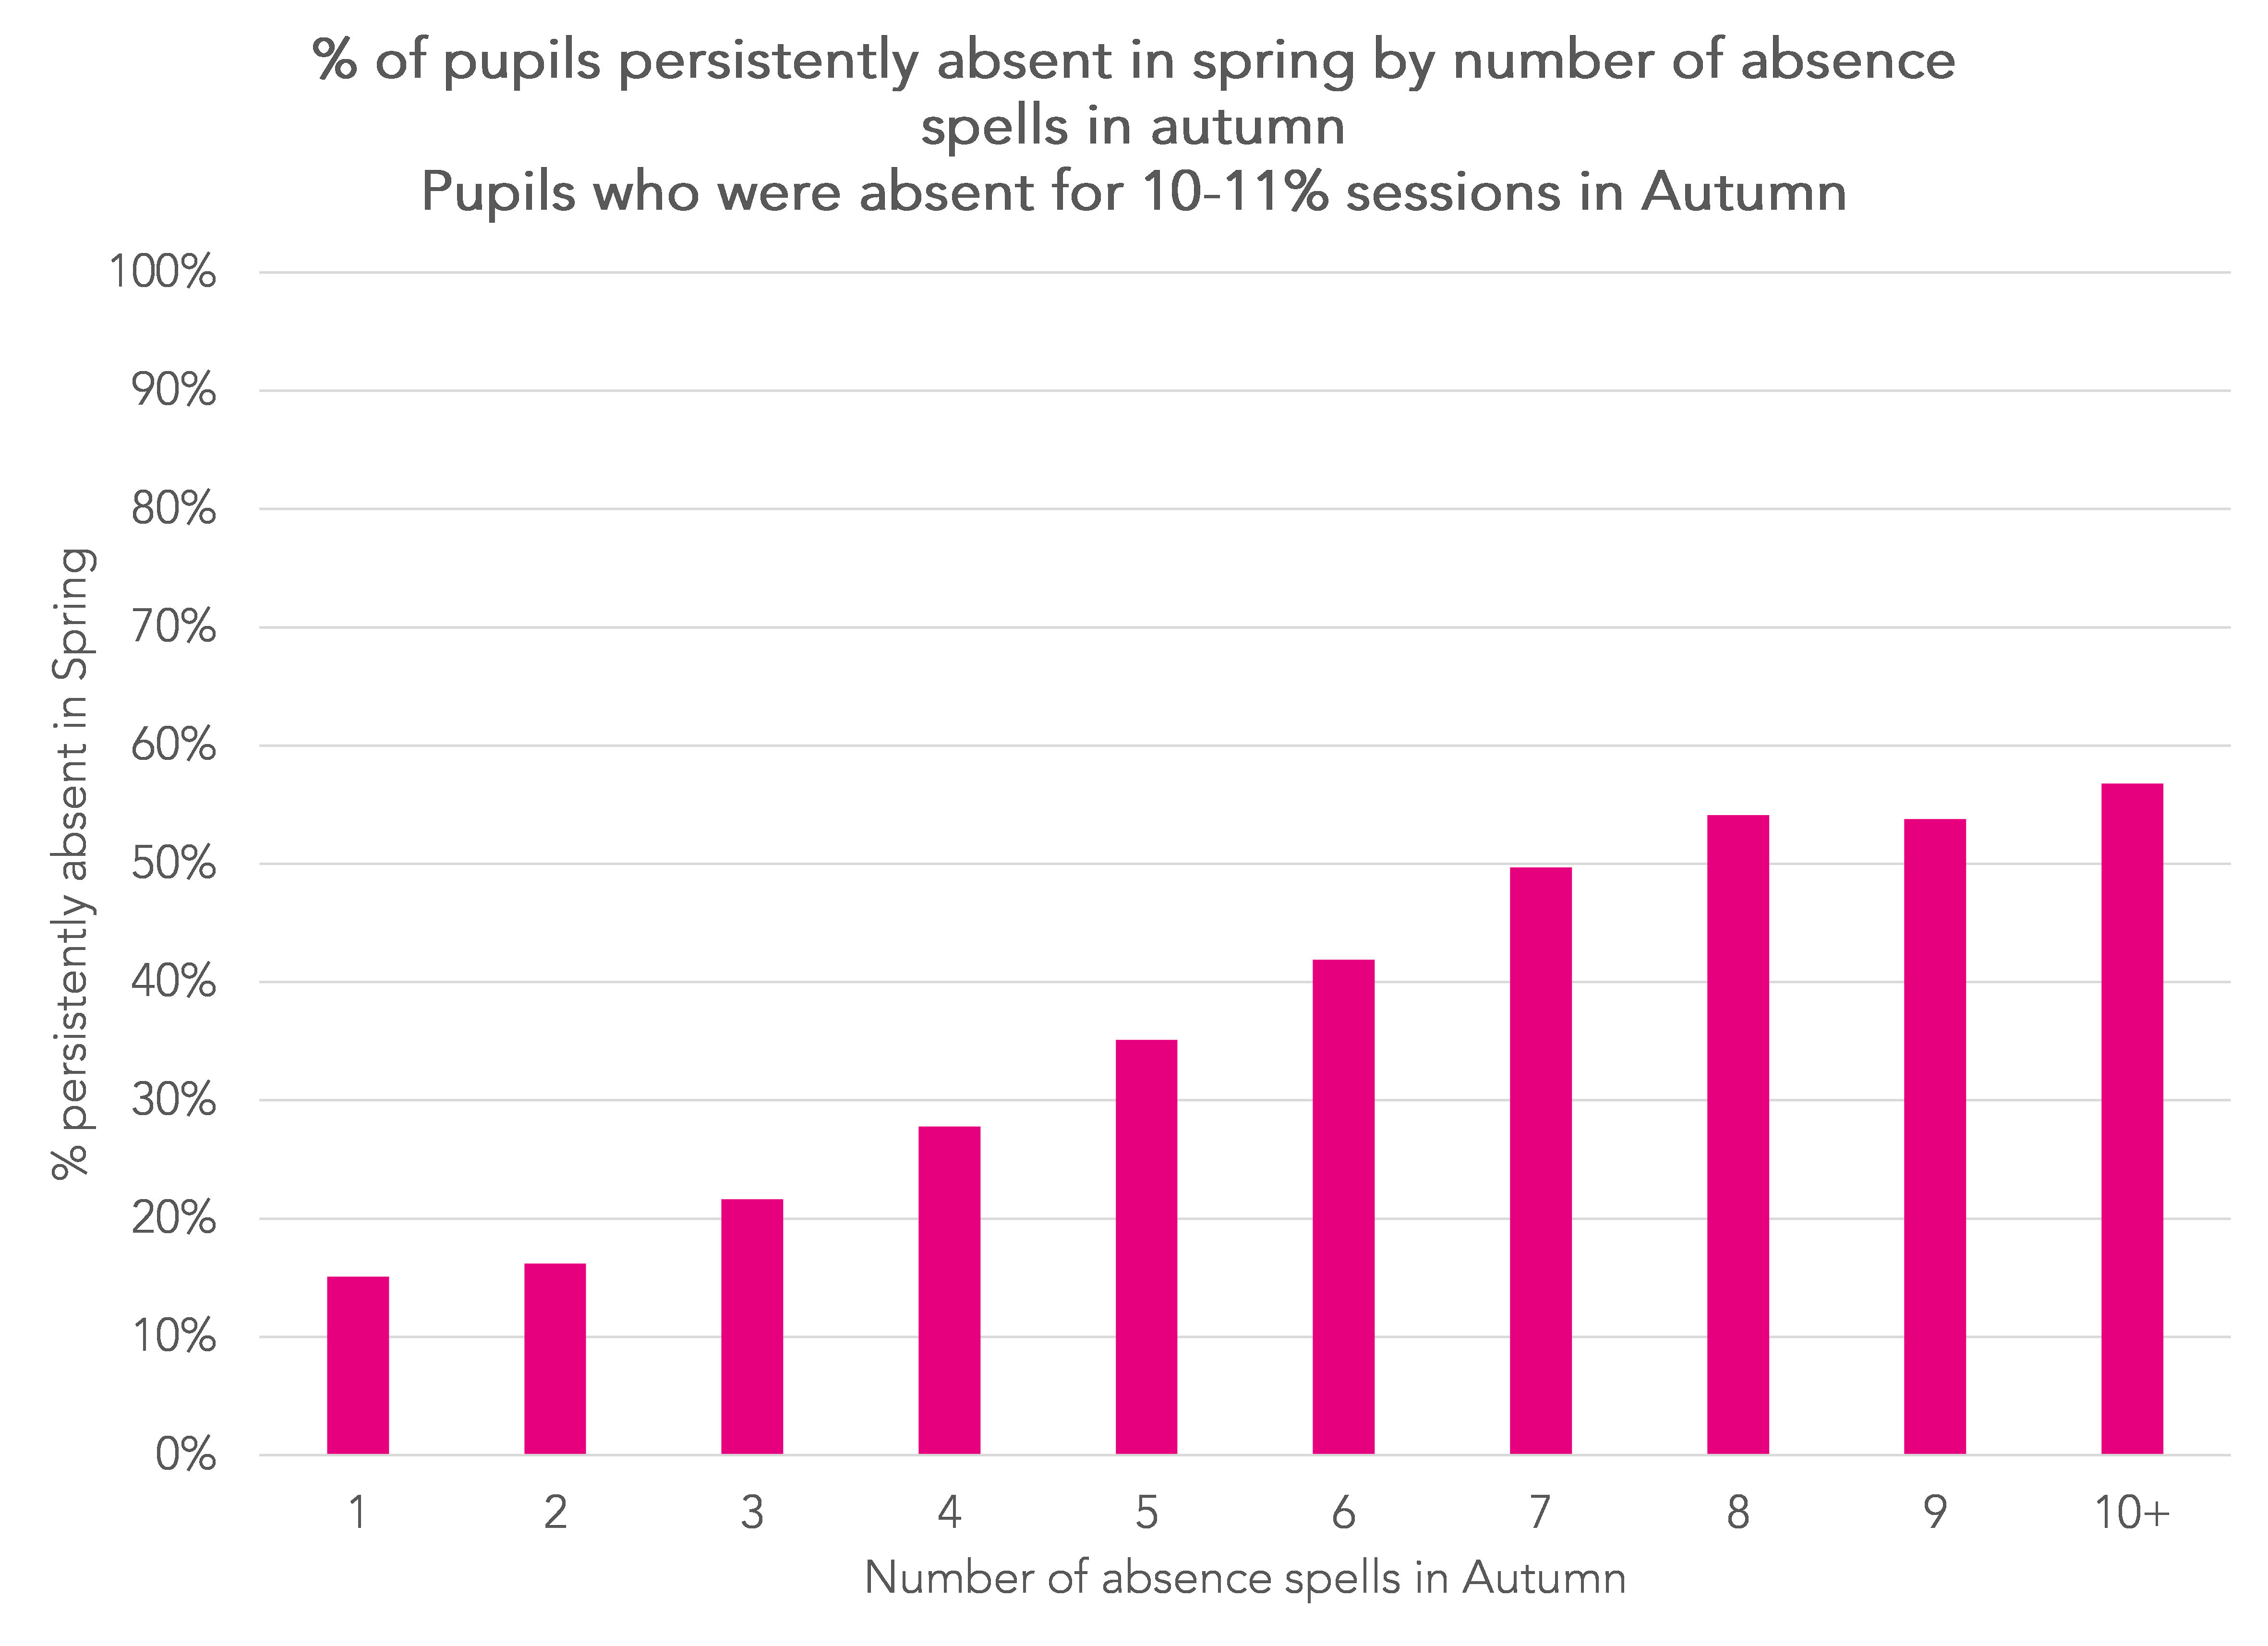
The more spells of absence in the Autumn, the higher the probability of being persistently absent in Spring. More than 50% of pupils with an Autumn term absence rate of 10-11% but with 7 or more spells of absence were persistently absent in the Spring.
Hence it is important to look at number of spells as well as the absence rate.
Pupils who weren’t persistently absent in Autumn
Up to now we’ve just looked at pupils who were persistently absent in the Autumn.
But even among pupils who weren’t persistent absentees in the Autumn, there is a risk of becoming a persistent absentee in the Spring as the following chart shows.

20% of secondary-aged disadvantaged pupils who were not persistently absent in the Autumn were persistently absent in the Spring. However, this rate falls to just over 10% when considering absence over both terms combined.
Equivalent figures for non-disadvantaged pupils were 11% and 4% respectively.
Again, the number of spells of absence is related to the risk of being persistently absent in the Spring (and for both terms combined).
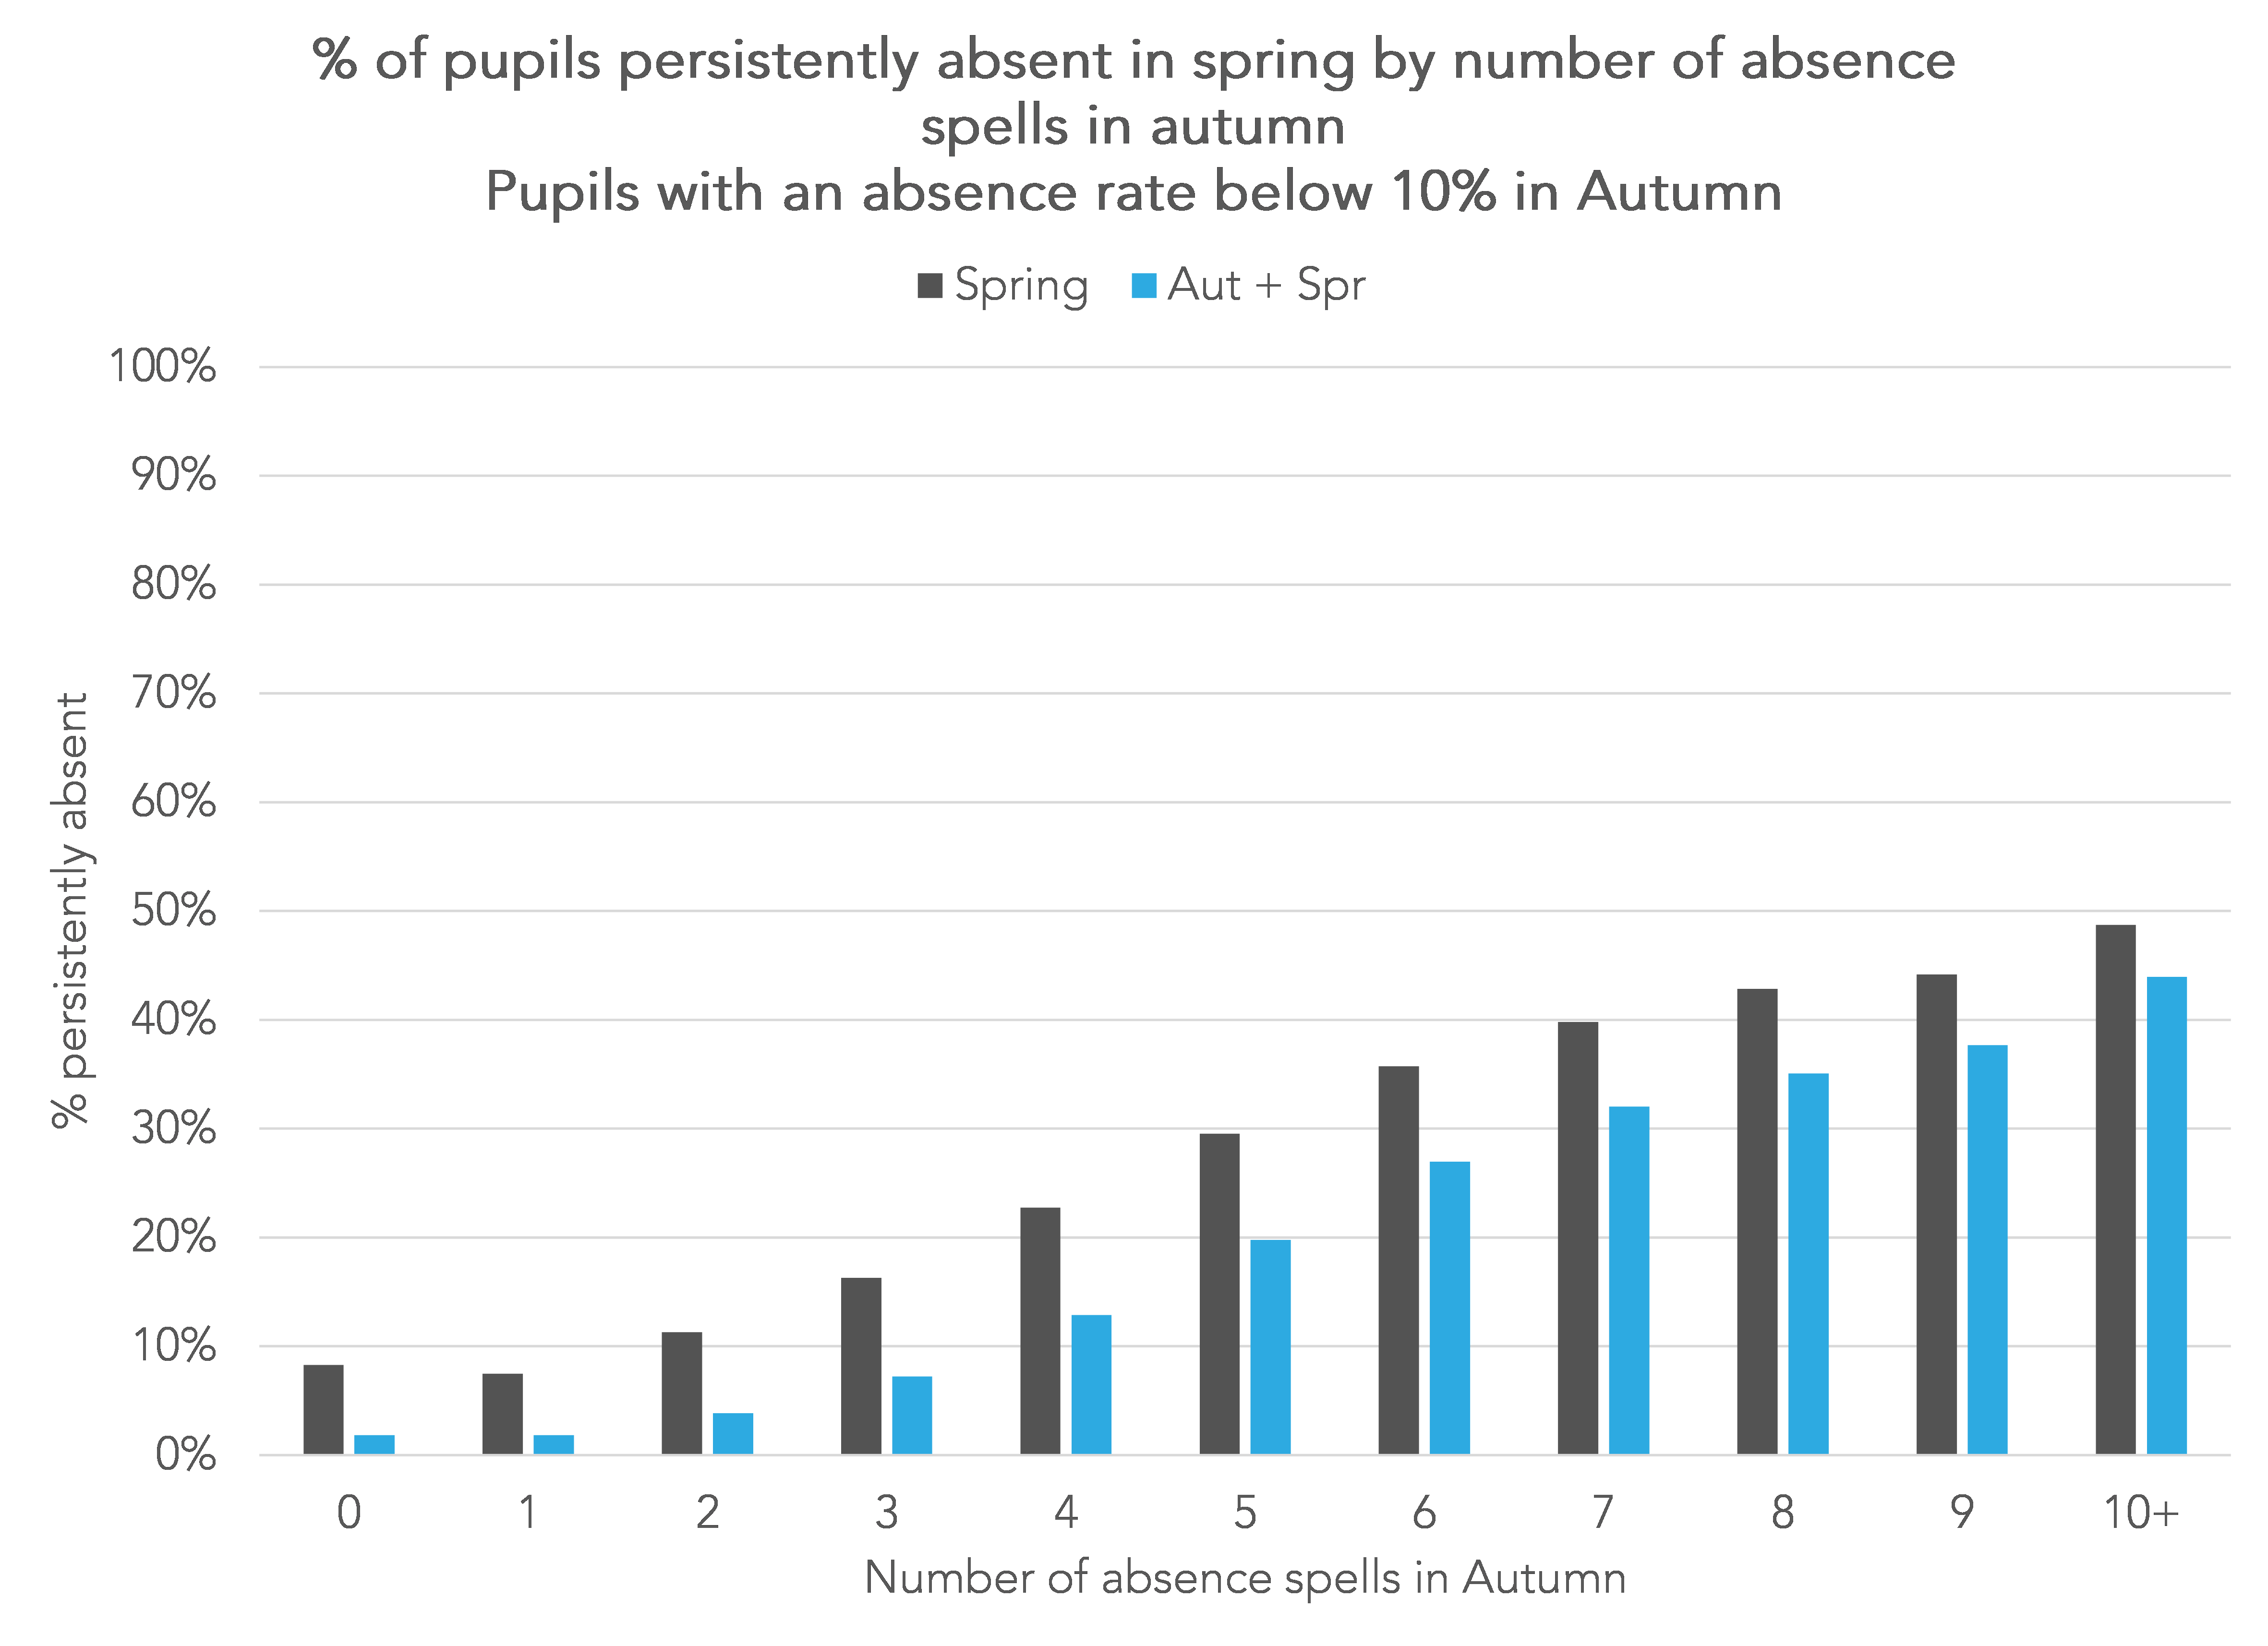
Even pupils without any spells of absence in the Autumn have a small risk of becoming persistently absent in the Spring.
Autumn term risk score
Finally, I’ve tried to calculate a “risk score” that combines information on the absence rate and number of spells of absence in the Autumn term.
It is defined as the percentage absence rate (rounded) plus the number of spells[1] multiplied by 3.
As the chart below shows, this is predictive of being persistently absent in Spring. Differences between the primary and secondary sector are modest.

50% of pupils with a risk score of 35 in the Autumn were persistently absent in Spring.
Summing up
The original persistent absence measure was introduced in 2005/06 and defined as missing 64 or more sessions. This was equivalent to around 20% of sessions for pupils on roll for the whole year. In those days, the overall absence rate, i.e. the probability of an average pupil being absent on any given day, was around 6.5%.
The persistent absence threshold was reduced to 56 sessions in 2010/11. Then it became the current measure based on 10% of sessions in 2015/16. By this time, the overall absence rate had fallen to 4.6%.
Maintaining the persistent absence threshold at 10% would at least ensure comparability with pre-pandemic times.
But we are now in an era affected by Covid-19 and its legacy where the overall absence rate is much higher: it stood at 7.5% in the Autumn term 2022/23 across all schools (and 8.8% in secondary schools) although we would expect figures for the full year to be slightly lower.
Therefore, perhaps the persistent absence measure should be redefined.
This begs the question of why we measure persistent absence. Is it just a statistical measure of how many pupils miss “a lot” of school? Or is it a way of identifying pupils who need additional support, leaving aside the important question of how practical that is in the current political and economic climate.
Raising the threshold to 15% would result in 9% of primary aged pupils and 16% of secondary aged pupils being classified as persistent absentees compared to 19% and 27% respectively based on the current 10% threshold (8% and 14% in 2019).
Adding in pupils with absence below 15% but who had missed more than 10 sessions (i.e. more than 5 per term on average) would increase those figures to 12% and 22% respectively.
Alternatively, we could use a “risk score” that combines absence rates and spells of absence. Based on absence in the Autumn term, 50% of pupils with a risk score of 40 (or above) were persistently absence in Spring.
If we were to use this as a threshold for the Autumn and Spring combined[2] then 7% of primary-aged and 16% of secondary-aged pupils would be classified as persistently absent.
- This number is capped at 10. The multiplier (3) was chosen as it placed number of spells on a common scale with persistent absence such that the risk of persistent absence in the spring was similar for both measures, e.g. pupils with an absence rate of 30% had a similar risk as pupils 10 spells of absence.
- When spells across one or more terms are counted, we first work out the average number of spells per term
Want to stay up-to-date with the latest research from FFT Education Datalab? Sign up to Datalab’s mailing list to get notifications about new blogposts, or to receive the team’s half-termly newsletter.


Leave A Comment