Here at Datalab, we’re nothing if not innovative.[1] And so when we heard about some recent work from researchers at the University of Glasgow that uses the new (to us) method of latent class analysis to explore links between attainment, exclusions and attendance in Scotland, we thought we’d see what insights it could offer us into low attaining Key Stage 4 pupils in England.
Data and methodology
Latent class analysis is a way of identifying groups of people with similar characteristics or behaviour. It assumes that people fall into distinct groups that can be identifying by looking at the patterns that we can observe in these characteristics or behaviour. This can be more helpful than looking at every possible combination of your variables of interest: when you’re looking at a lot of variables with a lot of different possible values, you’ll end up with a huge number of possible combinations. And that is impractical to analyse.
We will be using latent class analysis to group pupils based on their absence levels, history of suspensions, whether they’ve been identified as being in need, and their prior attainment at Key Stage 2. We chose not to include demographics here because we’re interested in seeing whether grouping pupils based on the aforementioned variables leads to groups that are well- or poorly-balanced in terms of characteristics like gender, disadvantage and SEN.
We will focus on pupils who completed Key stage 4 in 2023 and use data from the National Pupil Database, including the exclusions and absence tables, CIN and CLA tables, pupil census and Key Stage 4 pupil and exam tables.
The latent classes
The first problem when doing analysis that aims to put people into groups is deciding how many groups there ought to be. With latent class analysis, you can do this by using a combination of model fit statistics and / or your own knowledge of the data. Here, we decided on four classes based on model fit statistics.[2]
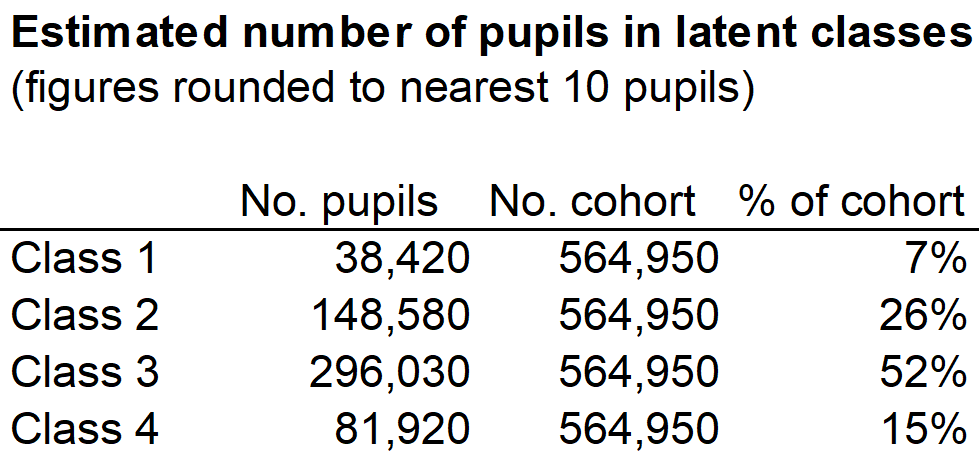
Pupils were not split evenly between the four classes: one of the classes forms quite a small percentage of the total cohort. This can be a cause for concern with this type of analysis but, in this case, we think it probably does reflect the data given that some of the factors we used to create the classes (suspensions, ever being in need) affect a relatively low proportion of pupils.
As we’re particularly interested in pathways into low attainment at KS4 here, let’s start by taking a look at the Key Stage 4 attainment of each of the classes. Here, we have put pupils into classes based on the predicted probability of class membership generated by the model.
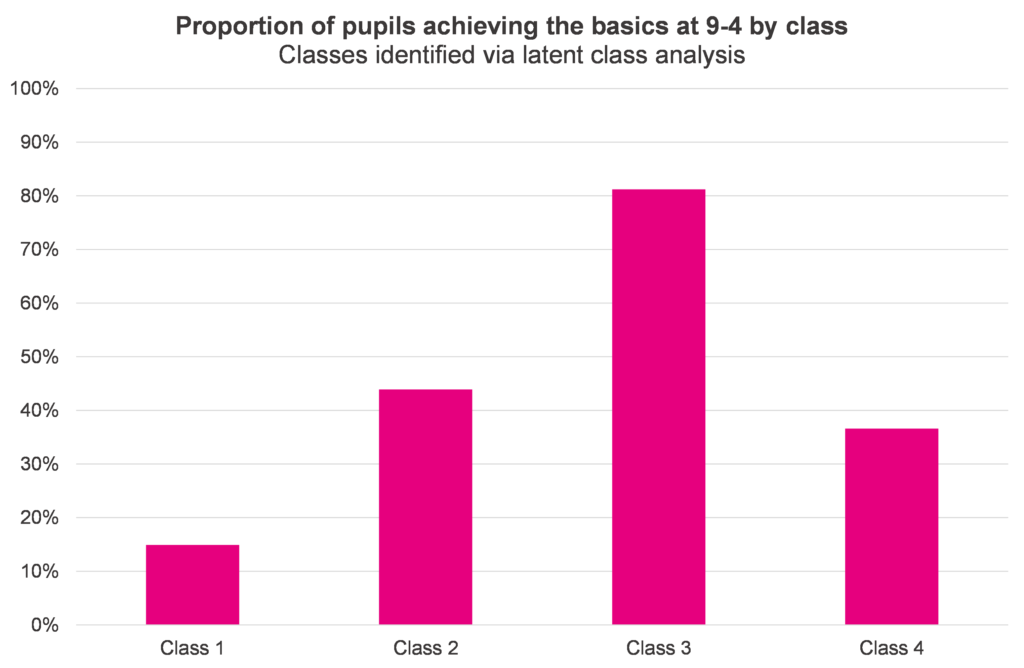
Just 15% of pupils in class 1 achieved the basics at 9-4, compared to an average of 66% across all classes. Classes 2 and 4 also had a below average proportion of pupils achieved the basics, while class 3 had a high proportion.
Now let’s see how the classes compare in terms of the variables that were used to create the classes.
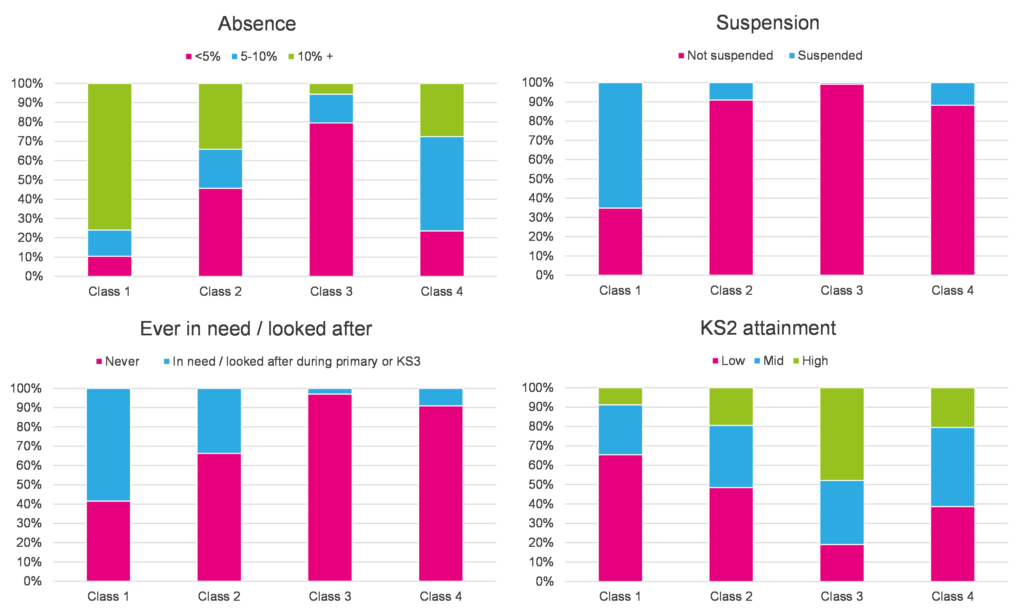
Class 1, the class most likely to have low attainment at KS4, included a high proportion of pupils who were persistently absent (i.e. missed at least 10% of sessions), suspended at least once, identified as being in need or looked after, and had low attainment at KS2. Class 3, the class least likely to have low KS4 attainment, were essentially the opposite.
Pupils in class 2 and 4 had a similar level of somewhat below average KS4 attainment. But despite this, these groups had some differences: pupils in class 4 were less likely to have been in need or looked after than those in class 2, and slightly less likely to have had low attainment at KS2. There were also some differences in absence rates. Pupils in class 2 were more likely to have missed fewer than 5% of sessions than those in class 4, and less likely to have missed between 5-10% of sessions.
Finally, we can look at how the classes compare in terms of some characteristics that we didn’t use when we created them.
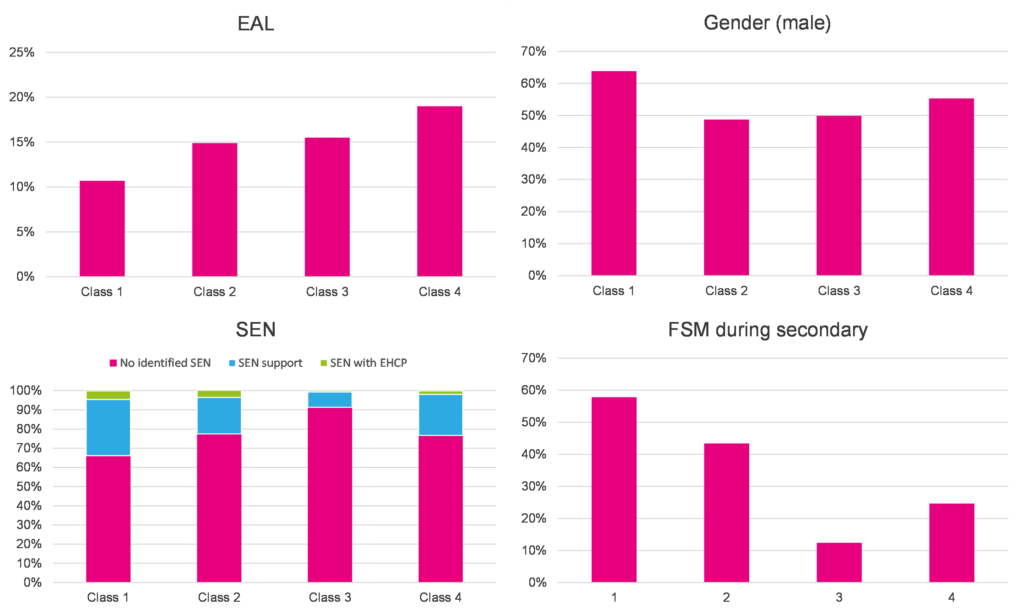
Class 1, the class associated with low KS4 attainment, includes a high proportion of male pupils, FSM pupils and pupils with an identified SEN, as well as a low proportion of EAL pupils. Class 3, the class least associated with low KS4 attainment, had a low proportion of pupils with an identified SEN or FSM, but an average proportion of male and EAL pupils.
Classes 2 and 4 are similar in terms of SEN pupils, but class 4 has a higher proportion of male and EAL pupils, and a lower proportion of FSM pupils than class 2. The proportions of EAL and FSM pupils are perhaps surprising given that the two classes has similar levels of KS4 attainment.
What have we learned?
You could argue that we’ve not learned much that’s new here. We’ve seen that pupils with high levels of absence, a history of suspensions or being in need, or low attainment at Key Stage 2 are more likely to have low attainment at Key Stage 4 than their peers. We could probably have predicted all that before we started, and we’ve written about links between some of these factors and low attainment before.
But we have perhaps learned something about how these factors can combine to form groups of pupils who are particularly at risk. One of the lower performing classes (class 4) included pupils who might not appear to be particularly at risk based on their KS2 attainment, history of suspensions and being in need or looked after, or being persistently absent. But pupils in this class were less likely than their peers to have missed fewer than 5% of sessions, and more likely to have missed between 5 and 10% of sessions.
So there does seem to be some evidence there to suggest that we shouldn’t overlook pupils who are missing substantial amounts of school, but not quite hitting the persistent absence threshold of 10% of sessions, even where there aren’t other obvious red flags. Some of those pupils may be at higher risk of low attainment than we might think.


Should this sentence say Class 3? “Class 4, the class least associated with low KS4 attainment, had a low proportion of pupils with an identified SEN or FSM, but an average proportion of male and EAL pupils.”
Quite right, thanks Amy! Now edited.
Thanks for posting this, and I’ll be having a go at using latent class analysis in my school. I do find that I can over analyse data and end up with too many potential areas to investigate and then support. Once I’ve settled with the four categories it’ll be something I can use to track across year on year as well, as specific areas in a cohort can skew one category once only in a year.
Thanks Rob. If it helps, I used the poLCA package in R and found this quite a helpful guide for getting started.
Thanks for this.
Over the last two years, I’ve been having a look at our own KS2 SATs, trying to see if there’s a commonality between students who didn’t get expected beyond the known barriers such as safeguarding, attendance, behaviour, etc. For us it showed that if you were a polite summer born girl, who just missed achieving their ELG in Reception and their phonics in Year 1, there was a high percentage of them not reaching the expected standard at the end of KS2.
Have you thought about looking at attainment v month of birth? The DfE data shows a correlation between month of birth and success in both phonics screening and maths times tables screening.
I can send you the graphs if you email me.
Thanks for the information, I’ve just found them, and I also found that I can sort using the DfE’s KS 2 Data herhttps://explore-education-statistics.service.gov.uk/find-statistics/key-stage-2-attainment
Being a junior school, identifying earlier those that have barriers is something we’re trying to get ahead on, as we have very little time before KS2 SATs compared to primaries.
Very interesting, especially the split in class 2 and class 4. I’m trying to think through a “description” of each class and why their KS4 attainment would be low. It got me wondering if you can split EAL by something like date of entry into the school system…I suspect pre-KS2 (or KS1) EAL would have different chances of high KS4 attainment? Or perhaps there’s a group of EAL pupils not eligible for FSM but dealing with similar levels of deprivation?
Anyway…fascinating!
PS – should the sentence “Classes 2 and 4 are similar in terms of SEN pupils, but class 4 has a higher proportion of male and EAL pupils, and a lower proportion of FSM pupils than class 4” end in “lower proportion of FSM pupils than class 2”?
Thanks Chris, especially for the proofreading! You’re right, now corrected. The consequences of a bit of last minute editing. Hopefully the post has all the classes straight now…
On the differences between classes 2 and 4, yes, either of these might be plausible I think. Splitting EAL by date of entry into the system is something we had a go at once before in this old post. We did find that EAL pupils who joined the system during KS2 tended to have v high P8, way above other EAL pupils, as you’d expect really, but I don’t think we got into how high their raw attainment (as opposed to progress) was. Food for thought!