In this post, we bring together some simple analysis of the relationship between attendance and attainment in primary schools last year using data we’ve collected from schools.
This follows on from a previous post in which we produced similar analysis using the full national dataset for 2018/19 collected by the Department for Education.
As always when we examine this relationship, we stress that attendance and attainment are associated but the relationship is not necessarily causal. Absence may be a contributory factor to low attainment but they also share some underlying root causes.
Data
We use attainment data collected from schools which participated in FFT’s Early Results Services this year. The number of schools participating was:
- 2,300 for end of Key Stage 1 (KS1)
- 2,450 for end of Key Stage 2 (KS2)
For each of the above, we select a summary headline indicator:
- % of pupils reaching the expected standard in reading, writing and maths at KS1
- % of pupils reaching the expected standard in reading, writing and maths at KS2
The data on attainment is then linked to pupil absence for the 2022/23 academic year.
Throughout the rest of the blog we refer back to our previous post in which we calculated similar statistics using the full national dataset for 2019 rather than data we collected. We make the caveat here that the data for 2023 is just based on data we collected, in other words we are comparing a (convenience) sample with the full population.
Absence rates for Years 2 and 6
The previous post showed absence rates for pupils nationally at the end of KS1 (Year 2) and end of KS2 (Year 6) in 2019.
The chart below shows similar data for pupils in our sample of schools.
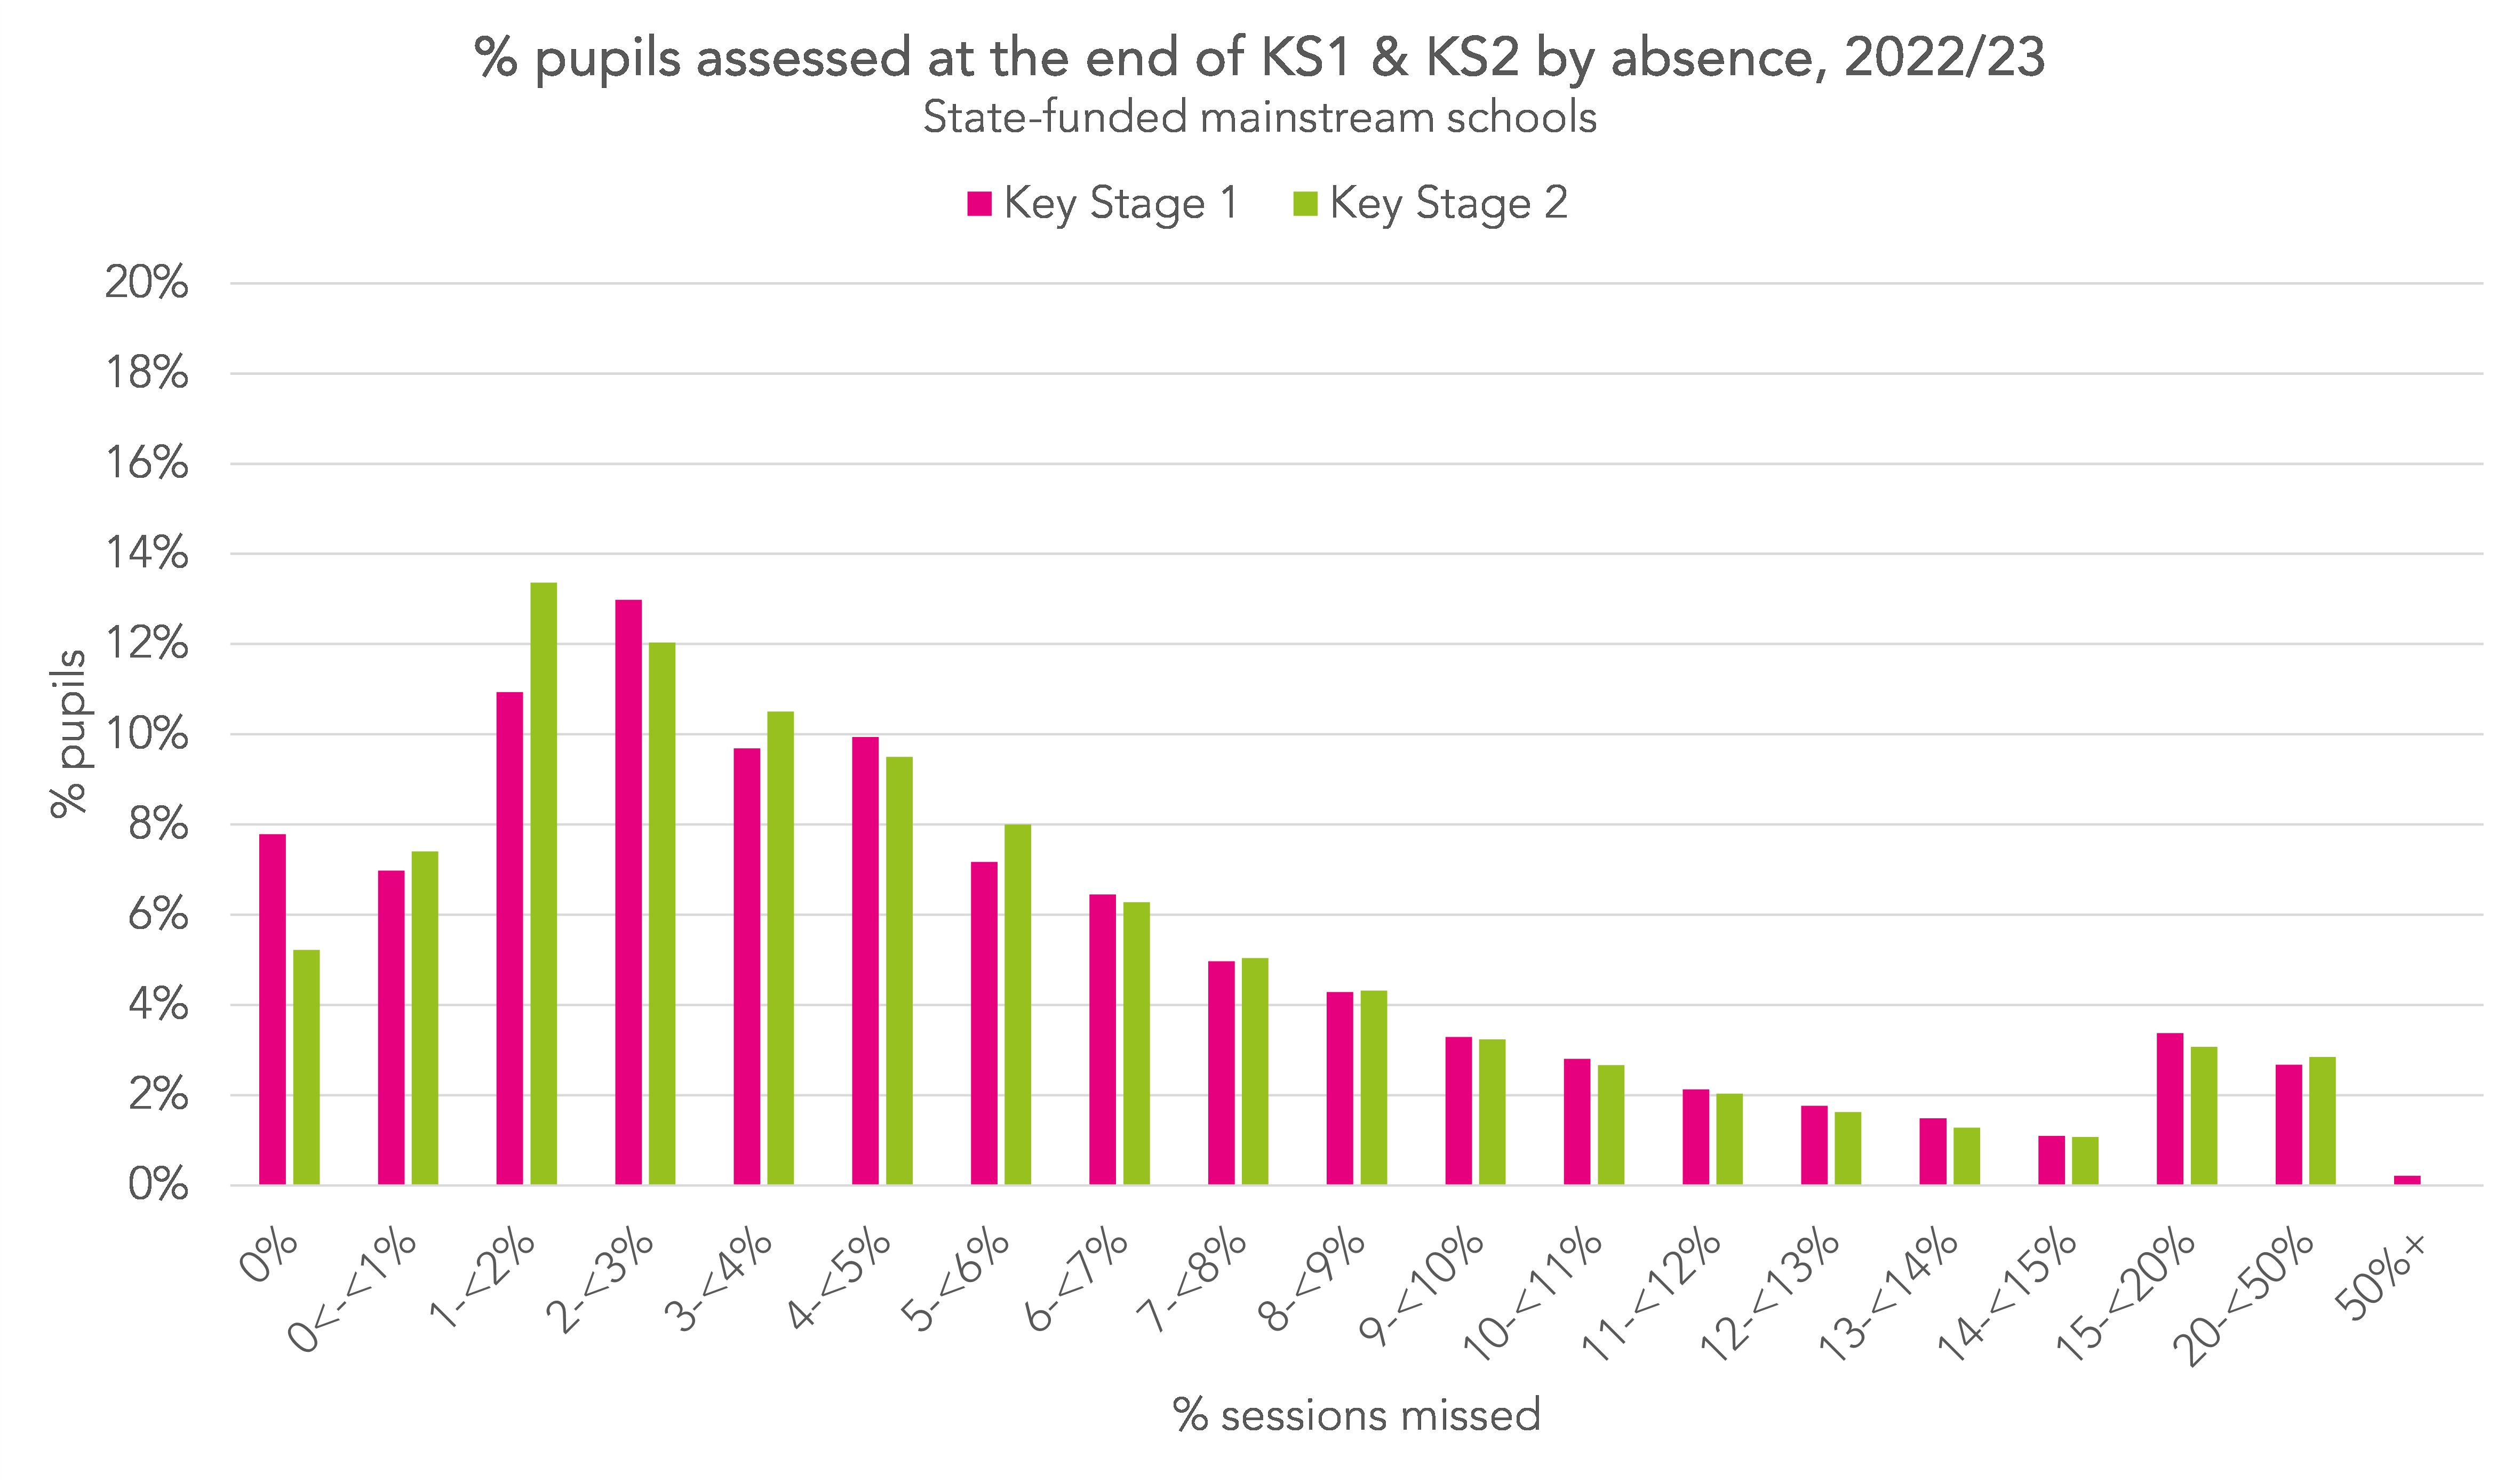
The modal (most common) absence rate is between 2% and 2.99% at KS1 and between 1% and 1.99% at KS2. 16% of pupils at KS1 and 15% of pupils at KS2 missed 10% or more sessions at KS1.
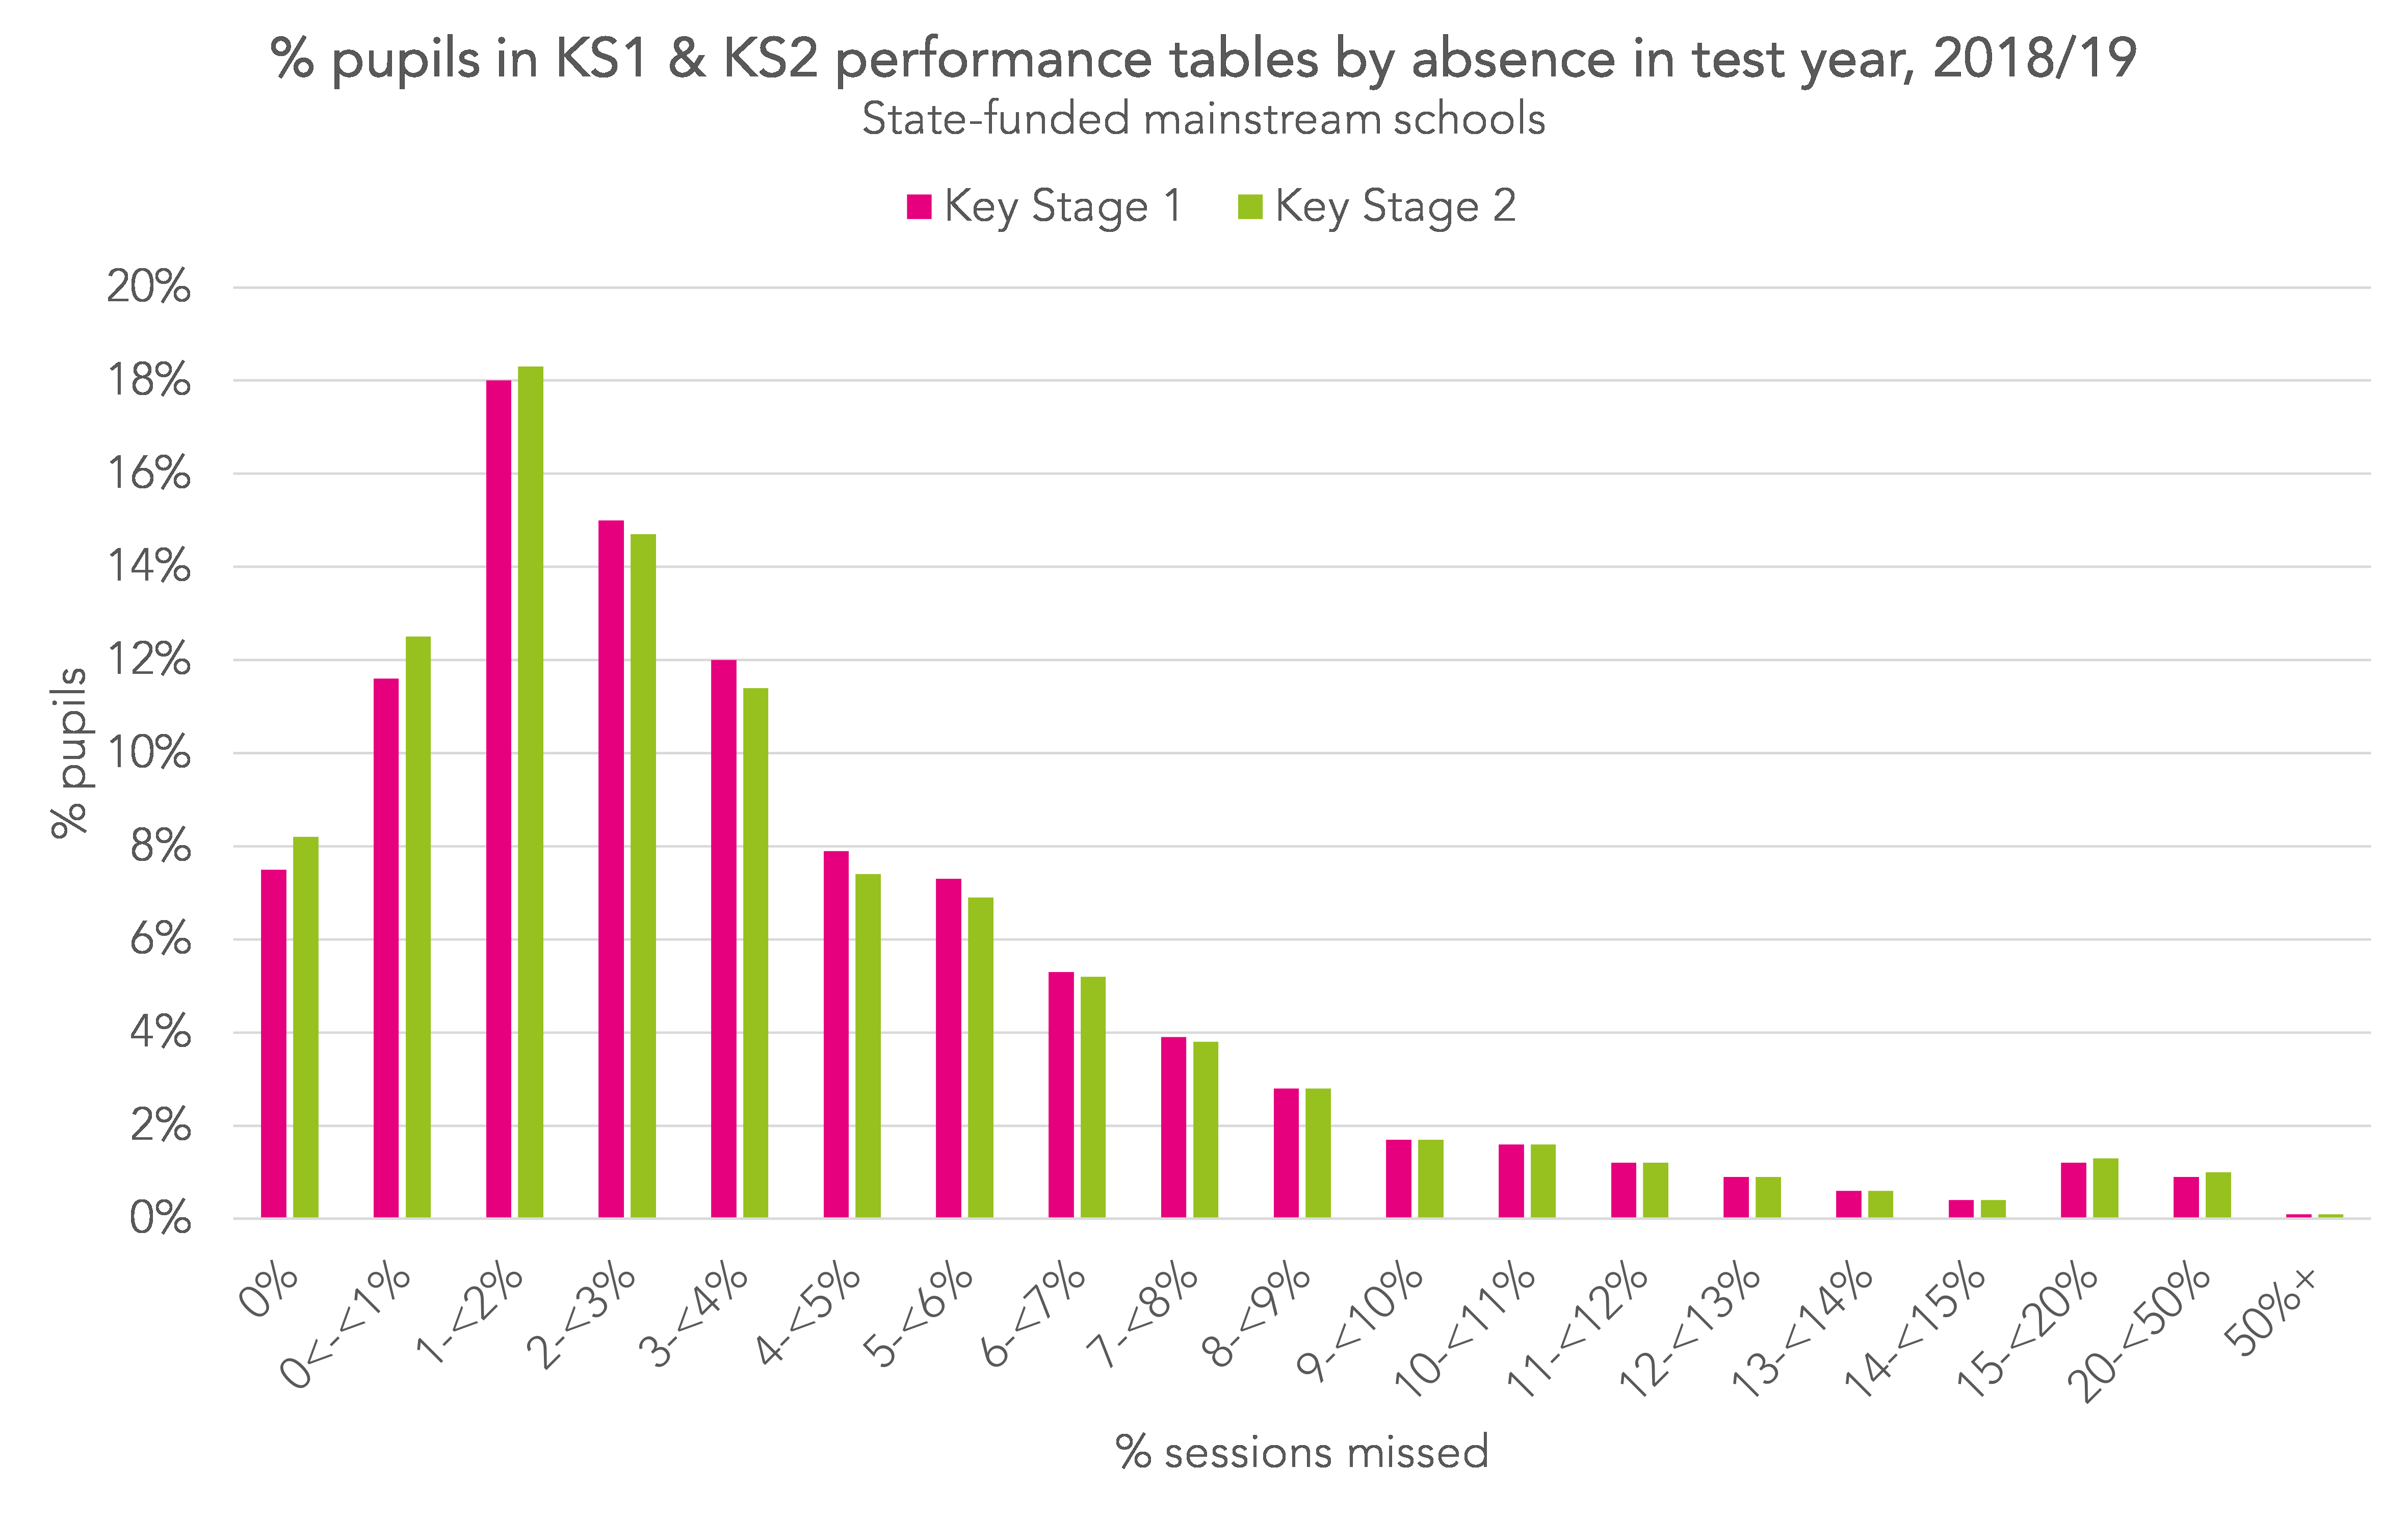
These values can be compared with those from 2019, which we have reproduced below. That year the modal absence rate was between 1% and 1.99% at both KS1 but note that the proportion of pupils with that level of absence was much higher than in 2023. 7% of pupils missed 10% or more sessions.
Key Stage 1
Now we show the relationship between absence and KS1 attainment.
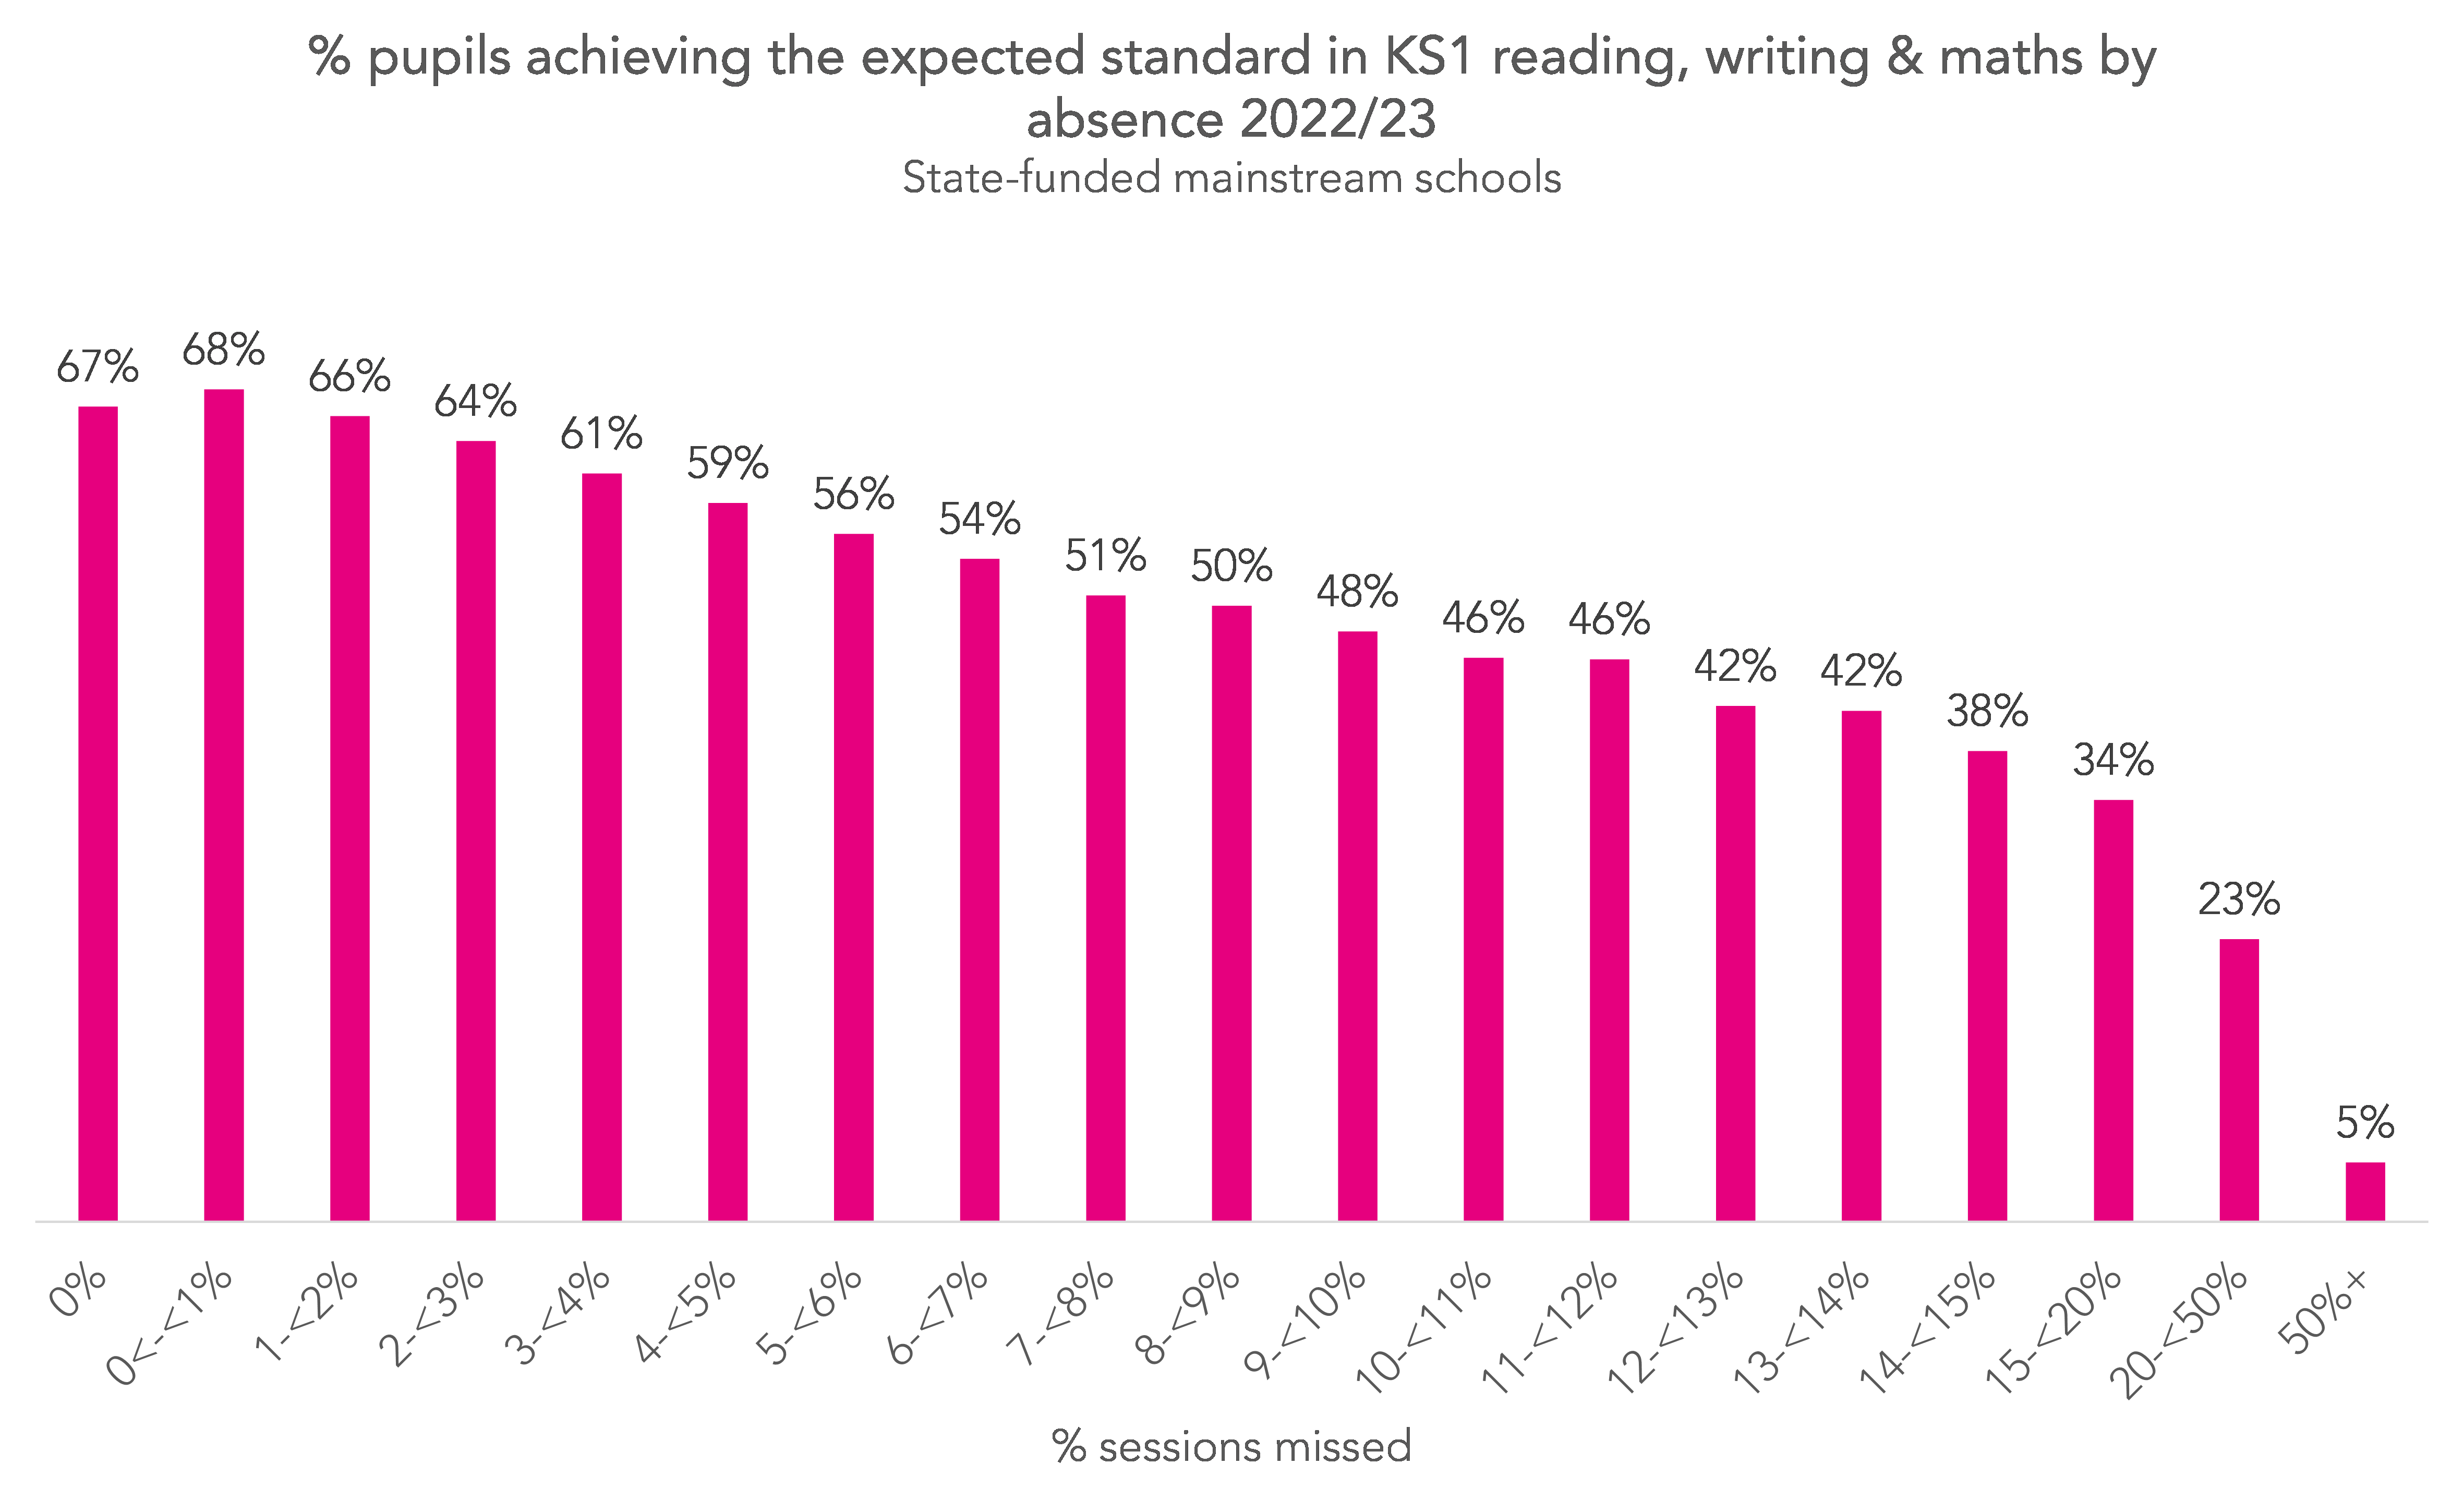
In general, attainment falls as absence increases. 67% of pupils without any absences achieved the expected standard in reading, writing and maths. This compares to 48% of those with an absence rate of between 9% and 9.99% (the pupils with the highest absence rates but who would not be classified as persistent absentees).
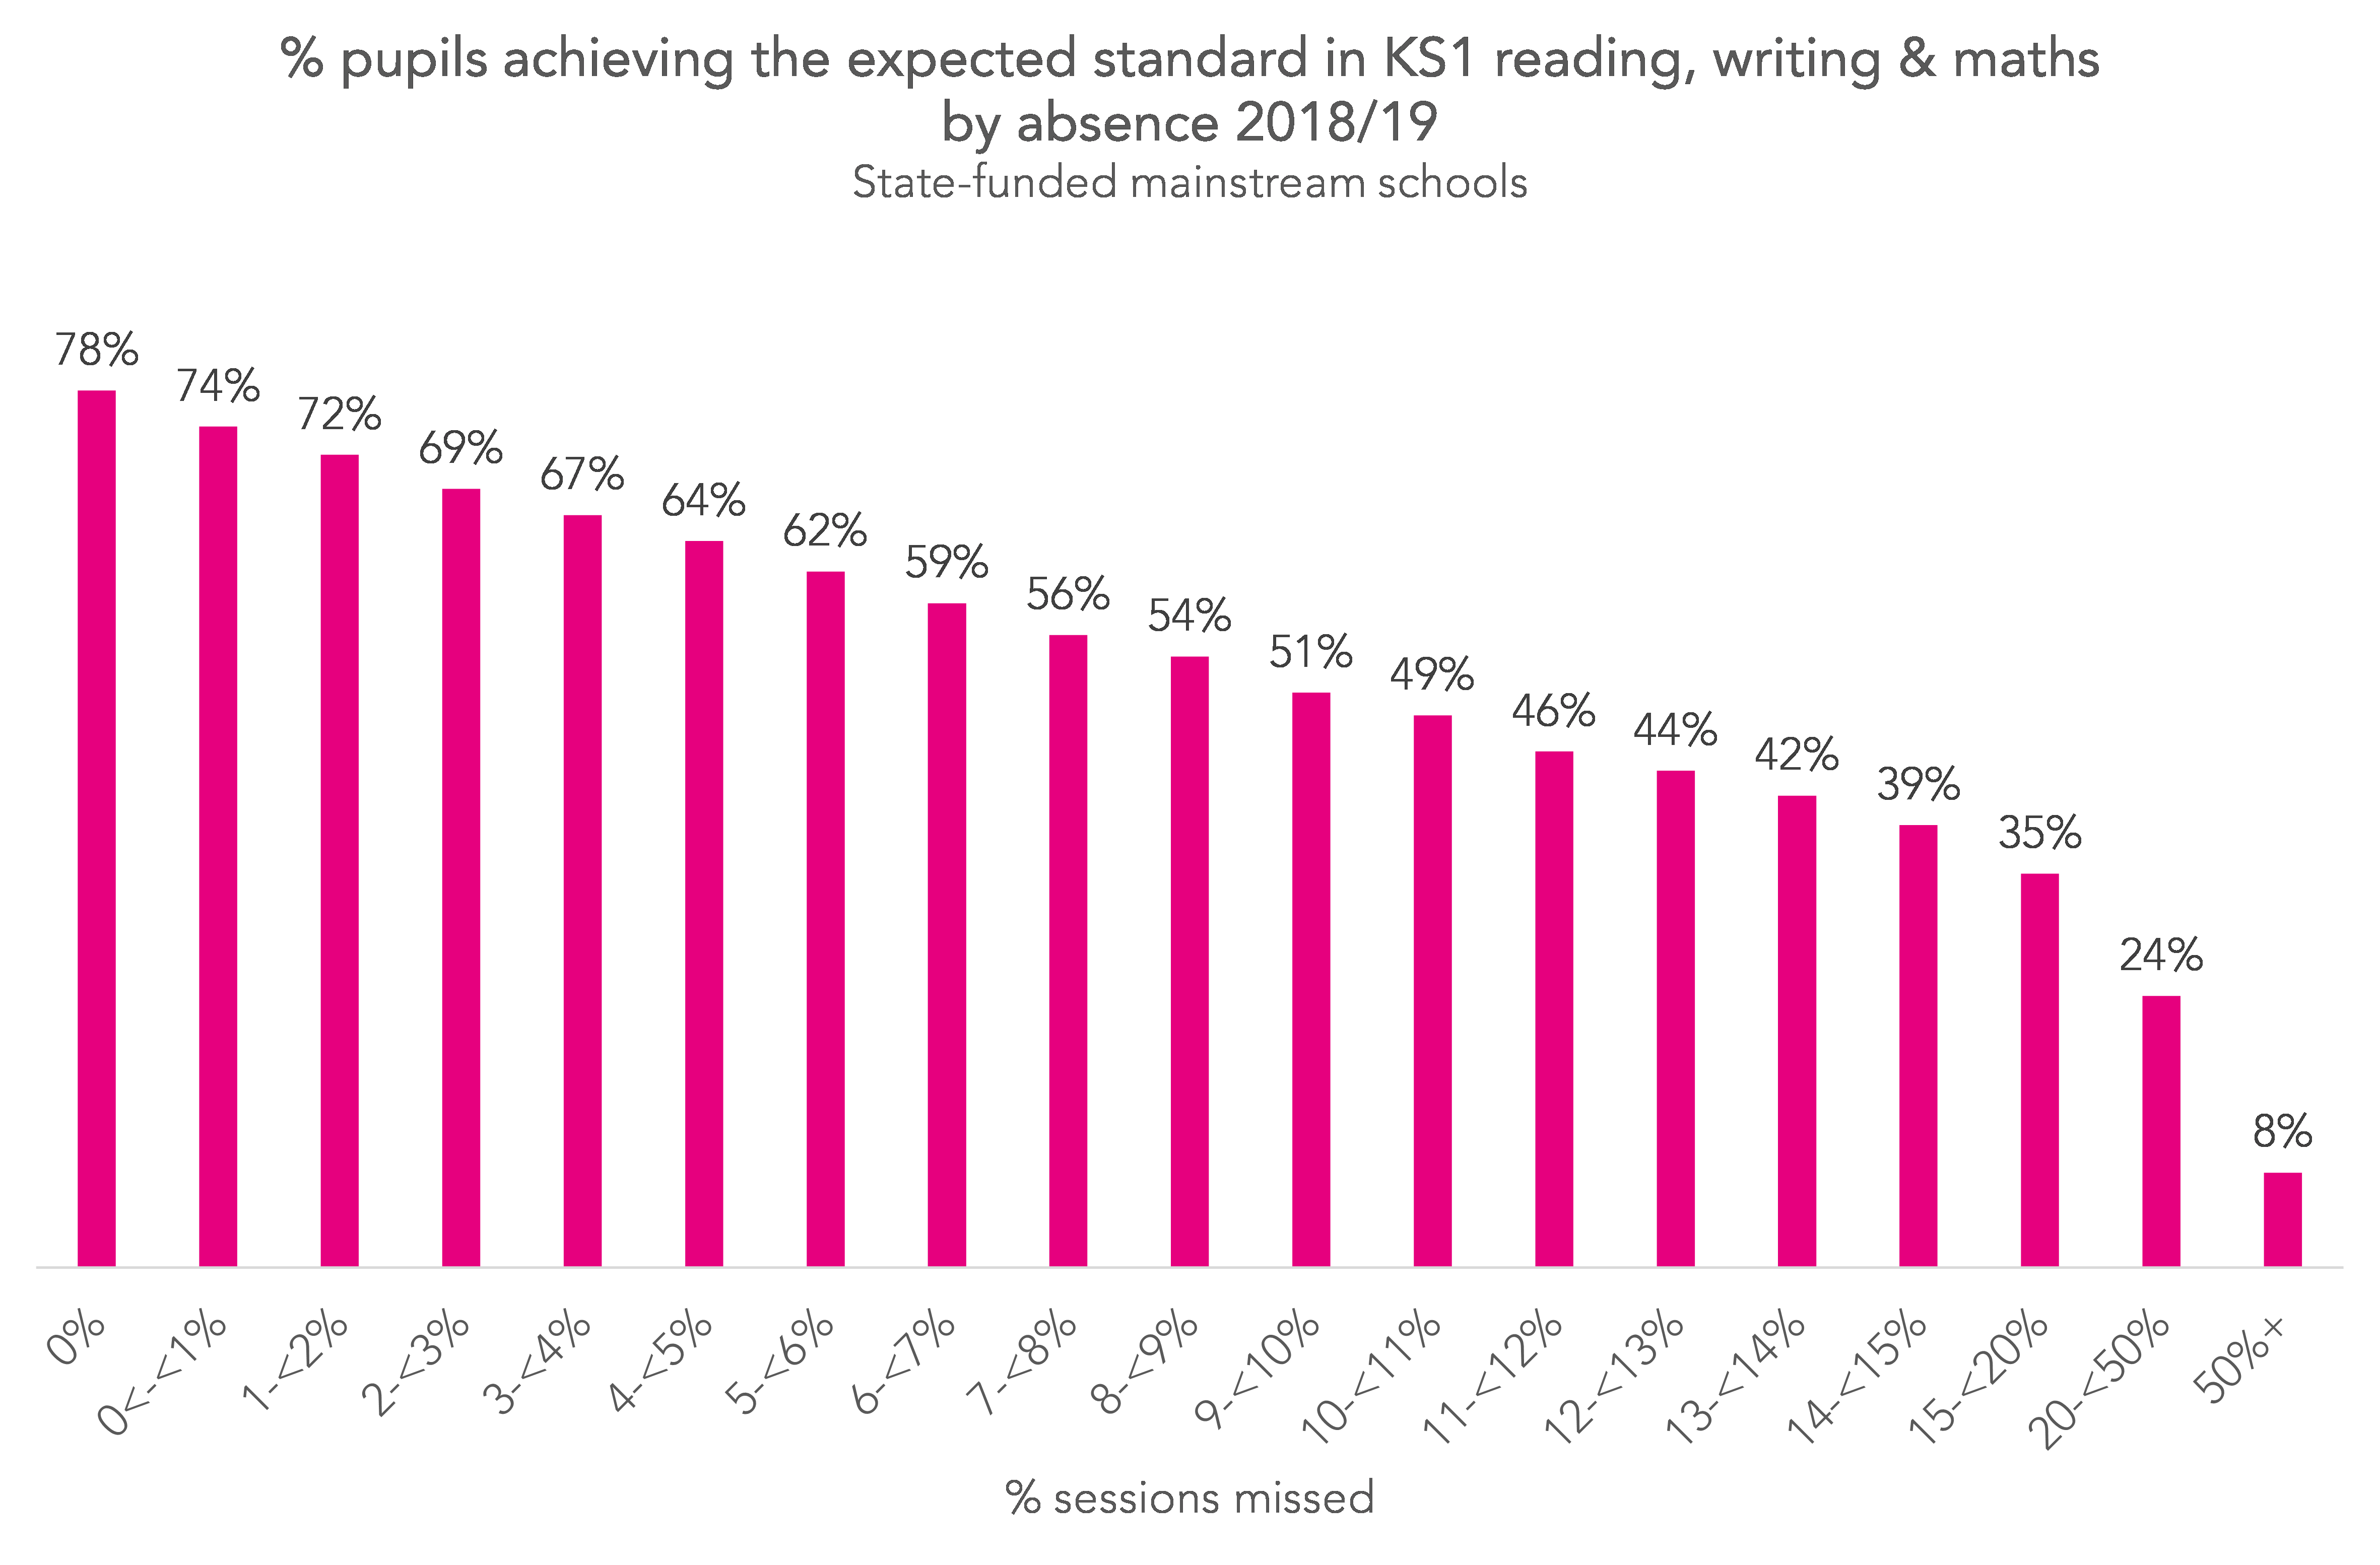
The stepped pattern is very similar to that from 2019 (reproduced below). However, within each band of absence, the level of attainment was lower in 2023.
Key Stage 2
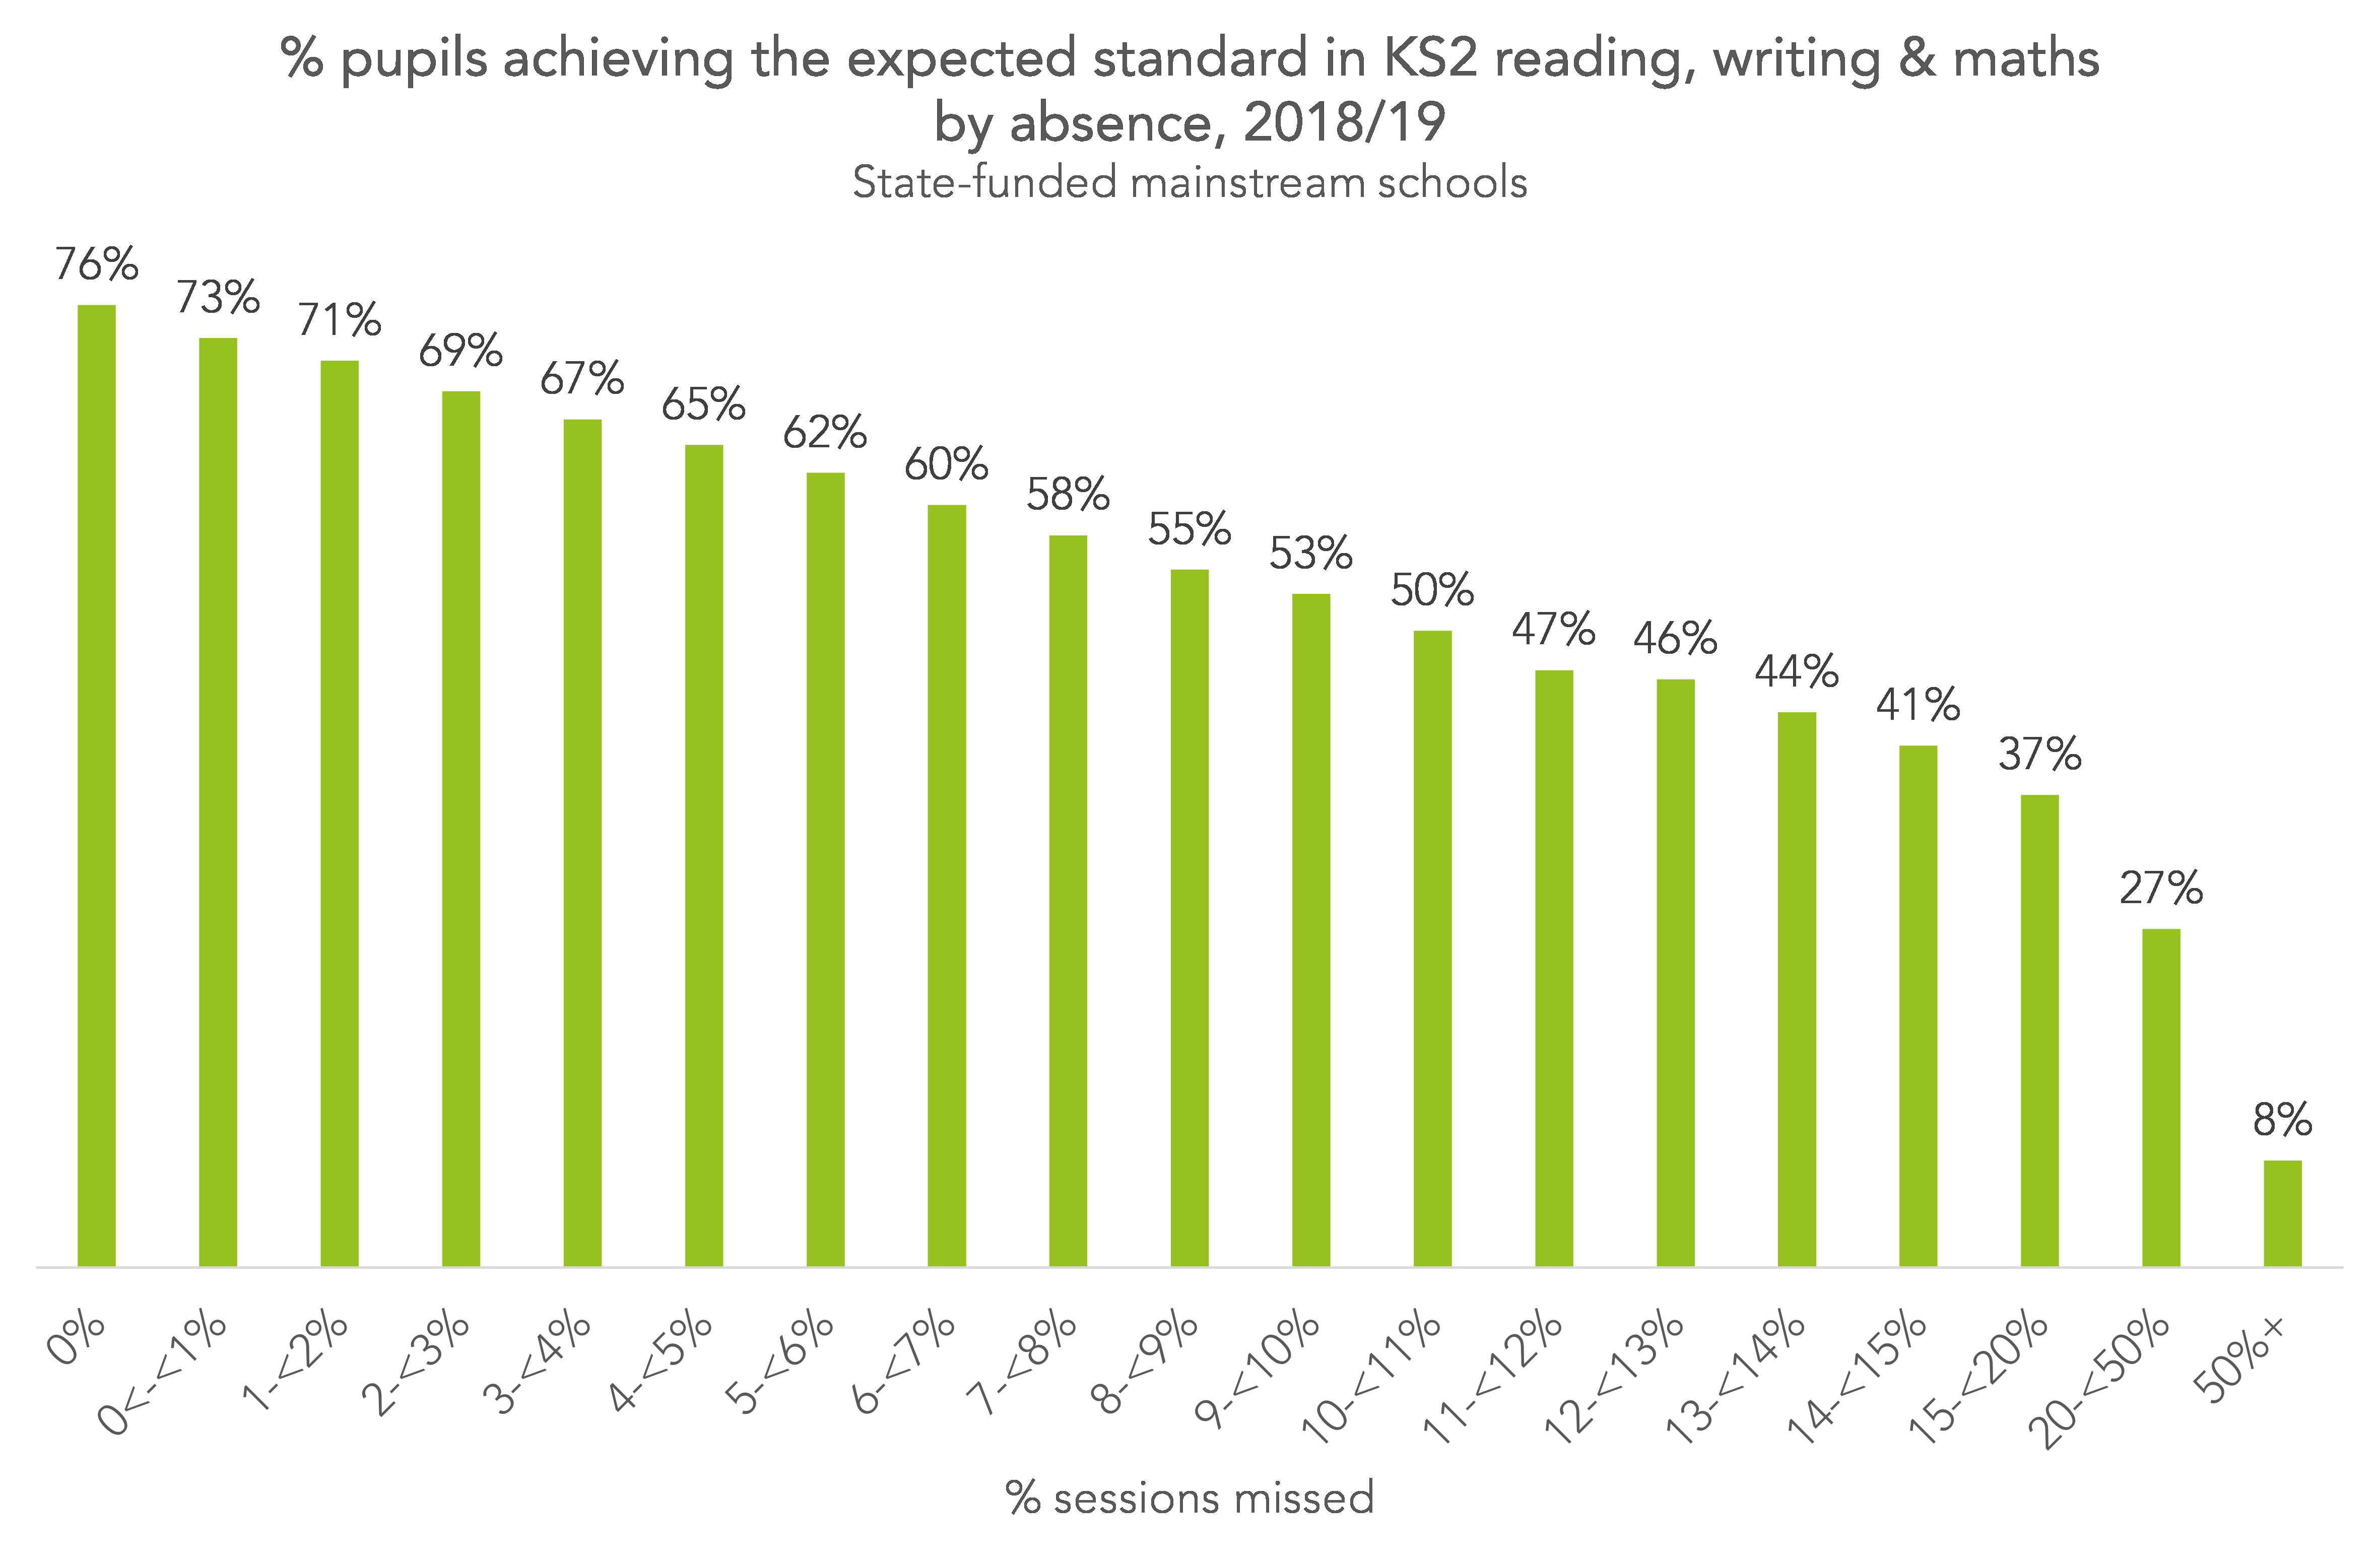
Next, we do similar for pupils at the end of Key Stage 2 (Year 6) in the schools in our sample.

The pattern is similar to that for KS1. Attainment declines as absence increases.
A comparison to 2019 (shown below) also shows that, for pupils with an absence rate between 0% and 0.99% levels of attainment were lower in 2023. However, rates of attainment for other absence bands were not too dissimilar to 2019.
Summing Up
In our sample, 57% of all pupils achieved the expected standard in reading, writing and maths at KS1. If pupils in 2023 had the same level of absence as pupils in 2019 but the achievement rate in each absence band remained the same, the average would have been 60%. This would still be below the 2019 national average of 66%[1].
At KS2, 60% of all pupils achieved the expected standard in reading, writing and maths. If pupils in 2023 had the same level of absence as pupils in 2019 but the achievement rate in each absence band remained the same, the average would have been 64%. This would still have been below the 2019 average of 65% for this group of schools[2], but only just.
On the surface at least, this might suggest that lower attainment in 2023 is not solely due to lower attendance, particularly at Key Stage 1. This is something we’ll dig into further during this academic year.
- We would expect the average in 2019 for this group of schools to have been within 1 percentage point of the national average.
- Based on published 2019 statistics
Want to stay up-to-date with the latest research from FFT Education Datalab? Sign up to Datalab’s mailing list to get notifications about new blogposts, or to receive the team’s half-termly newsletter.


Correlation does not mean causation.
Whilst there is evidentially correlation between attendance and standardised tests this is interesting but dangerous as politicians and public alike will draw a causation conclusion.
What about massive under provision of SEND in our schools and other forms of partial school withdrawal by parents unhappy with say bullying or simply use of standardised tests.
As a former school leader fully aware of the manipulation and minefield of even recognising SEND in children and outright resistance to ECHP processes. These make it the right of only the well funded and tenacious, or of Ofsted’s denial of many schools needs and cohort challenges, or the absence of funding considerations – we have a broken system. You said it in the introduction a simple analysis. Some might say devoid of relevant factors that might make it useful for analysis.
Hi Andrew. Thanks for taking the time to comment. You make some good points and I will respond to some of them. Firstly, the purpose of the blog was simply to show how things had changed in 2023 compared to 2019, which I don’t think anyone else has done yet. Secondly, the correlation is not causation point is made in the introduction. Finally, the conclusion of the piece is that lower attainment in 2023 appears to be more than just a function of lower attendance. You’re right that we don’t get into the reasons for this (and I agree with that the causes would be multifactorial) but this would be beyond the scope of a 700 word blog post. It would require a dedicated (and multi-disciplinary) research team tackling the question from multiple angles. It’s a starting point for some analysis. No more than that.