This year the Department for Education (DfE) will be unable to produce its headline school accountability measure, Progress 8, due to the cancellation of Key Stage 2 tests (which are used as a baseline when calculating the measure) in Summer 2020 due to the COVID-19 pandemic.
We previously set out some ideas for proxy measures of Progress 8.
In this article, we present another that we have calculated for schools that subscribe to FFT Aspire, using CAT4 as an alternative baseline measure.
Data
At the time of writing, 1,190 schools (around one in three of all secondary schools) had uploaded 2025 Key Stage 4 data to the FFT Early Results Service.
We calculated Attainment 8 in line with the DfE Secondary Accountability Guidance.
874 schools had previously supplied Level D CAT data for their pupils. These are tests that would have been completed in the 2020/21 academic year when pupils were in Year 7.
CAT tests cover four domains: verbal reasoning, quantitative reasoning, spatial reasoning and non-verbal reasoning.
The mean score across all four domains is calculated for each pupil and rounded to the nearest whole number.
From the mean CAT scores we assign pupils to one of 49 prior attainment groups (PAGs).
We then calculate the mean Attainment 8 score for each PAG. These are shown in the following chart.
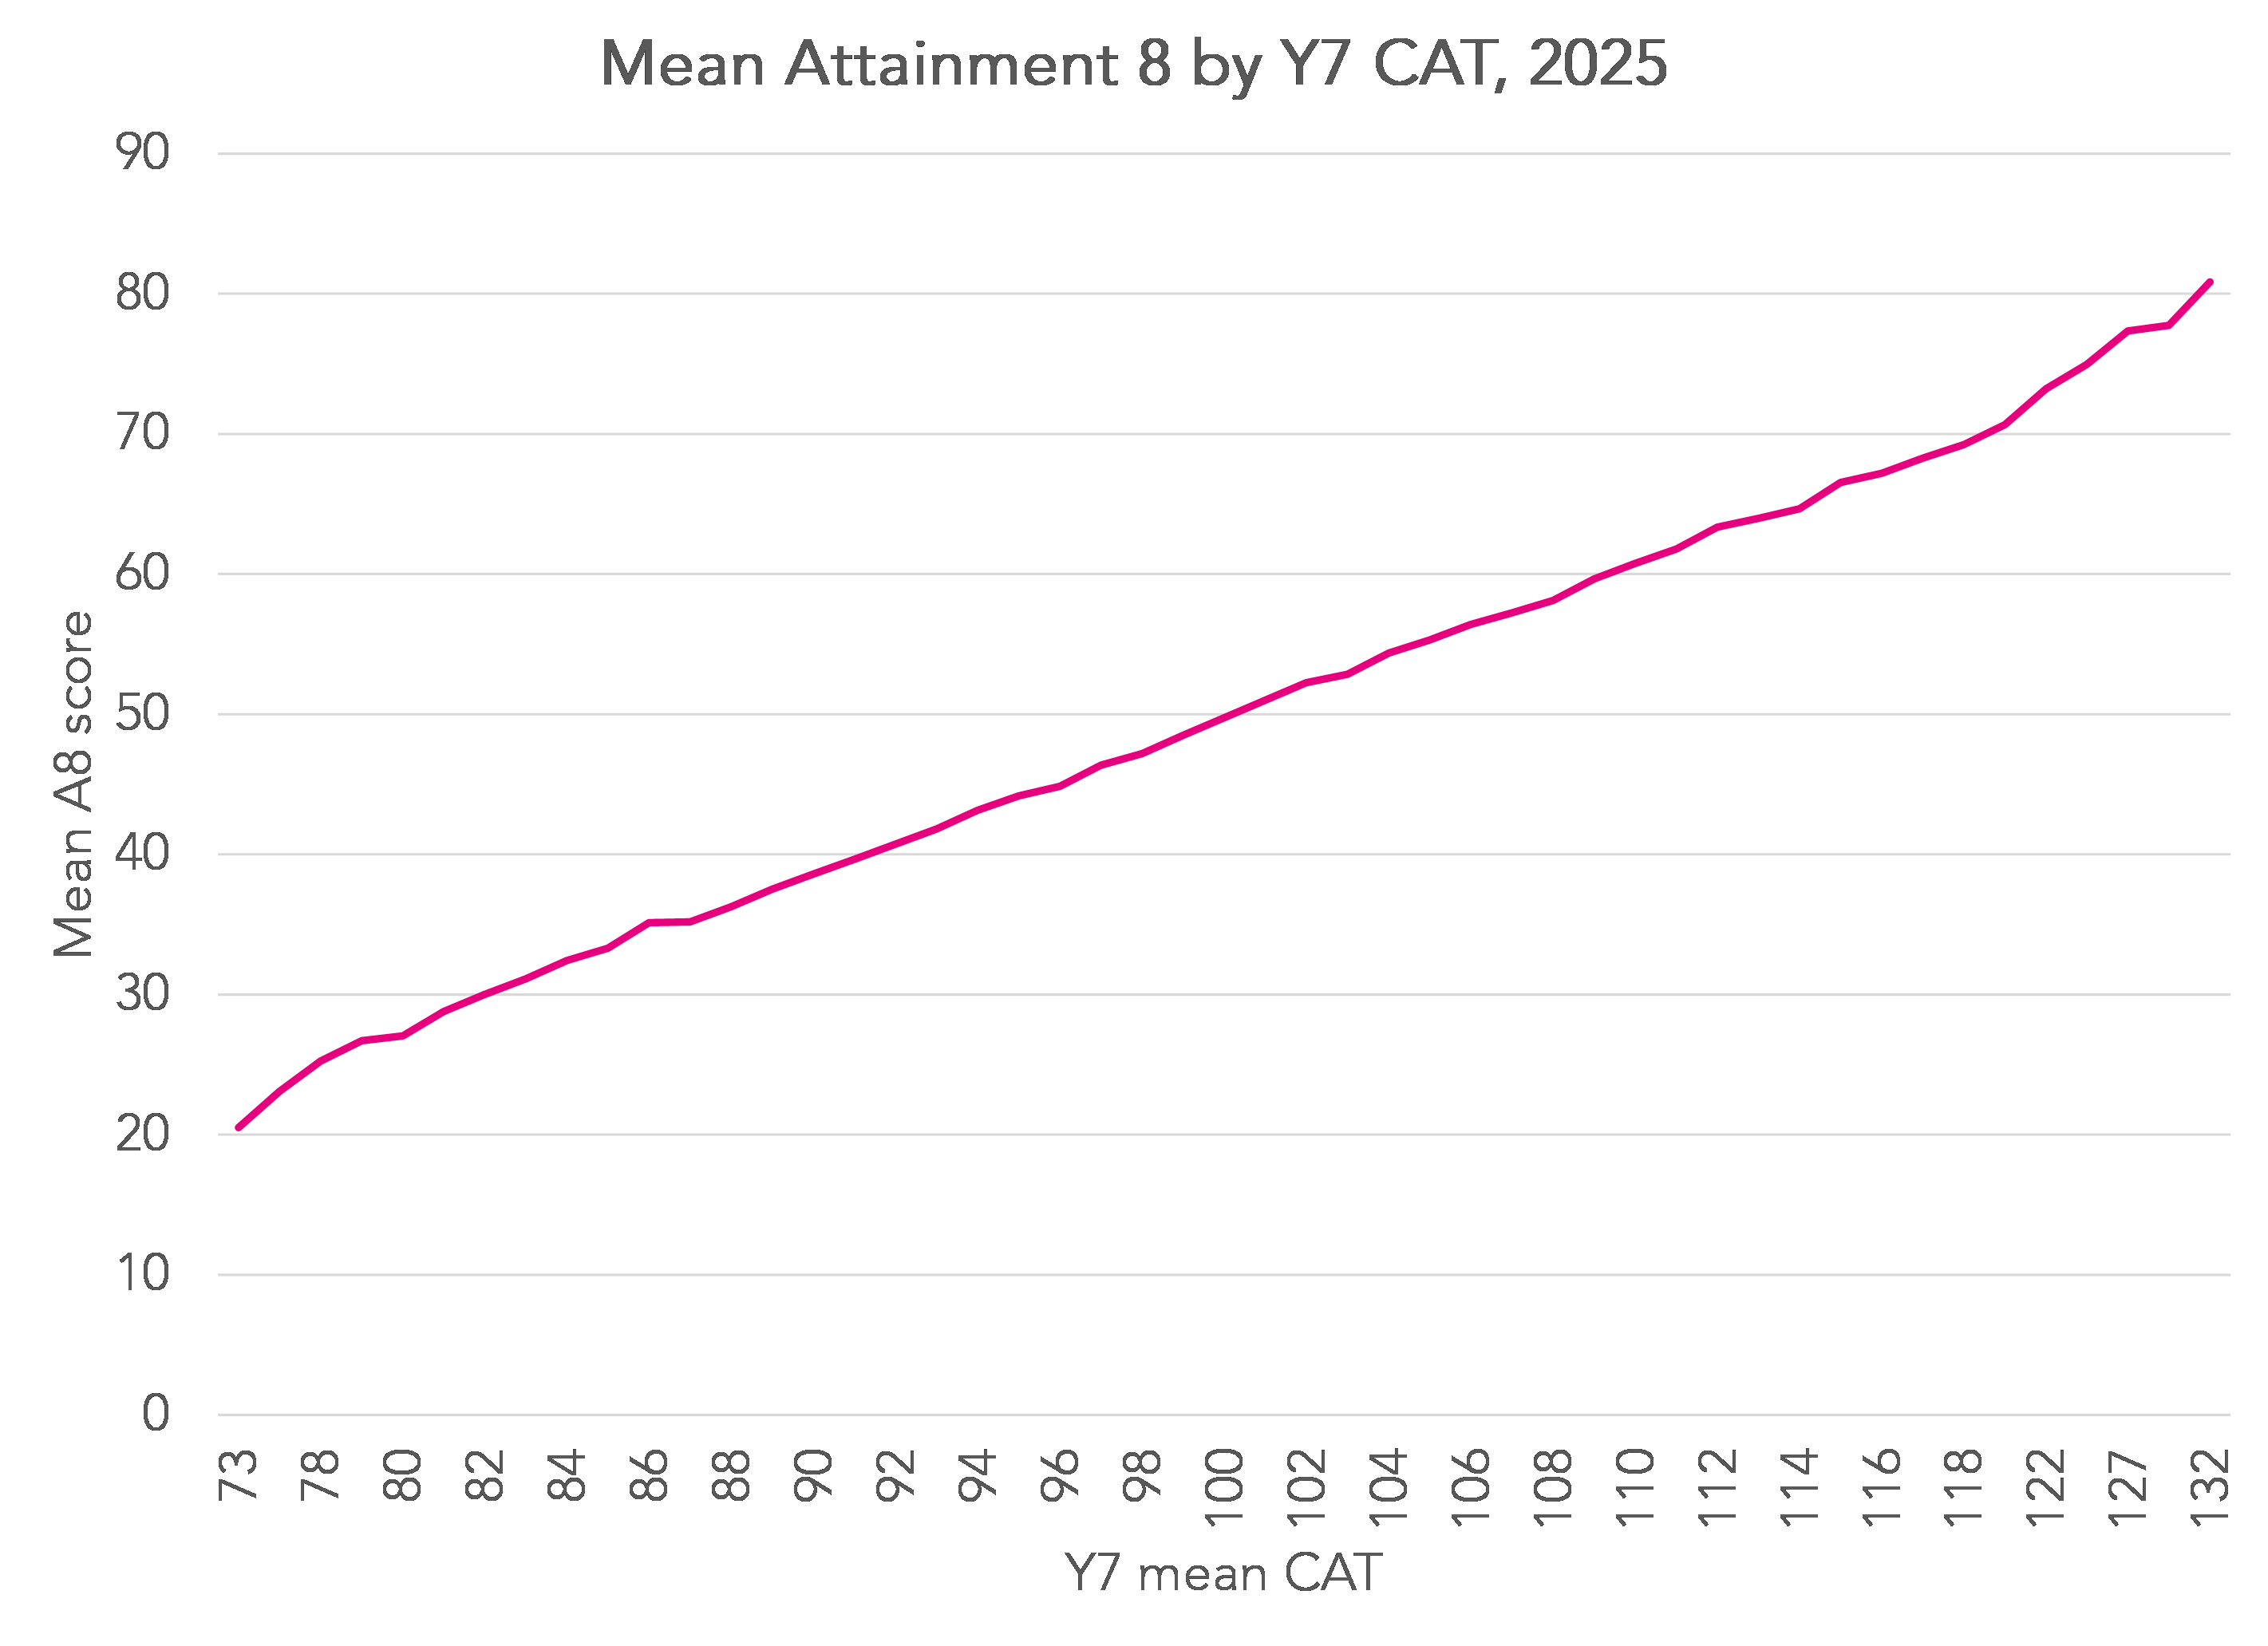
Attainment 8 scores tend to increase in line with prior attainment measured by CAT. The correlation between the two is 0.68, in the same ballpark as the correlation between mean Key Stage 2 test score and Attainment 8.
The chart also shows why it is important that we take account of different starting points. If we didn’t, we would effectively be comparing each pupil’s result with the national average Attainment 8 score (provisionally 49.1 for state-funded mainstream schools).
Note that values in the chart will change slightly as we receive more data from schools.
Calculating value added
Sign up to our newsletter
If you enjoy our content, why not sign up now to get notified when we publish a new post, or to receive our half termly newsletter?
We follow (almost) the same method that DfE use when calculating Progress 8, the only difference being that we use mean CAT4 score in place of mean Key Stage 2 result in reading and maths.
The value added score for each pupil at each school is calculated as the difference between their Attainment 8 score and the mean Attainment 8 score for all other pupils in the sample from the same PAG.
A school’s value added score is then the mean of the value added scores of all its pupils.
We do not make any adjustments to cap the Progress 8 scores of outliers (pupils with extremely negative value added scores). This is a step applied in Progress 8 that affects less than 1% of pupils nationally and, even when applied, rarely changes a school’s Progress 8 score by more than 0.02.
We have also produced a second version of the measure which also includes pupils who took CAT4 tests later than Year 7 although we do not discuss that here.
Value added scores by pupil characteristics
As with Progress 8, there is variation in Progress 8 scores with respect to pupil characteristics.
In the following chart, we show the mean CAT 4 Progress 8 score for 2025 (which we label CAT8) for groups of pupils based on gender, disadvantage (FSM6), first language and special educational needs (SEN) status. We compare these values to national averages for 2024 for Progress 8.
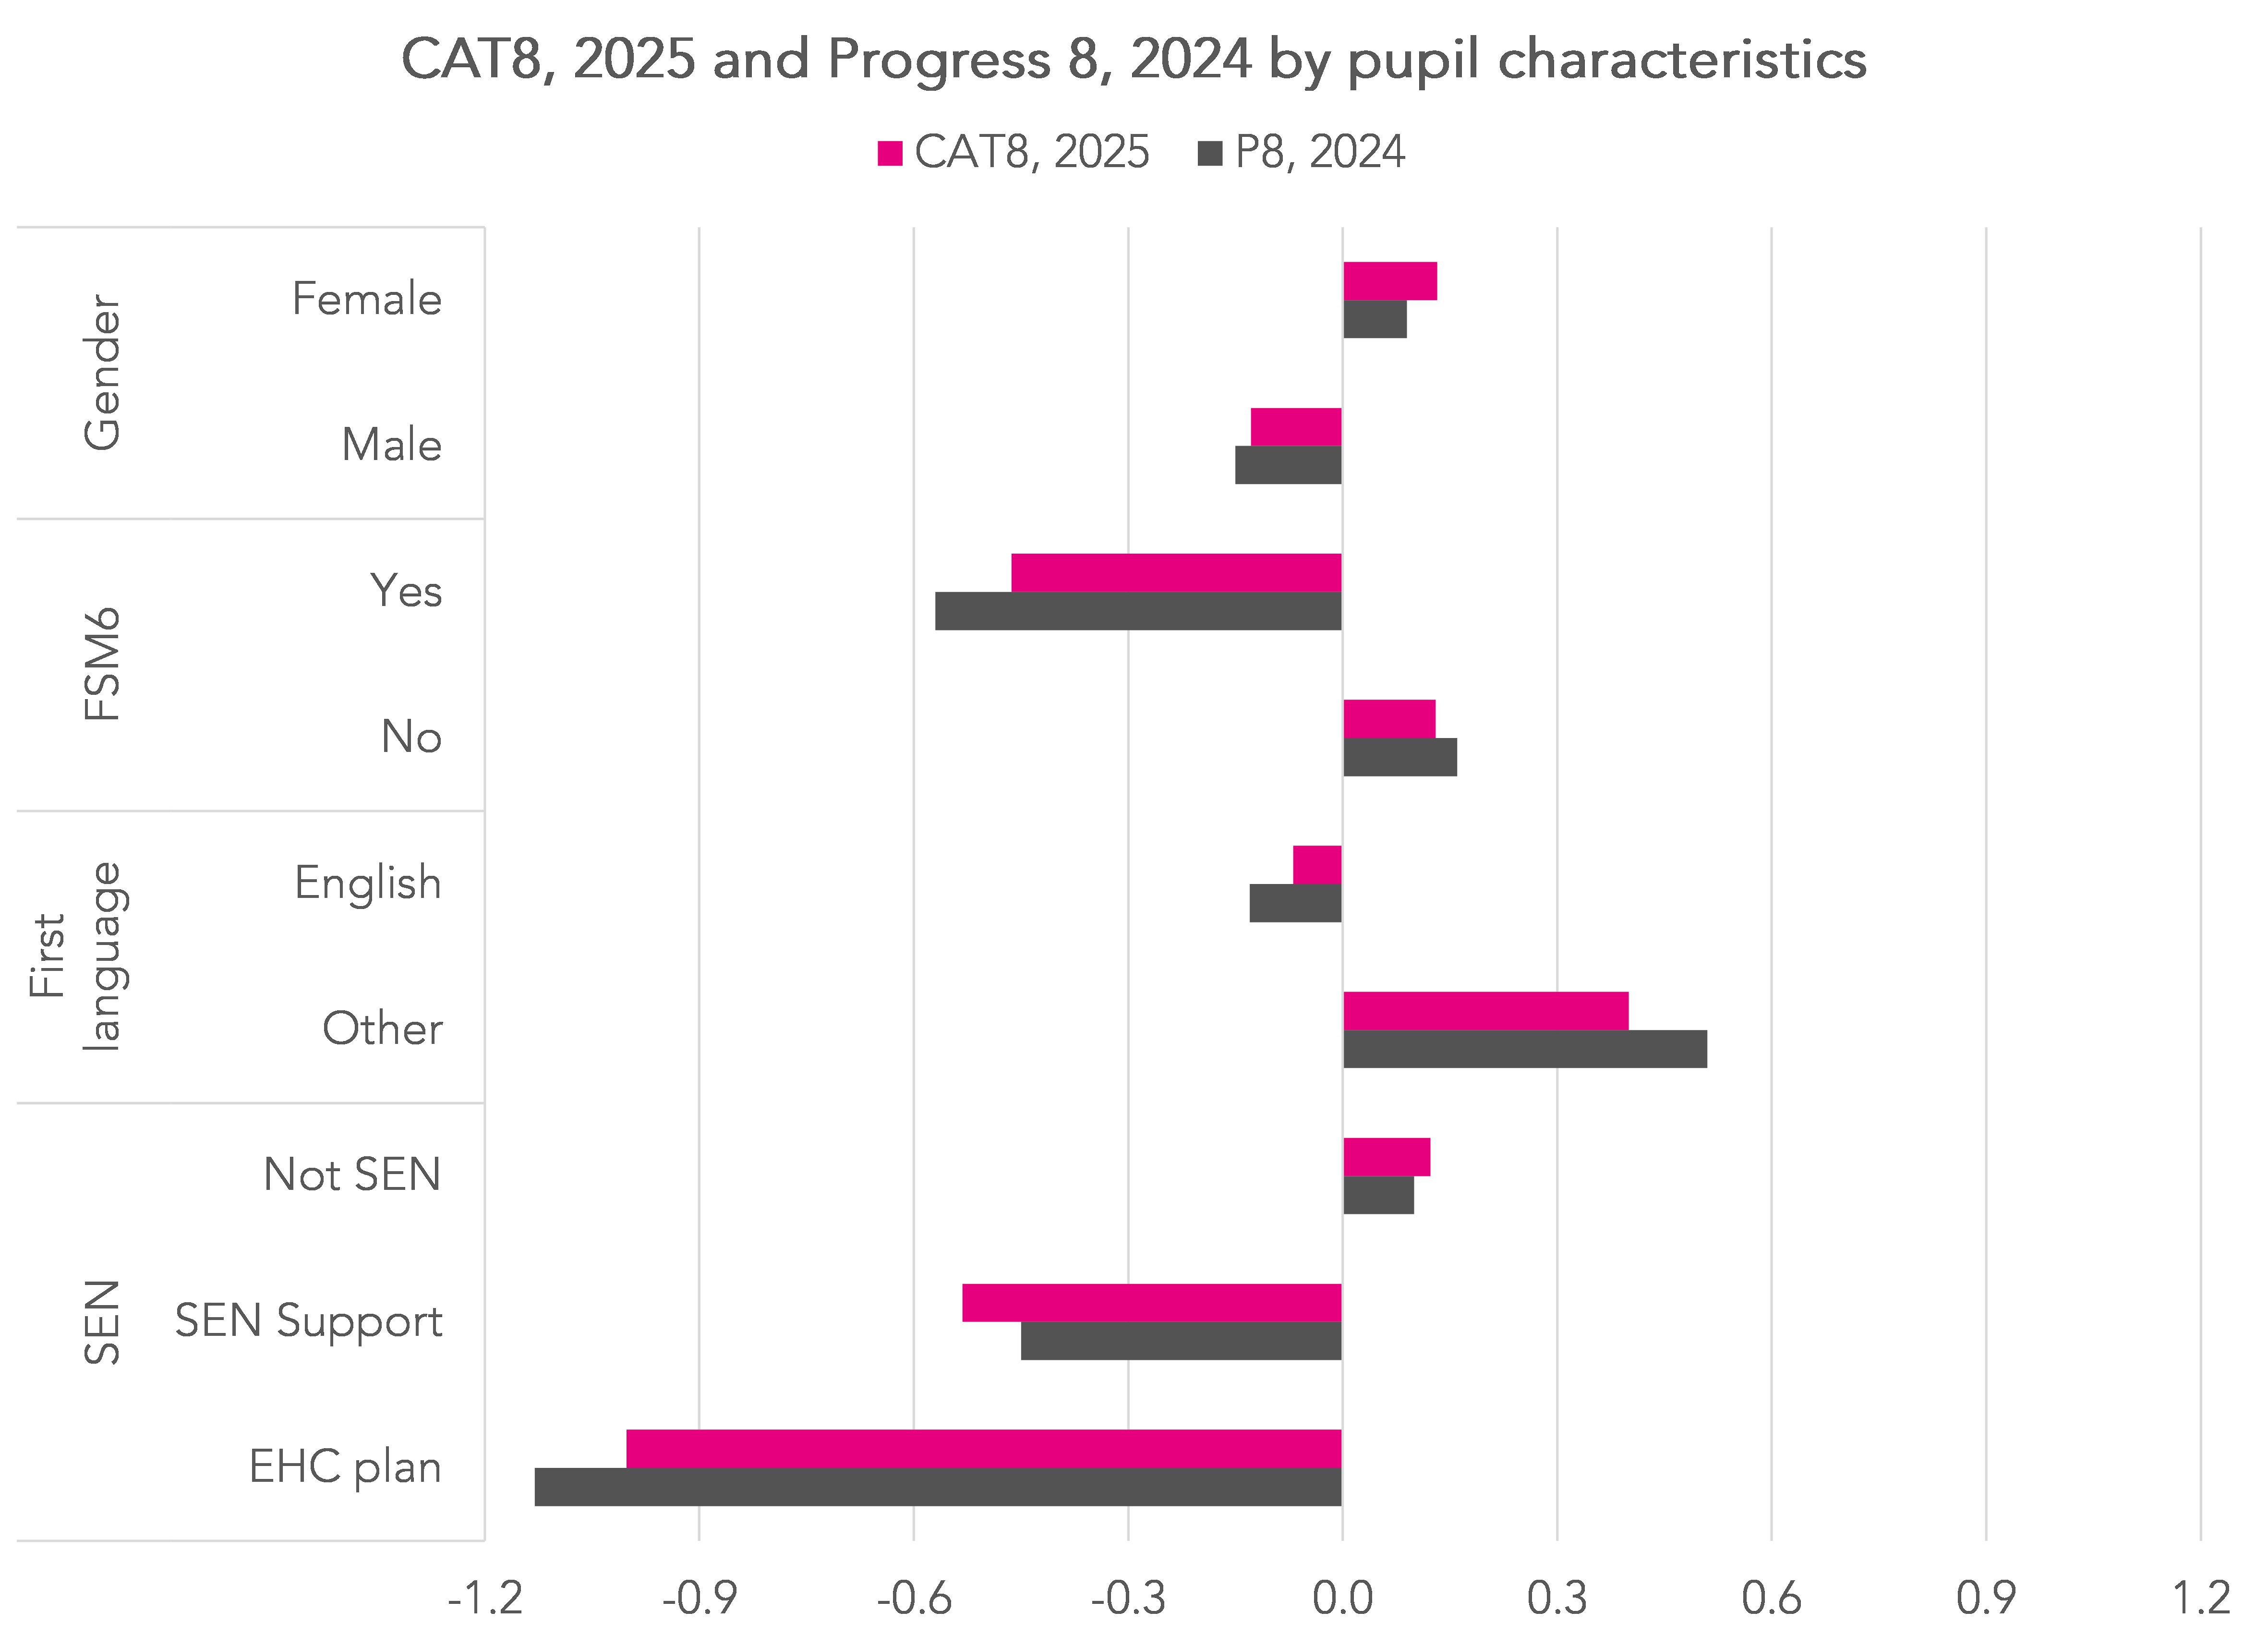
The CAT8 scores are broadly similar to the P8 scores: disadvantaged pupils and those with SEN tend to be lower attaining and pupils with a first language other than English tend to be higher attaining relative to pupils with similar prior attainment.
If anything, the value added disadvantage gap is slightly narrower based on CAT8 than Progress 8, although it is possible that the two might be closer if we had 2025 data for all schools rather than just a sample.
What the CAT8 measure is and isn’t
Just like Progress 8, the CAT4 Progress 8 measure isn’t really a measure of progress. It is a measure of attainment taking account of prior attainment.
Neither measure takes account of factors outside of school that affect attainment, such as illness, parental support and tutoring.
At school-level, we would caution against comparing CAT4 Progress 8 scores to Progress 8 scores from previous years. In the following chart we make such a comparison in order to explain why.
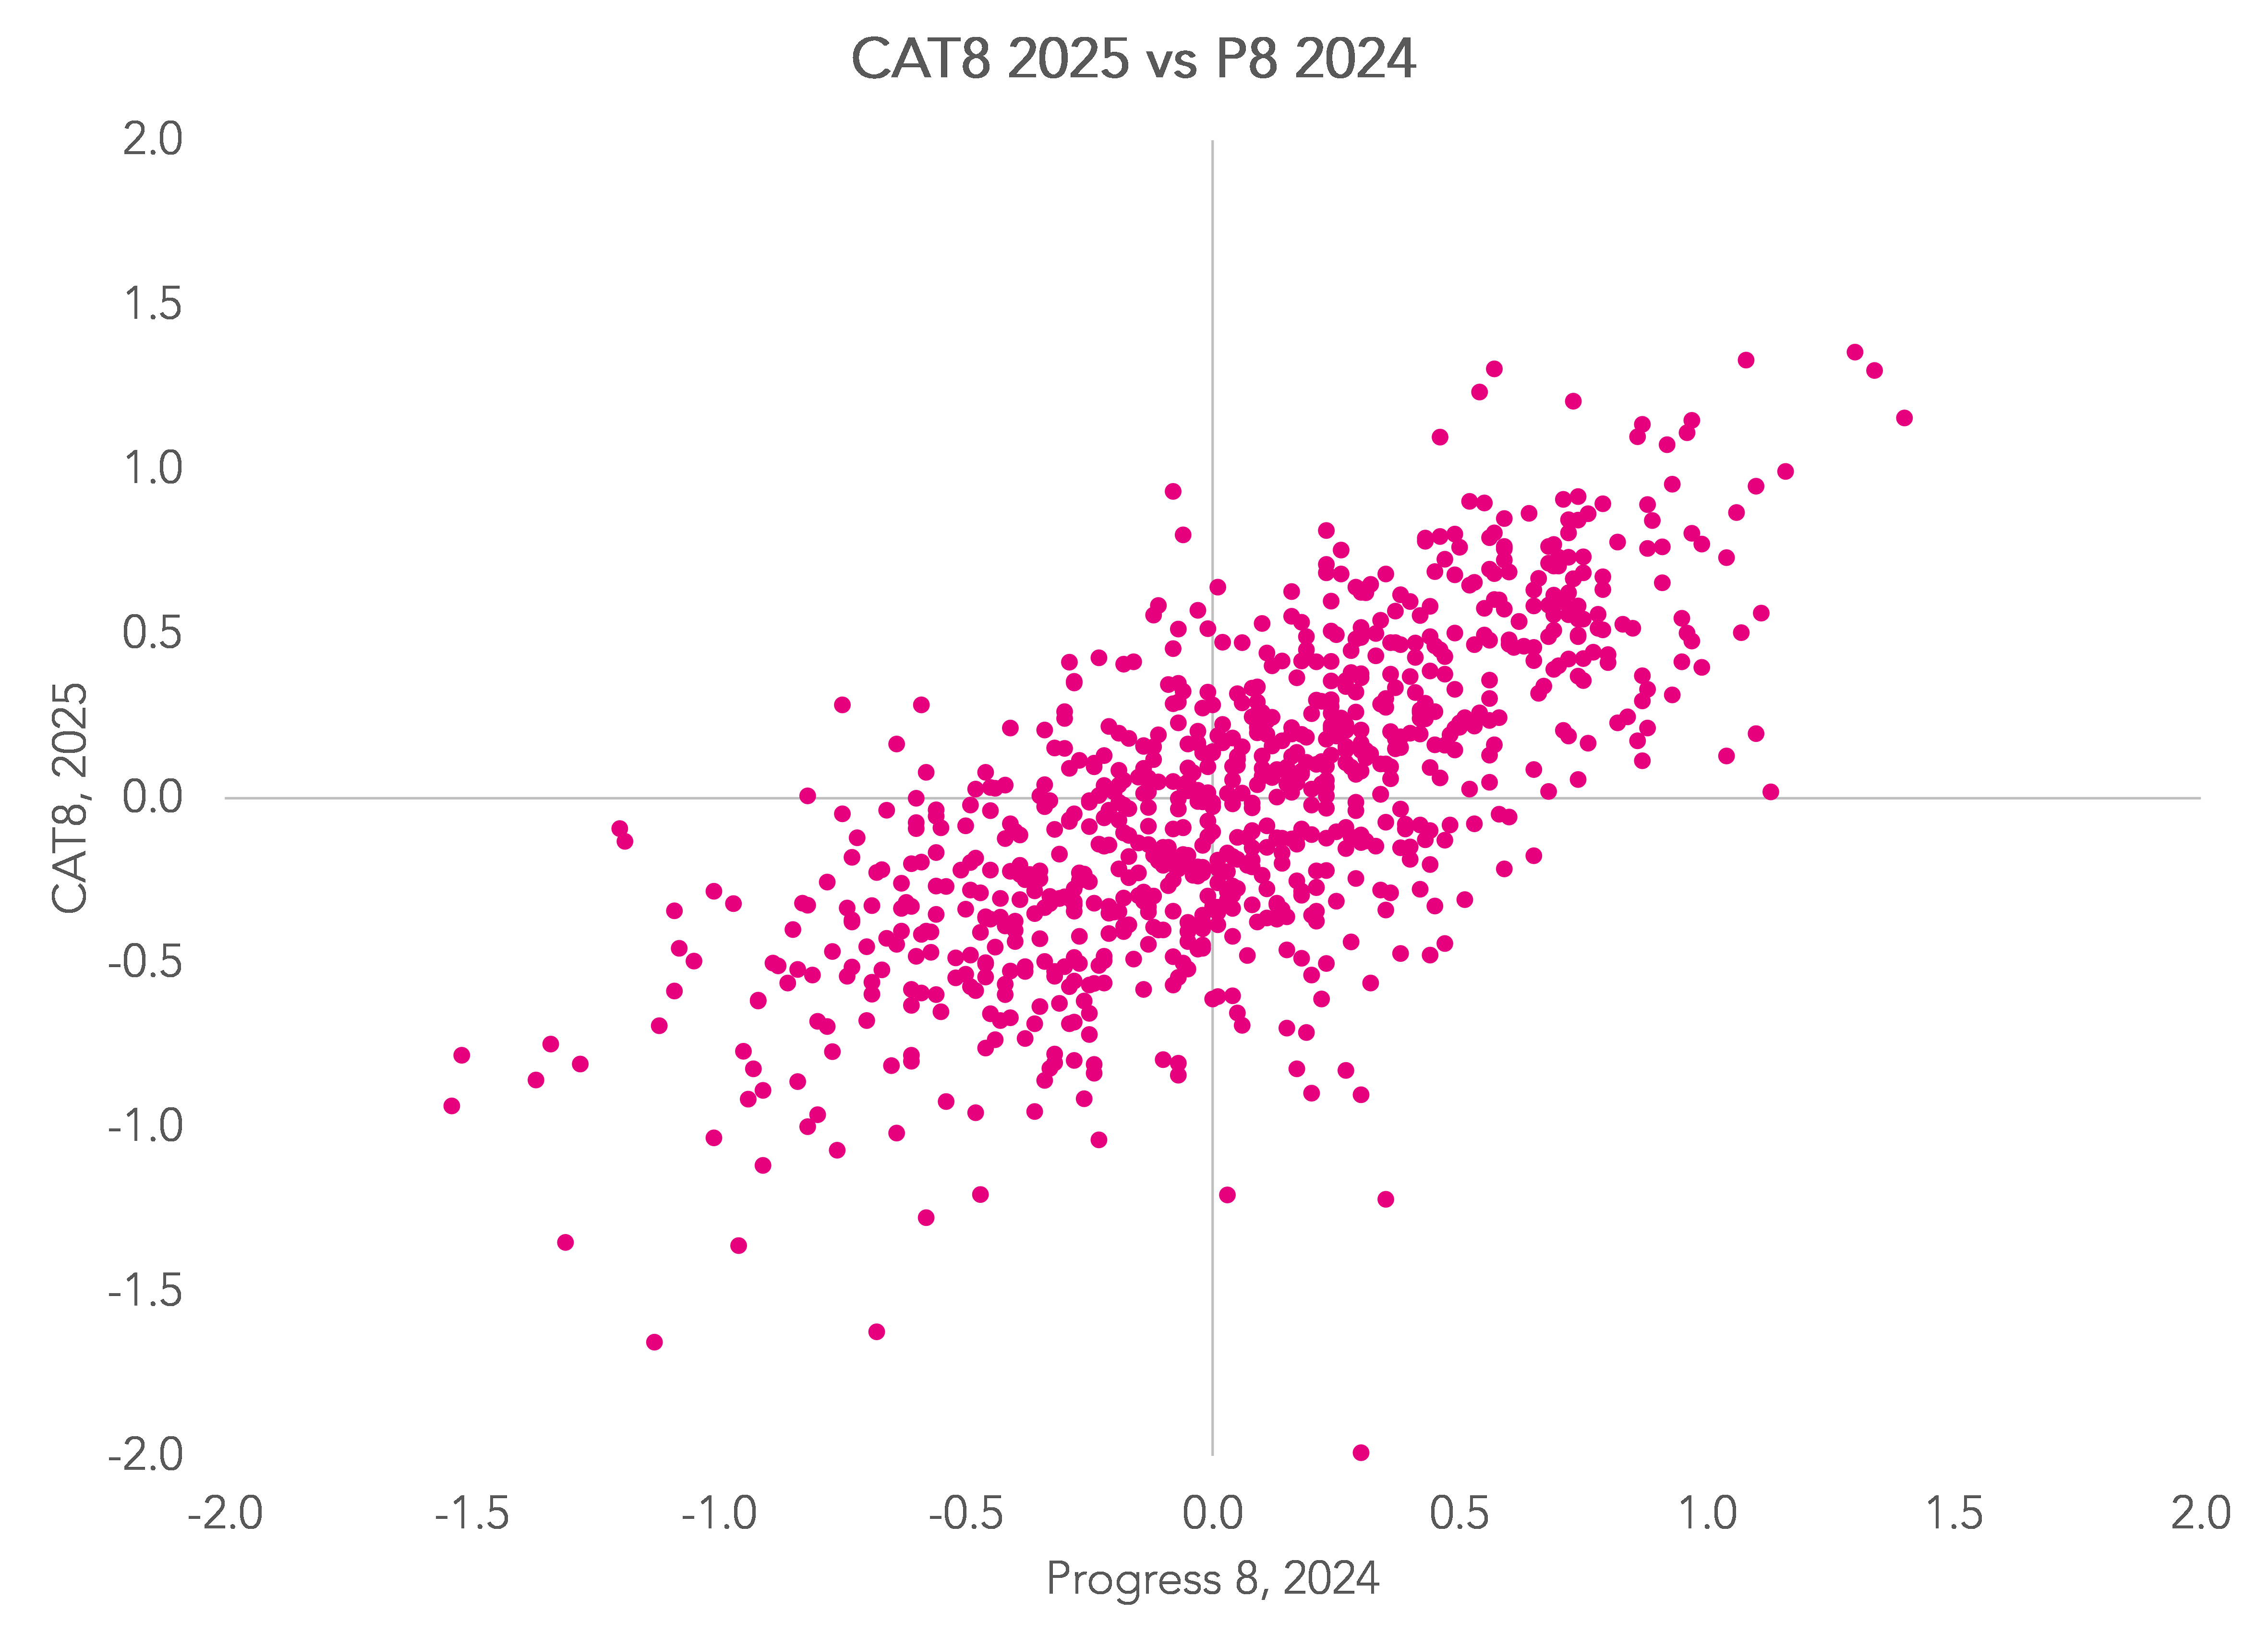
The two measures are moderately correlated (r=0.66). However, the correlation between Progress 8 in 2023 and Progress 8 in 2024 for the same set of schools was much stronger (r=0.89). In other words, there is more variability than we would expect.
Ultimately, the two baselines are fundamentally different. They are different tests, measuring different things, taken at different times and in different conditions. As the CAT4 technical manual shows, the correlation between mean CAT and KS2 test scores is 0.74 in maths and 0.66 in reading. In other words, a pupil’s rank position based on CAT may well be different (and sometimes very different) to their rank position based on Key Stage 2.
In summary, CAT4 Progress 8 is no worse or no better than Progress 8 based on Key Stage 2. It is an alternative value added measure that can be used this year and next year until measures based on Key Stage 2 can be reintroduced in 2027.
Want to stay up-to-date with the latest research from FFT Education Datalab? Sign up to Datalab’s mailing list to get notifications about new blogposts, or to receive the team’s half-termly newsletter.


Leave A Comment