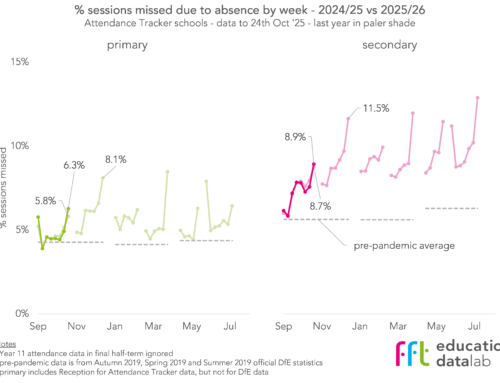
Rates of absence from school increased following the Covid-19 pandemic.
Since then, they have been slowly improving.
Despite the improvement in overall absence, the rate of severe absence (being absent for at least 50% of sessions), continued to increase in 2023/24.
Published official statistics show that there were over 170 thousand severe absentees, 2.3% of all enrolments in state-funded mainstream and special schools.
But can we be sure that all these pupils really are severe absentees? Let’s look at the data.
Data
We use data for the 2024/25 academic year collected from 10,000 schools that subscribe to FFT Attendance Tracker.
We replicate the Department for Education’s calculations and, for each pupil at each school, we calculate the total number of sessions[1] for which they were on roll and the total number of sessions for which they were absent.
Pupils absent for more than 50% of sessions are considered to be severe absentees.
Severe absentees in 2024/25
Based on our data, the rate of severe absence increased again in 2024/25.
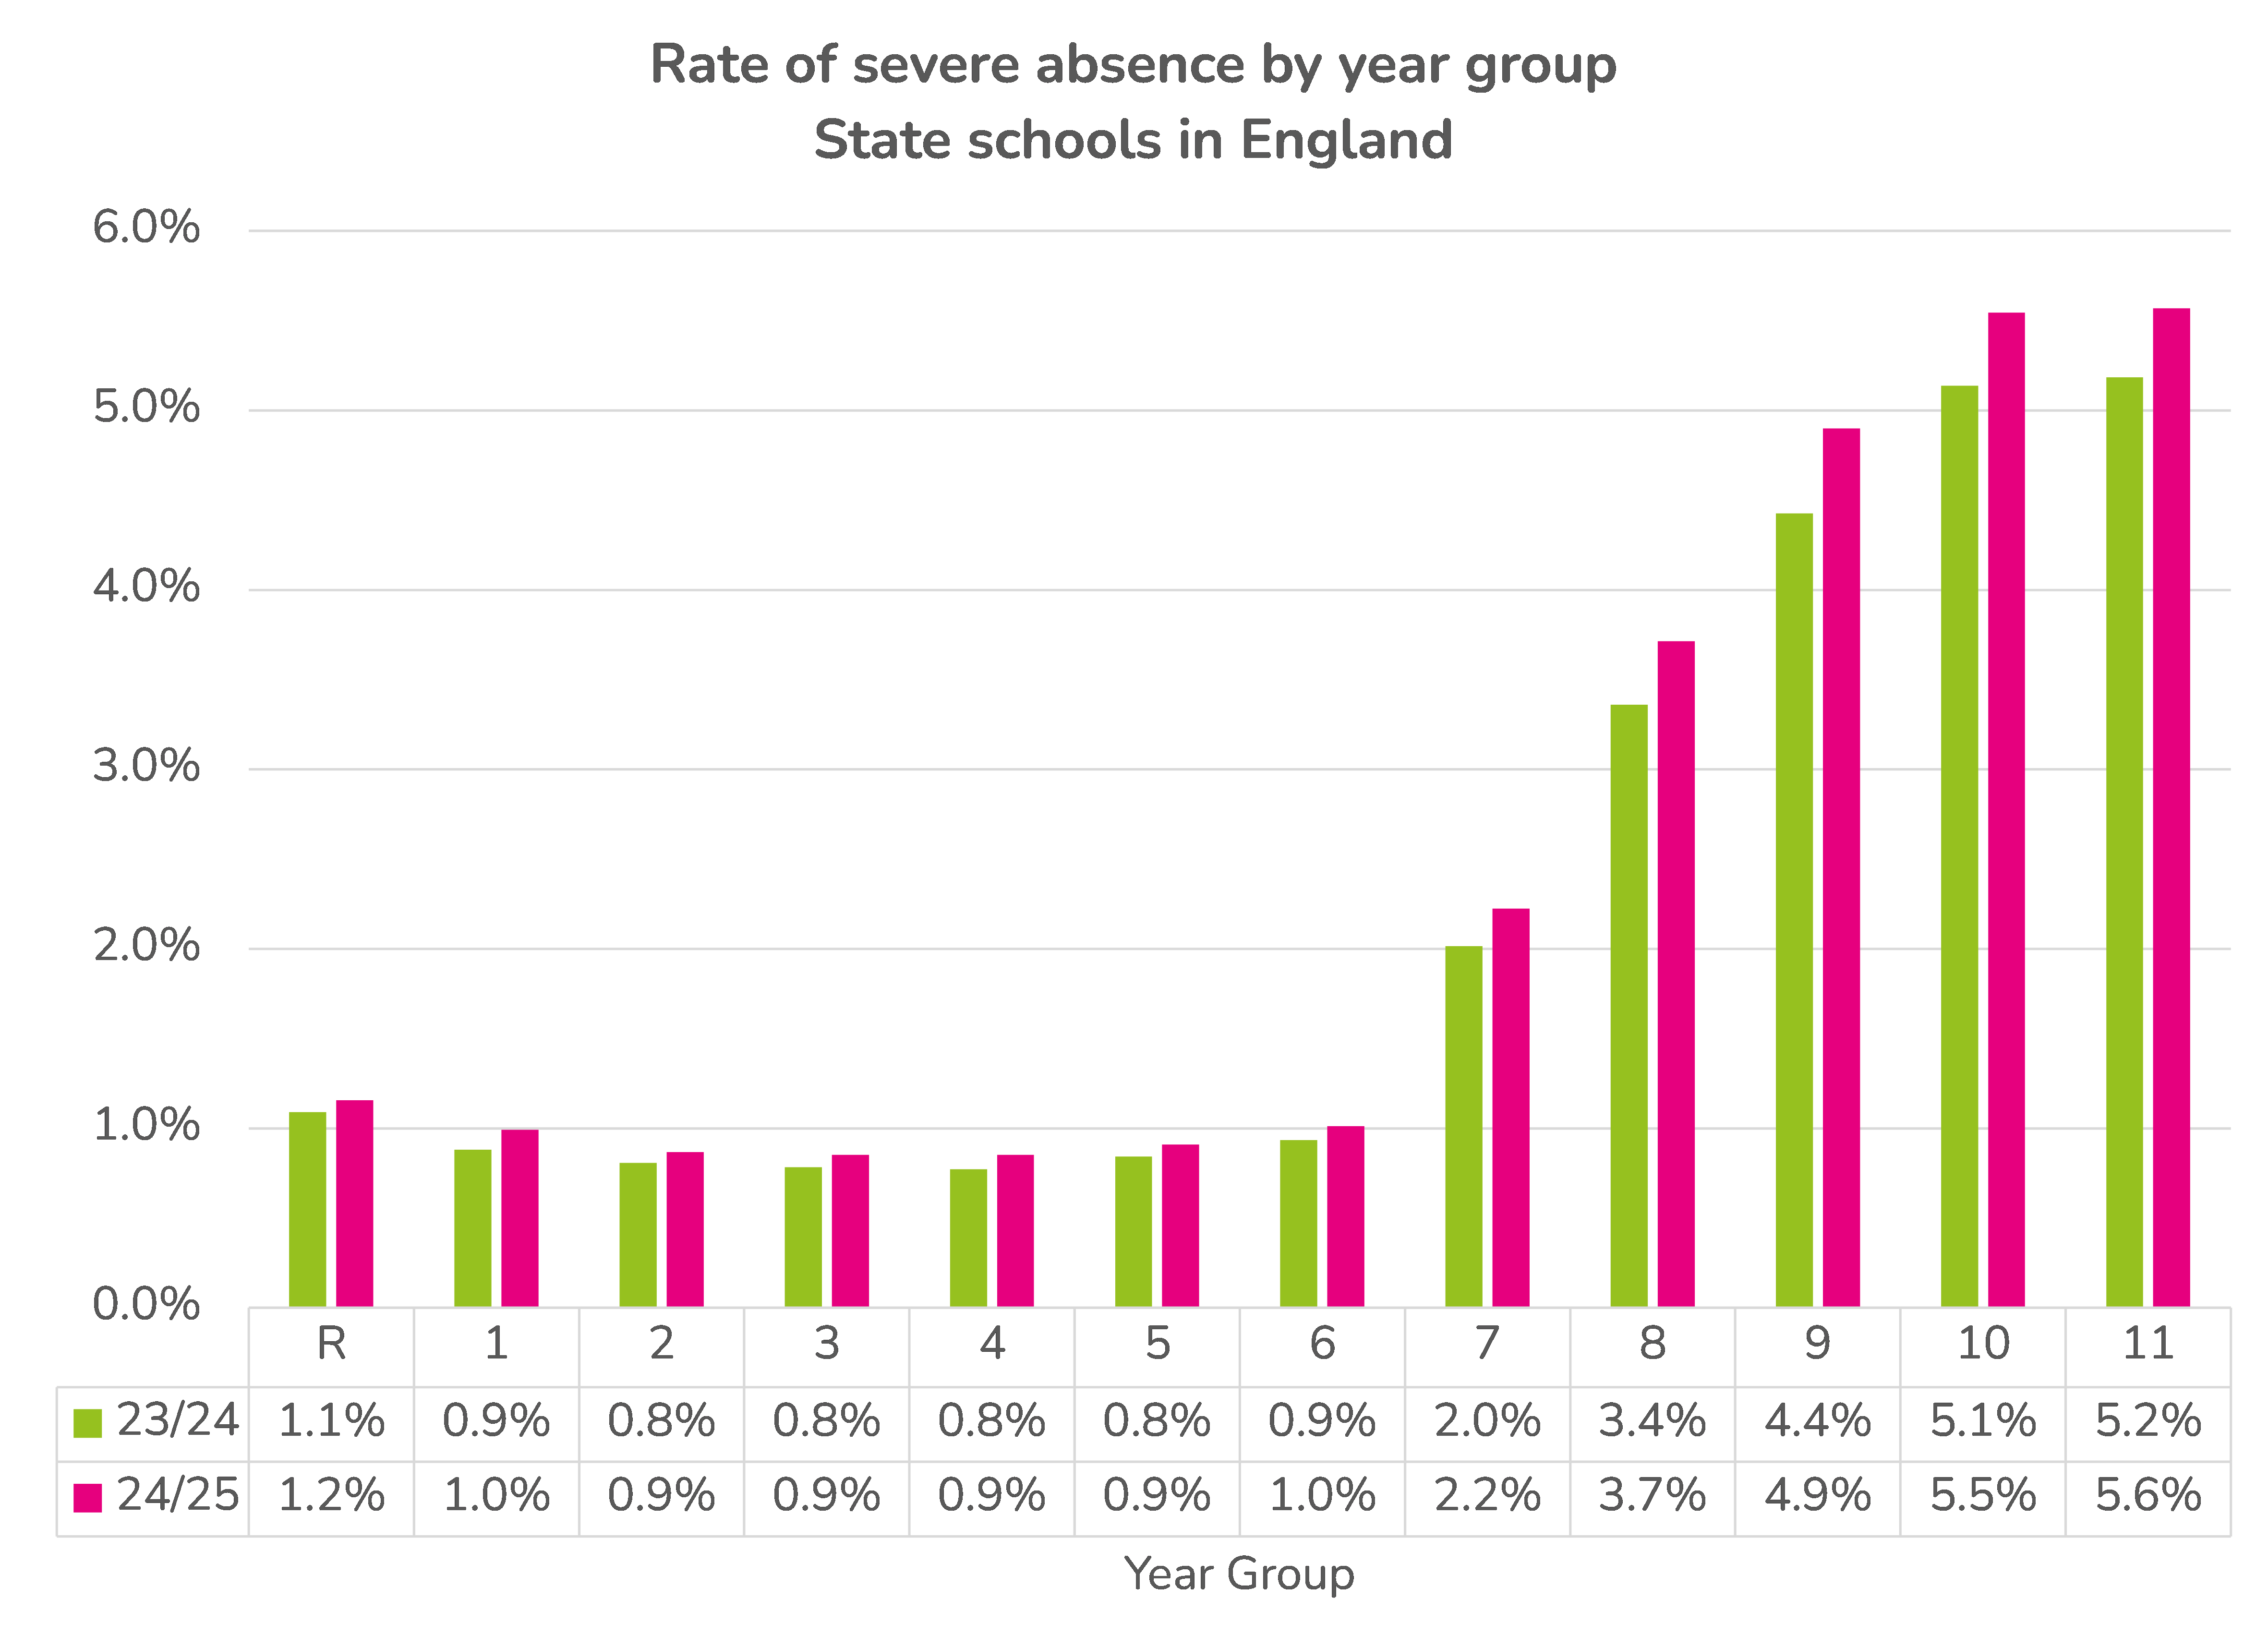
Compared to published data for 2023/24, the rates of severe absence in our data are slightly higher, for example 5.2% for Year 11 in our data and 4.8% in published data.
Severe absentees are less likely to be on roll for the whole year
A full academic year consists of 380 sessions (190 days) give or take a few for INSET days and any unexpected closures (e.g. as a result of adverse weather).
But when we look at the total possible sessions for severe absentees, we see that relatively few were on roll for at least 350 sessions.
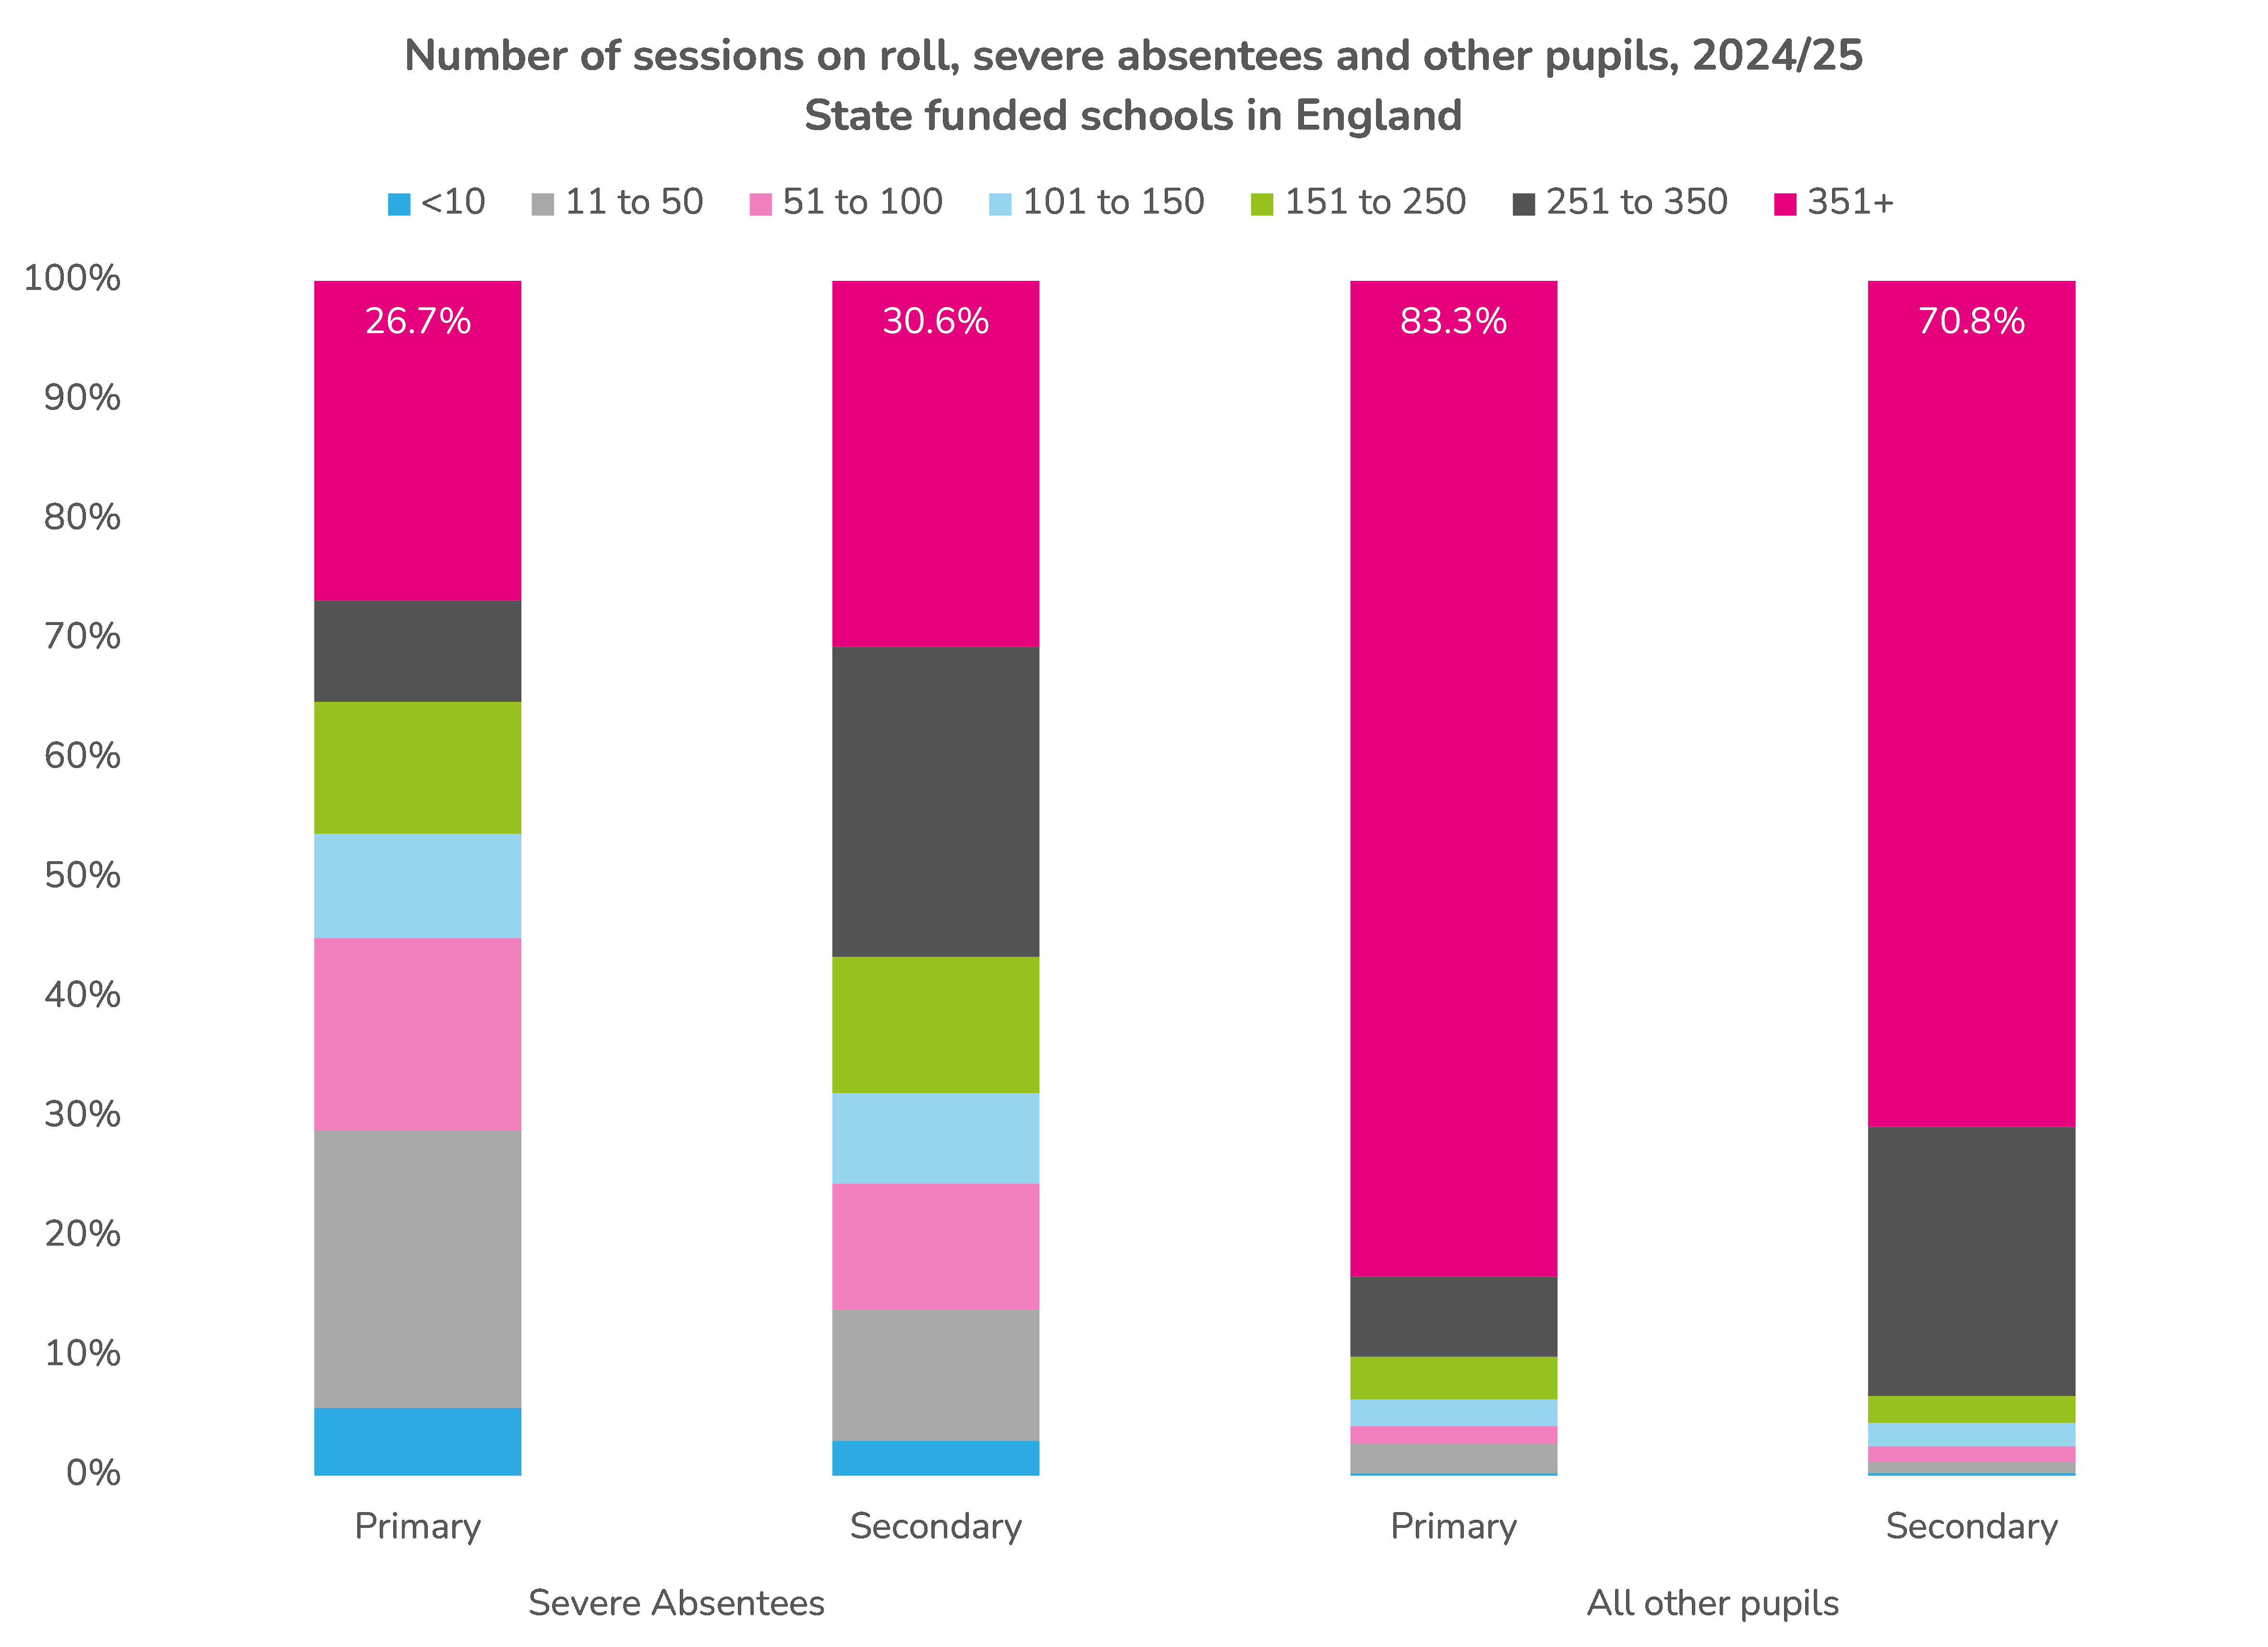
27% of primary-aged and 31% of secondary-aged severe absentees were on roll for at least 350 sessions. This compares to 83% and 71% respectively of other pupils.
It is possible that part-time timetables applied to some severe absentees, so instead let’s look at the total number of weeks that pupils were on roll.
We start with primary-aged pupils.
The chart below shows the cumulative distribution for the number of weeks on roll in 2024/25 for severe absentees compared to other pupils.
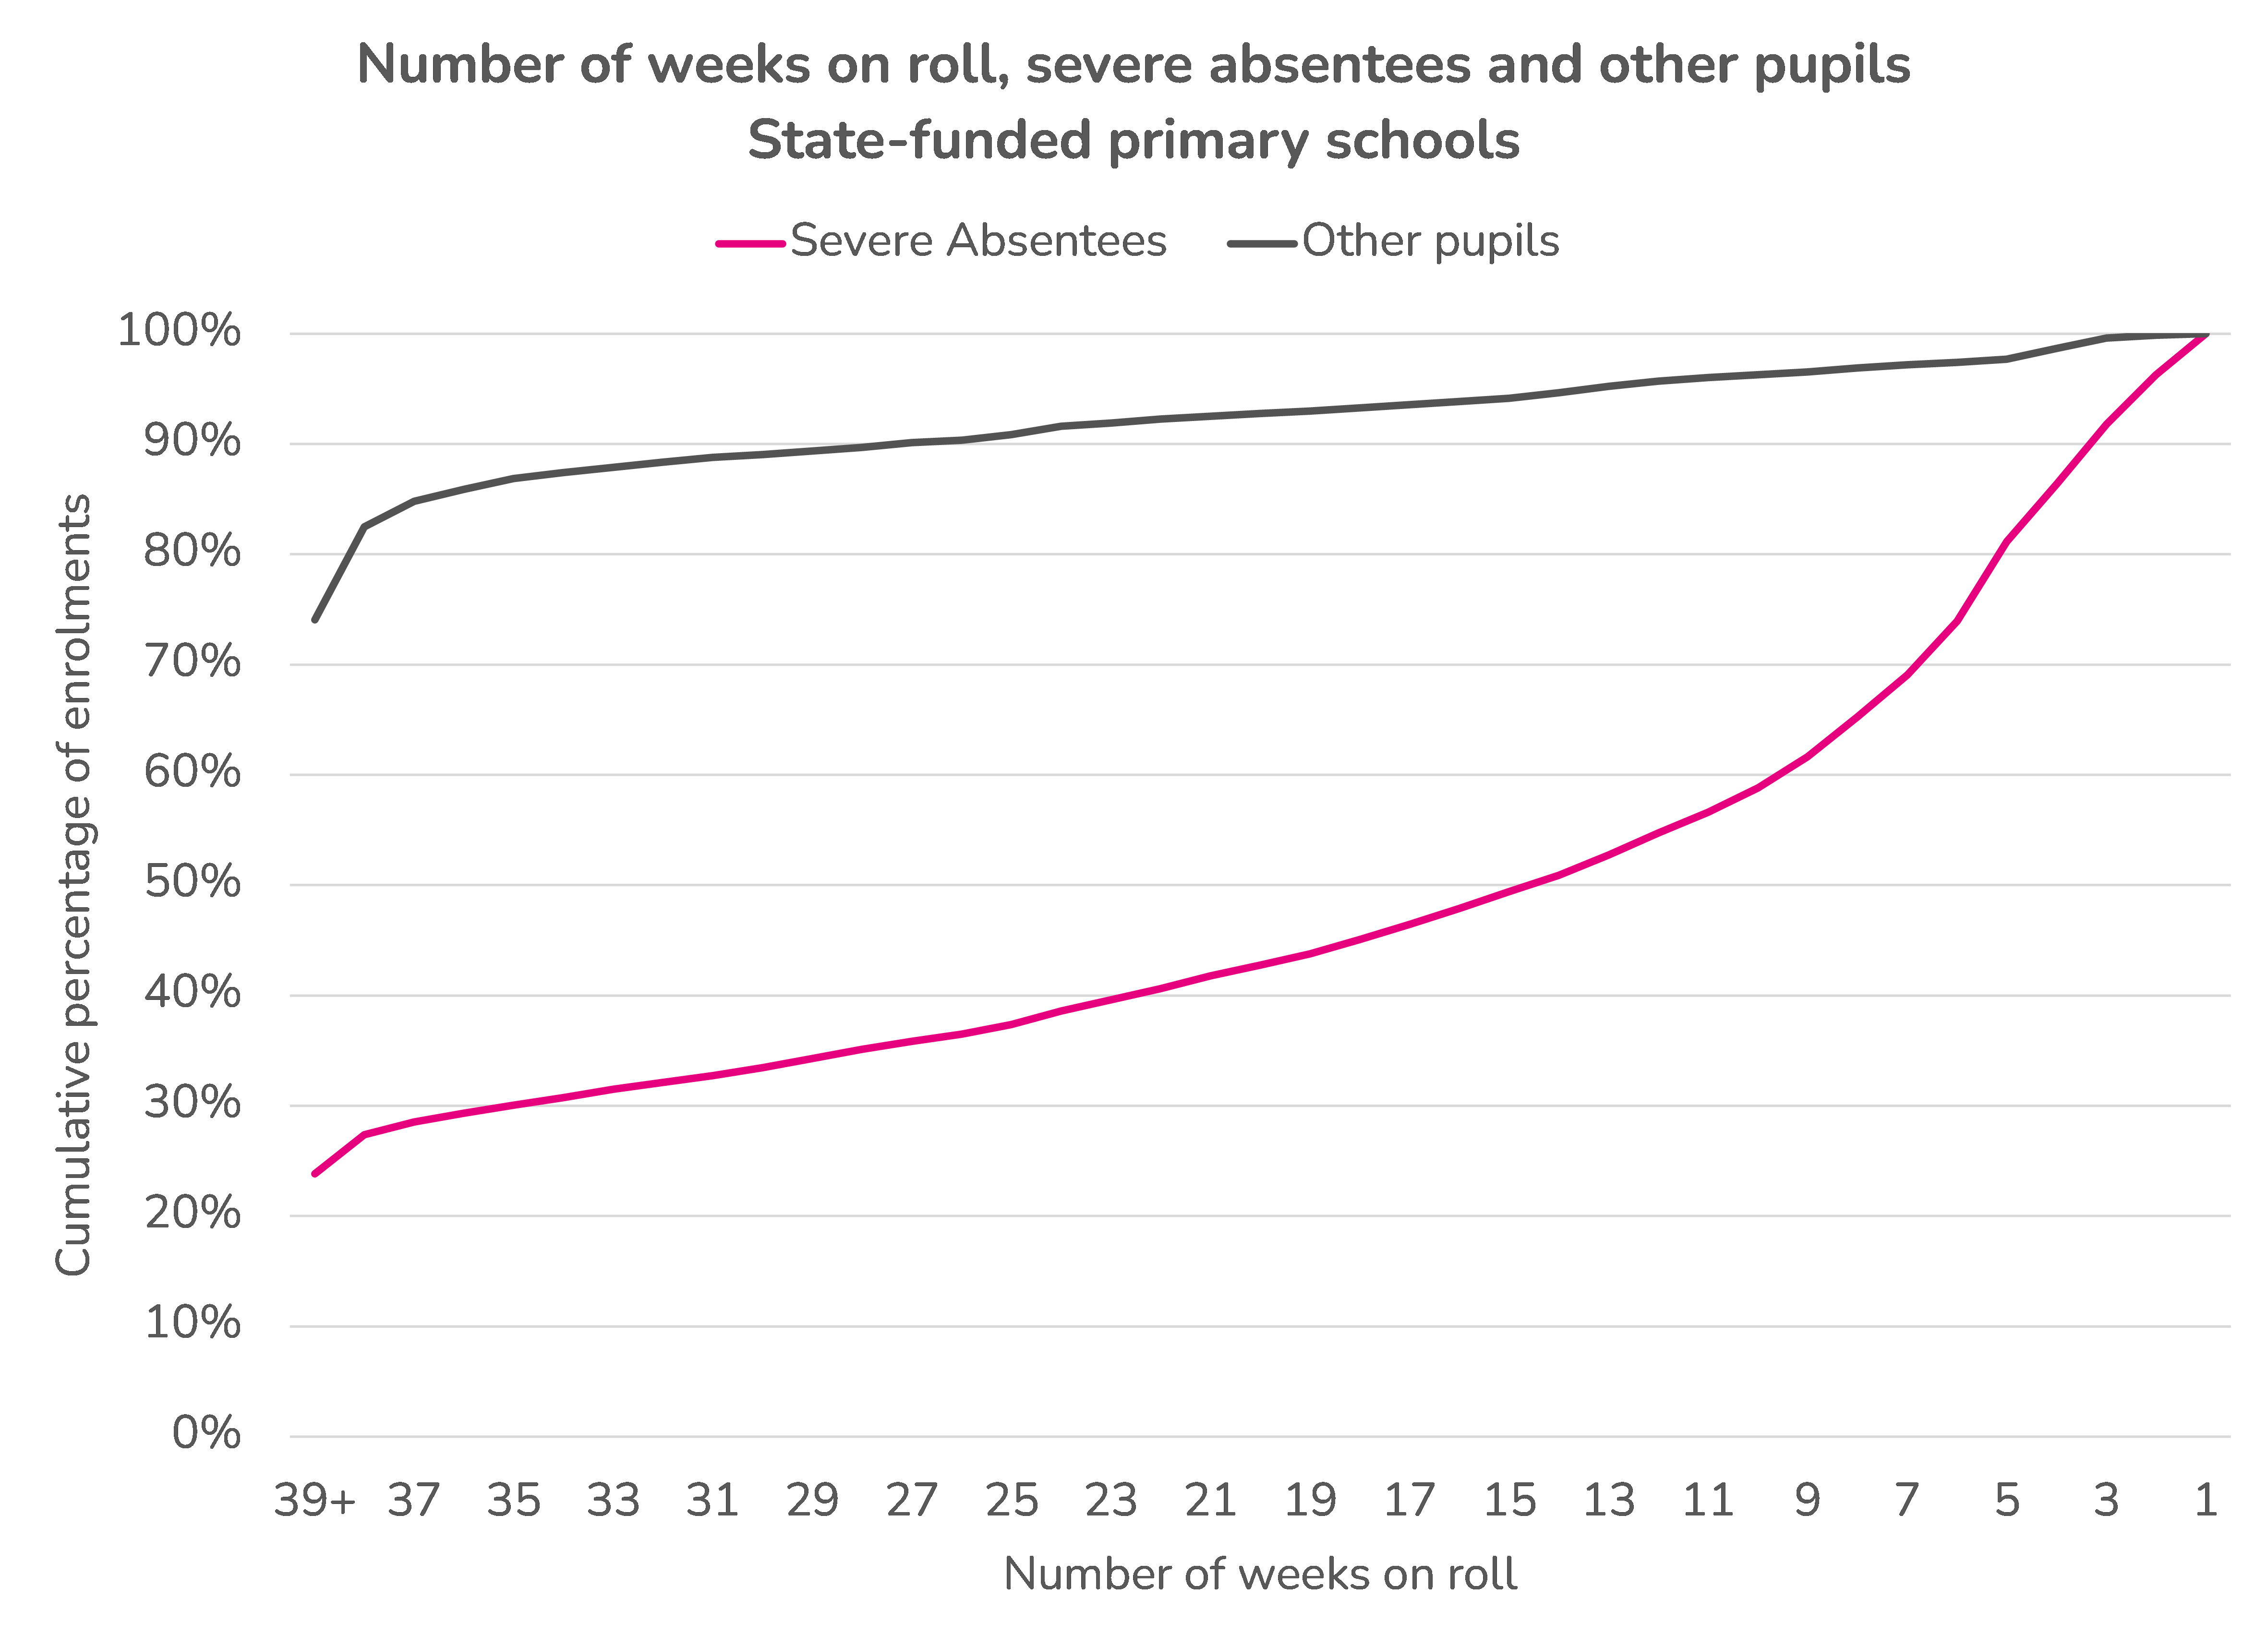
Whereas 74% of other pupils were on roll for 39 weeks[2] or more, this figure was 24% among severe absentees.
Over half of enrolments of severe absentees were on roll for less than 14 weeks.
Repeating the analysis for secondary aged pupils reveals a picture.
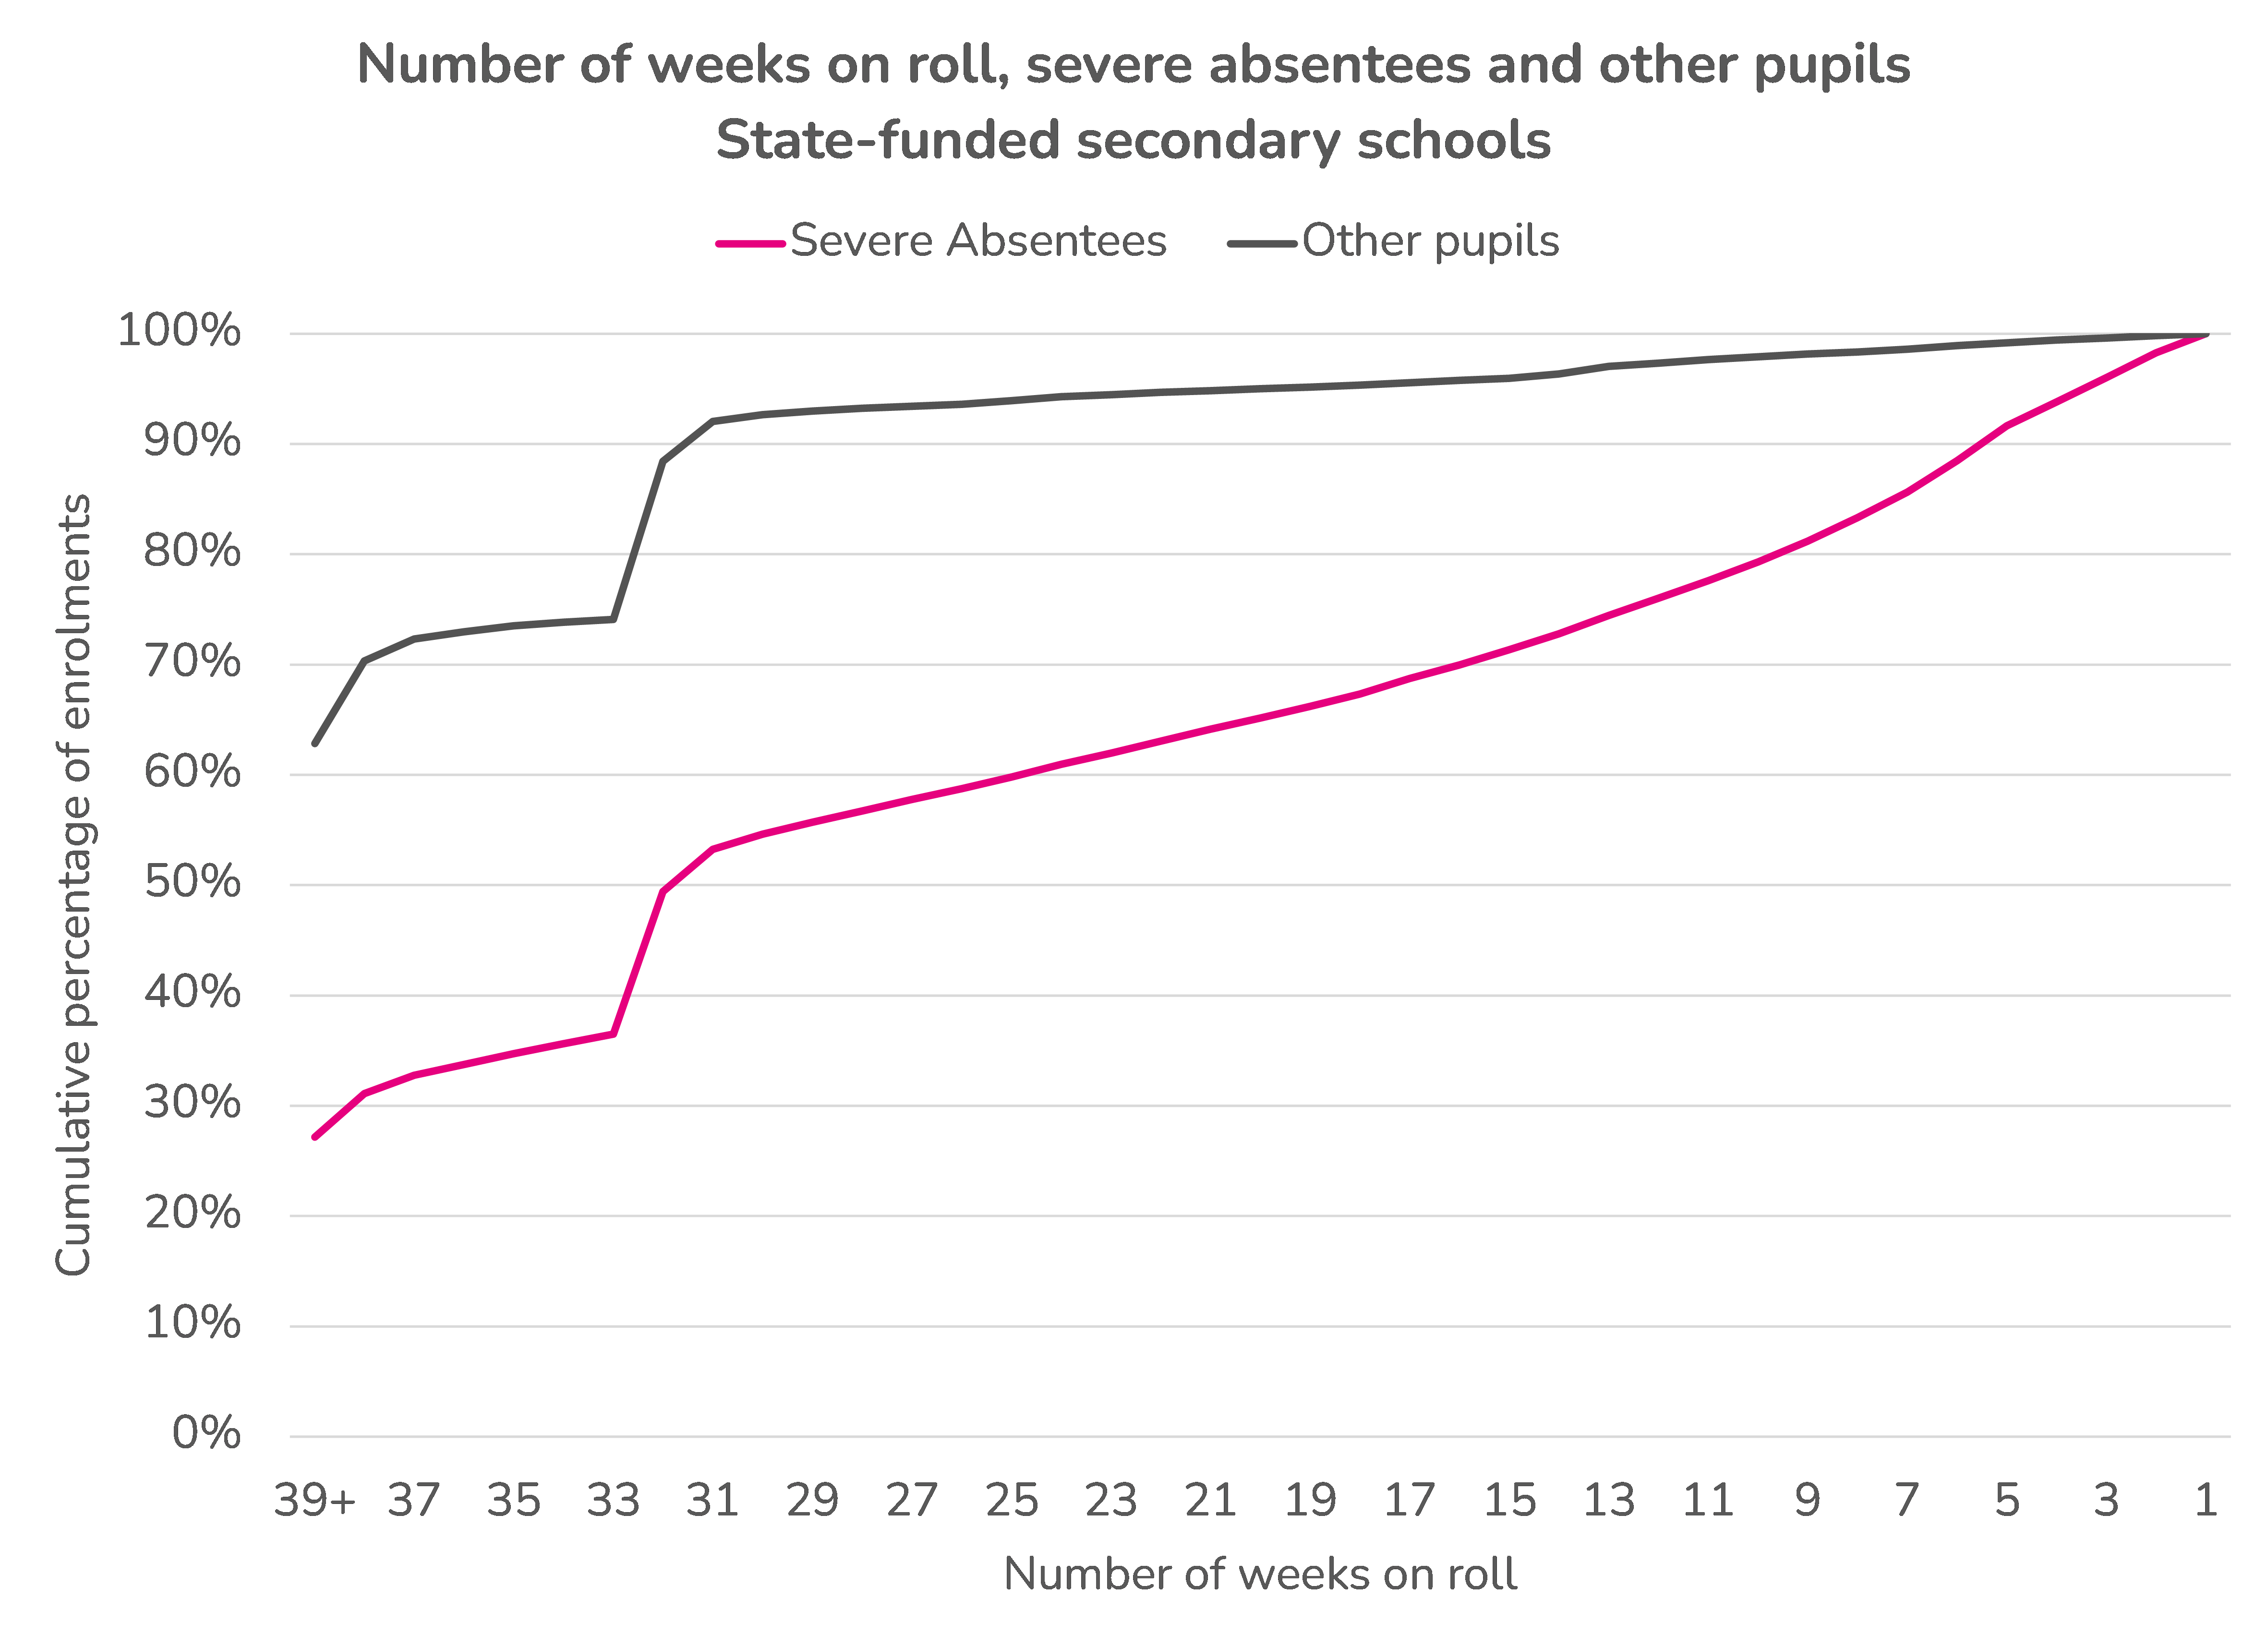
The secondary chart is affected by Year 11 pupils attending fewer weeks (this explains the kinks in the lines).
Nonetheless, we see that severe absentees are less likely to be on roll for the full academic year.
In contrast to the primary chart, there are proportionately fewer short-term enrolments. Just 27% are for less than 14 weeks.
We can only speculate at the moment about the reasons why severe absentees do not seem to be on roll for the whole year. The data seems to indicate that a large proportion are severely absent prior to moving school or after joining a new school. Further analysis of origins and destinations of severe absentees would be useful.
Improving severe absence statistics
Severe absence (and indeed persistent absence) statistics are based on pupil enrolments rather than numbers of pupils.
A pupil who moves school during an academic year will be counted as 2 enrolments, one at each school.
We’ve seen in the analysis here that severe absentees tend not to be on roll for the whole year. Some of these will have enrolments at other schools and others may have emigrated or moved into home schooling.
Yet each enrolment counts equally.
What we could do instead is base the calculations on full-time equivalent (FTE) pupils. Let’s assume for the purposes of illustration that a full-time pupil attends for 370 sessions[3]. If a pupil has 185 possible sessions in a year we would count them as 0.5 FTE.
We can then compare severe absence rates for 2024/25 by year group using the FTE method compared to the current method.
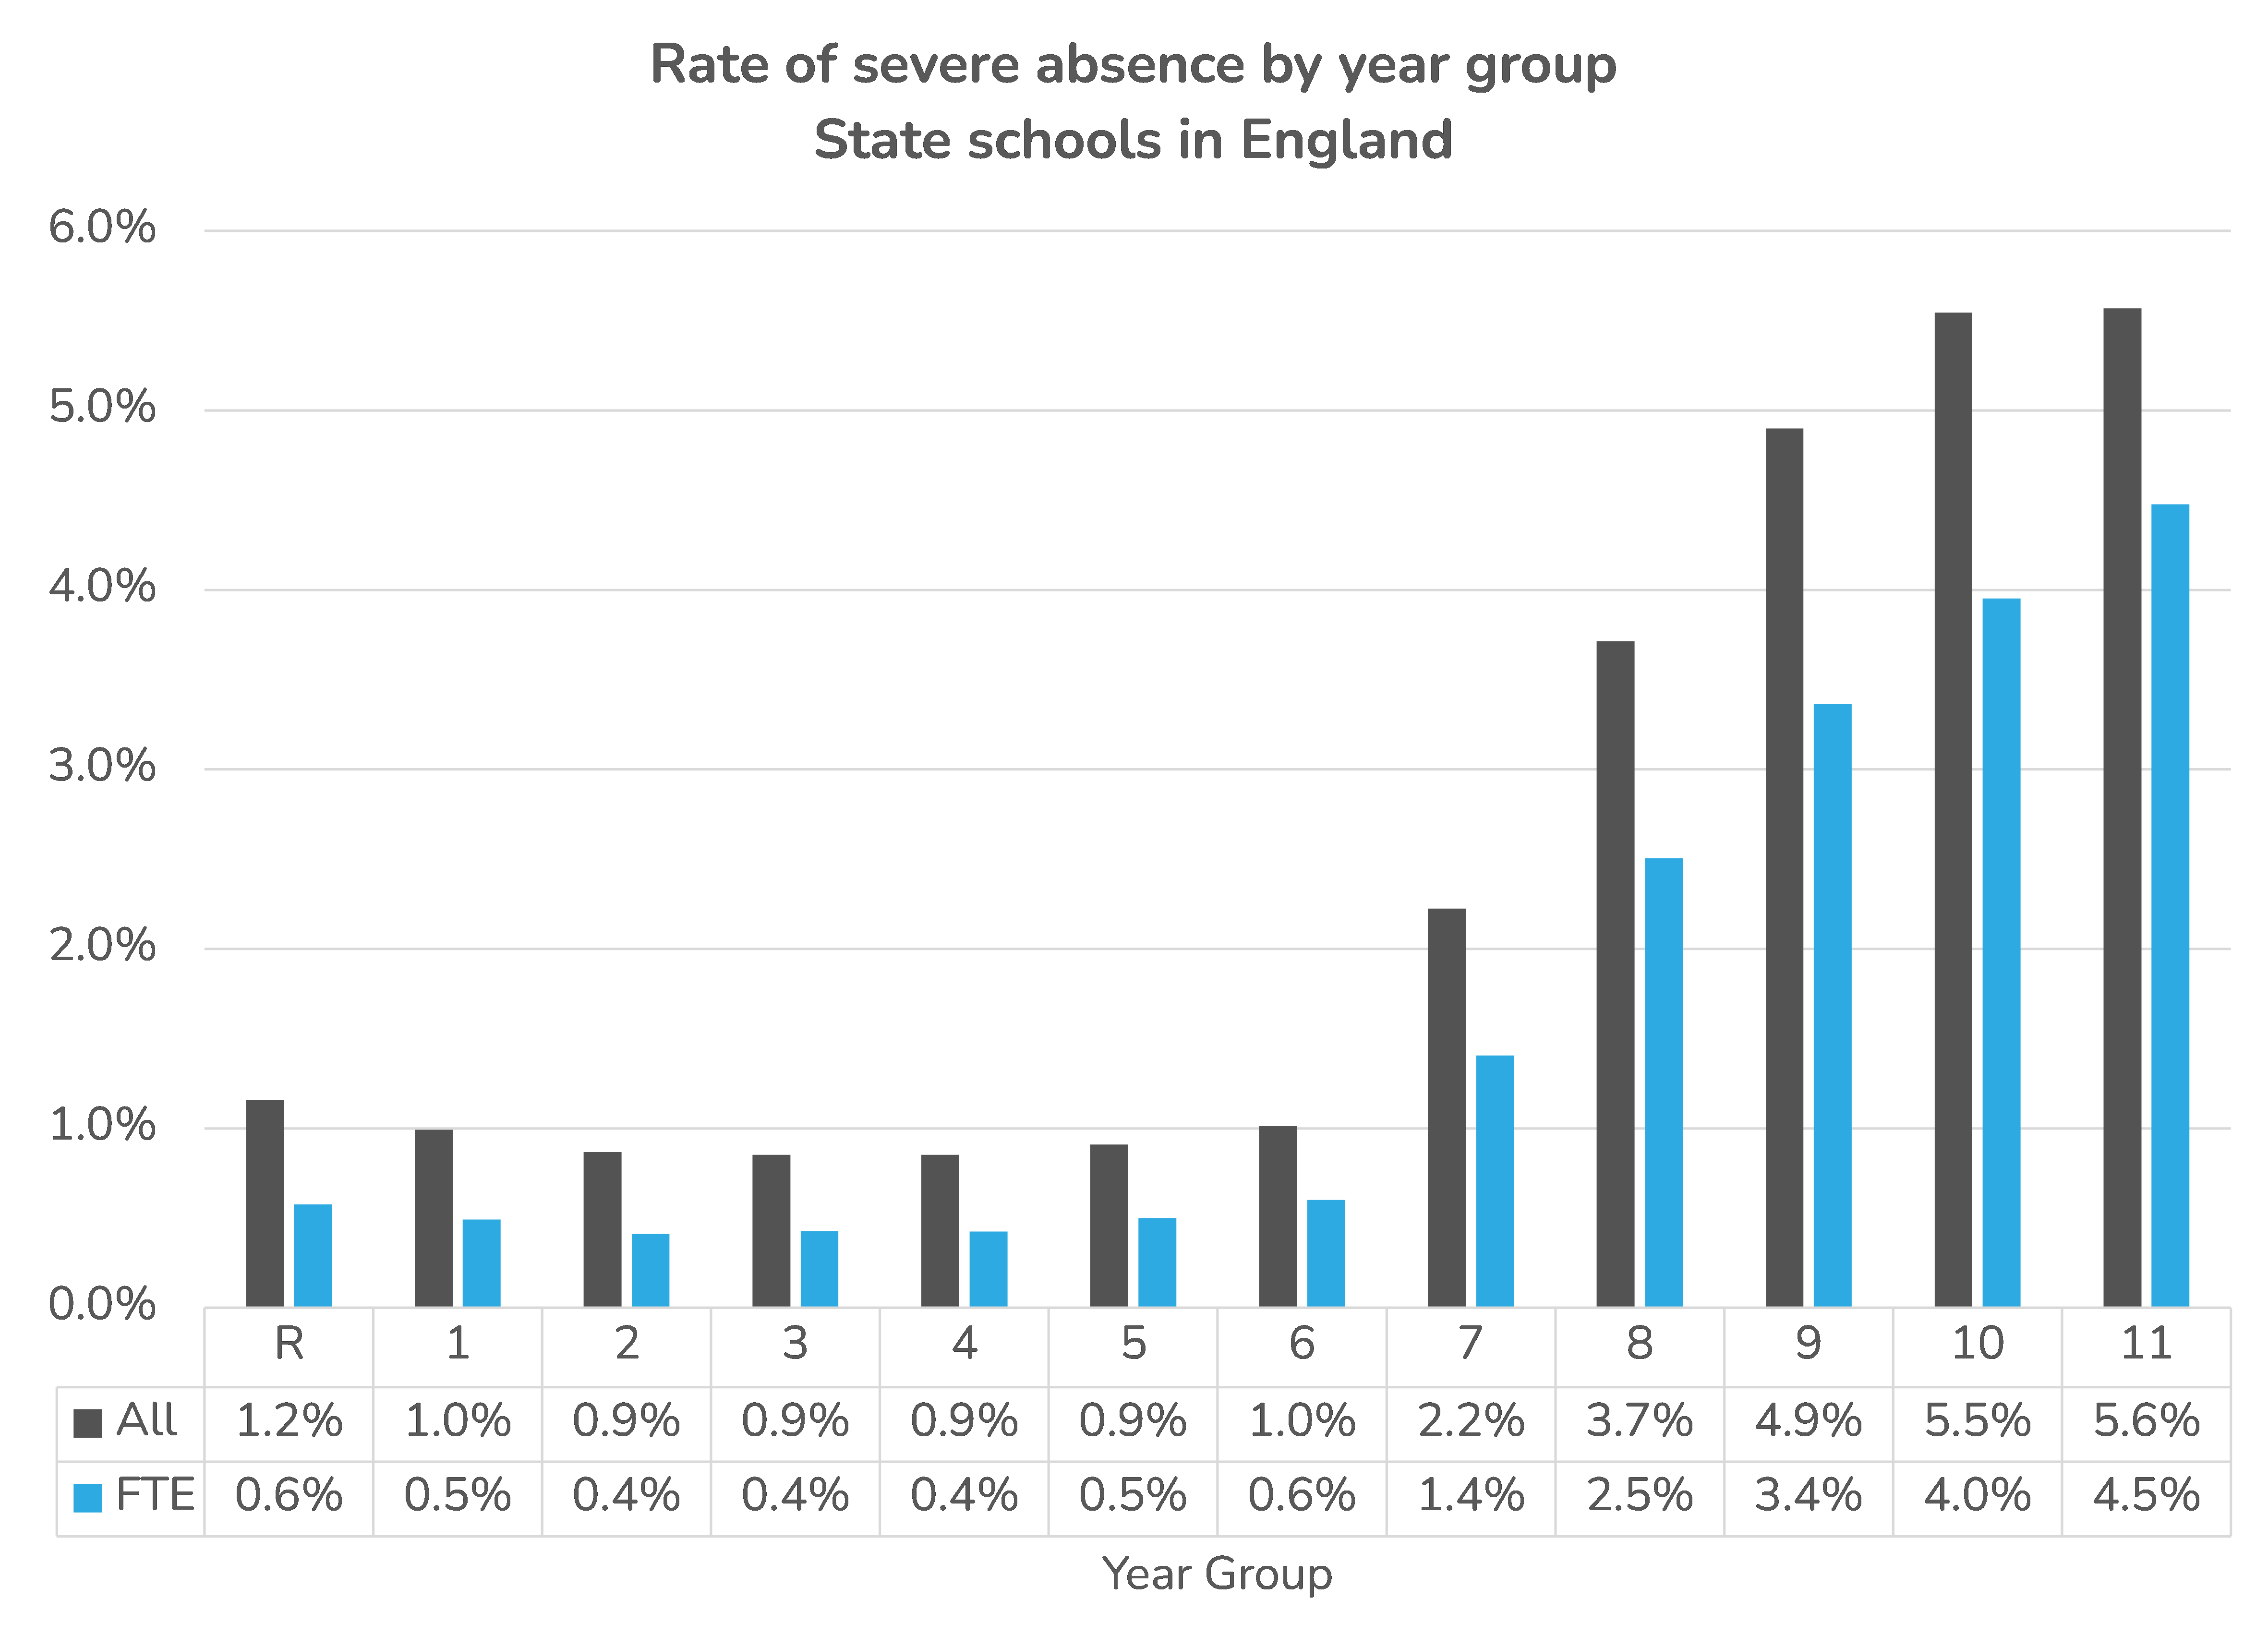
The FTE method results in lower rates of (and therefore lower numbers of pupils with) severe absence. We calculate that there would be 40% fewer cases than currently reported. As the chart above shows, there would be a much greater proportional reduction in primary than in secondary.
That isn’t to say that severe absence isn’t a (growing) problem, just that the scale of it is slightly over-stated.
- There are 2 sessions every school day corresponding to morning and afternoon registrations
- This includes partial weeks (e.g. where some days were holidays)
- In practice we would use a lower figure for Year 11
Want to stay up-to-date with the latest research from FFT Education Datalab? Sign up to Datalab’s mailing list to get notifications about new blogposts, or to receive the team’s half-termly newsletter.


Leave A Comment