The long-awaited Curriculum and Assessment Review (CAR), led by Professor Becky Francis, is due to be published imminently.
For posterity, we thought we would take a look at how take-up of different subjects at Key Stage 4 in state schools has changed over the last 10 years. This will provide a starting point for subsequent analysis of the impact of the review on subject take-up.
We are going to build on work we’ve previously done examining take-up of creative subjects and broadening it out to all subjects, leaving aside English, maths and science which are taken by (almost) everyone.
Data
We use Key Stage 4 data from 2015 to 2024 relating to state-funded mainstream and special schools.
We assign qualifications into 3 groups:
- Qualifications that are considered GCSEs and which are counted in Performance Tables. This includes (obviously) full course and double GCSEs but also includes AS levels and, prior to 2017, some level 1 and level 2 international certificates
- Qualifications that are not GCSEs but which are counted in Performance Tables. These tend to be vocational and technical qualifications (VTQs)
- Qualifications that are approved by Ofqual for pre-16 use but which are not counted in Performance Tables
We also classify qualifications according to their subject group. This means, for instance, treating GCSE in PE and a BTEC Tech Award in Sport as the same subject group. For a full list of subjects and subject groups see the appendix.
In our analysis of subject groups we do not include some subjects with relatively low volumes of entries. This includes community languages and media studies, among others.
We count double GCSEs as two GCSEs.
In our analysis we present entries as a proportion of the total population, rather than number of entries. This is to remove the impact of year-on-year changes in cohort size from the figures.
The underlying data for all the charts is presented in the appendix.
Overall entries
On average, pupils entered 8.8 qualifications (8.2 in GCSEs, 0.6 in VTQs) in 2024, down from 9.6 in 2016.
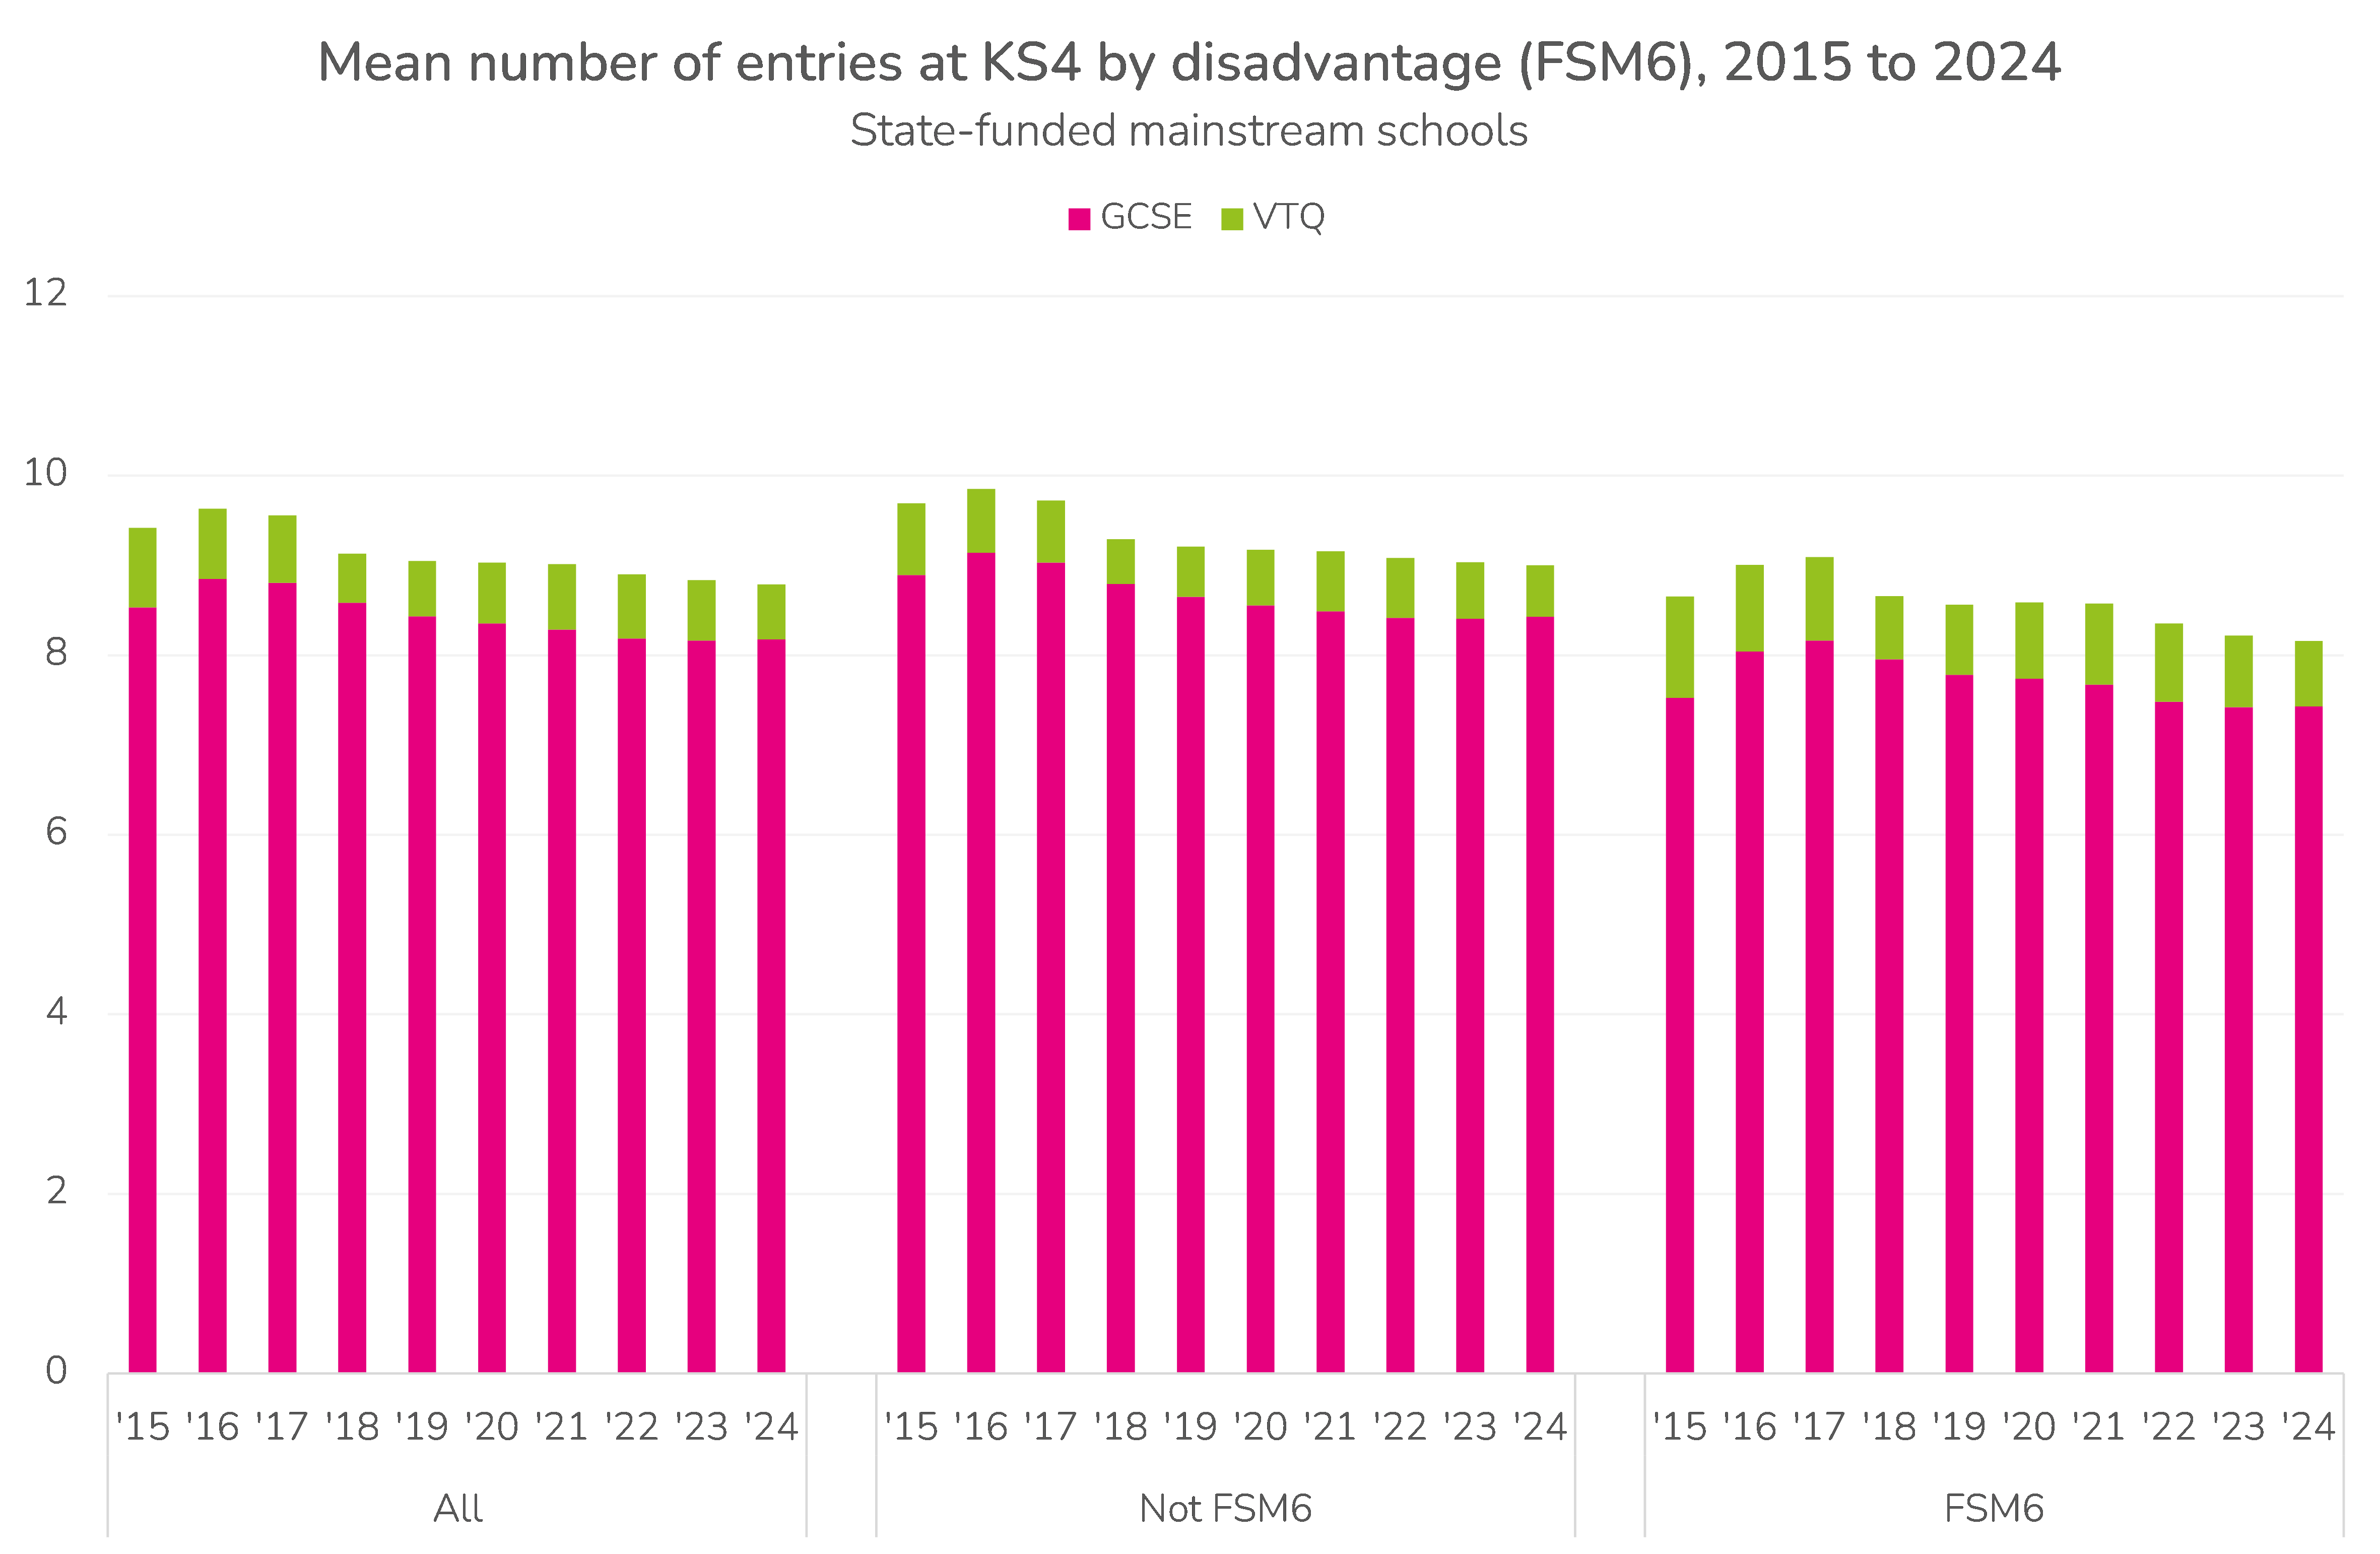
For disadvantaged pupils these figures were 8.2 (7.4 in GCSEs, 0.7 in VTQs) and 9.0 respectively.
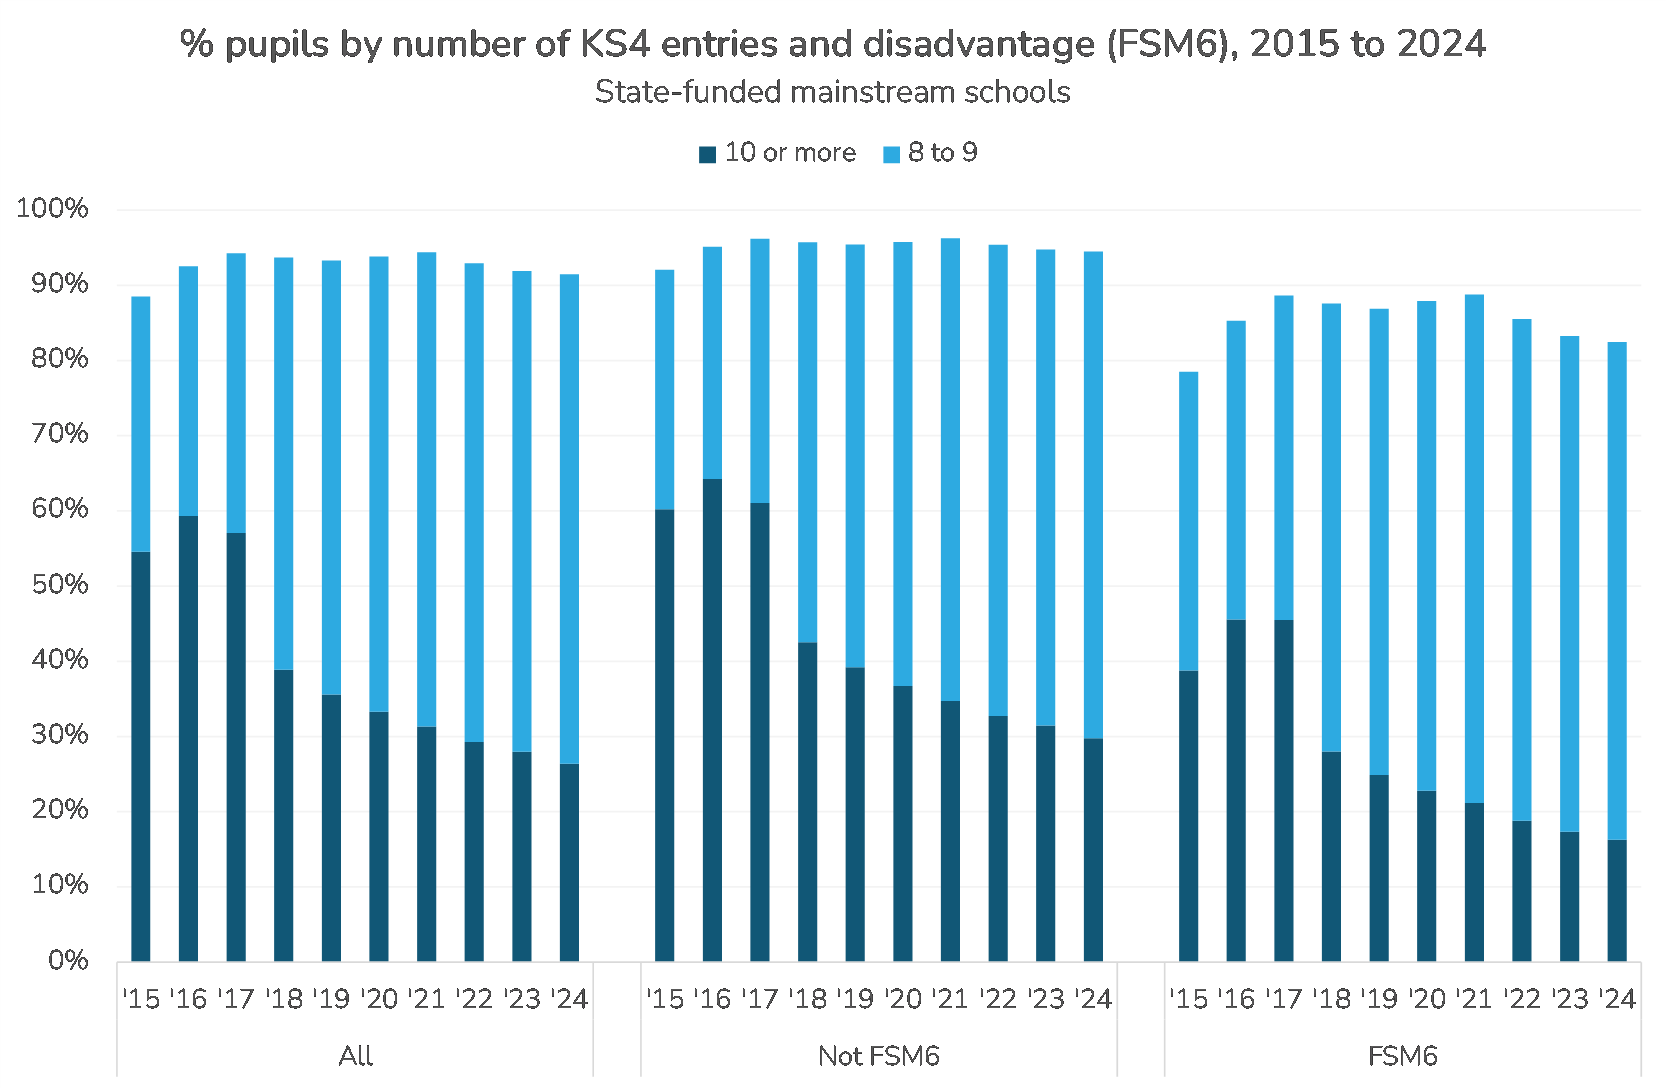
The drop in entries is largely driven by a reduction in the percentage of pupils entered for 10 or more qualifications.
Progress 8 was introduced in 2016, hence we see a degree of change in entry patterns between 2015 and 2016.
Figures broken down by region are available in Table T7 of the appendix. Pupils attending schools in London tend to enter most qualifications overall but enter the least number of VTQs.
EBacc subjects
The English Baccalaureate (EBacc) was introduced in 2010 not as a qualification itself but as a performance metric consisting of achievement in GCSEs in English, maths, science (including Computer Science), humanities and languages (modern and ancient).
The introduction of Progress 8 cemented it in school subject offers since at least 70% of the “slots” in Attainment 8 and Progress 8 are reserved for EBacc subjects[1].

The introduction of Progress 8 led to further take-up of geography and history but not of languages.
Intriguingly, entries in history have tended to be slightly higher than geography. We note that history entries fell between 2020 (when exams were replaced with centre assessment grades) and 2022 while geography entries increased. Since 2022, history entries have increased and geography entries have fallen.
Entries In computer science have been largely flat over the last few years.
Subject groups
We now leave aside EBacc subjects and turn to other subject groups.
We’ve written before how entries in non-EBacc subjects generally have been declining in recent years.
The fortunes of individual subject groups have been mixed over the last few years.
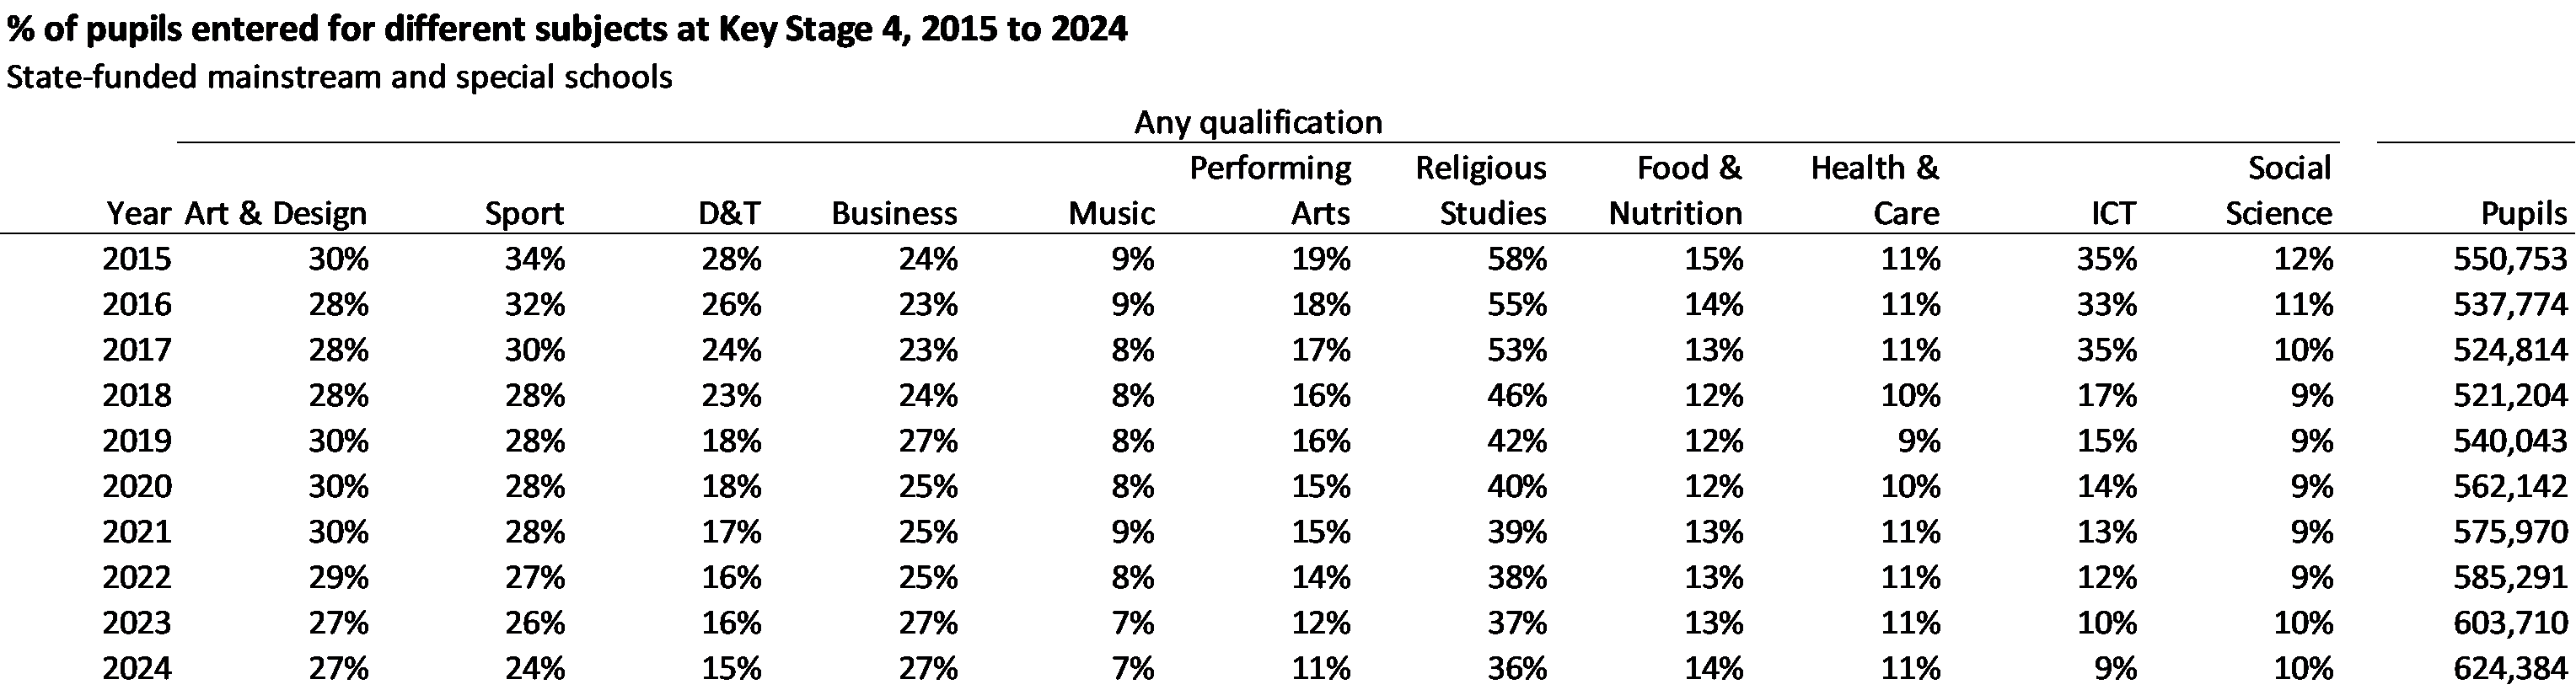
Some subjects have experienced increases in entries, including business and health, care and child development.
Others meanwhile have experienced decreases in entries, notably design and technology (D&T), sport, music, performing arts, religious studies and ICT.
The decline in D&T is a long-standing trend. ICT has declined as a result of a) the lack of a reformed GCSE, b) the introduction of computer science and c) the removal of the European Computer Driving Licence (ECDL) from Performance Tables. Religious studies had previously been a growing subject.
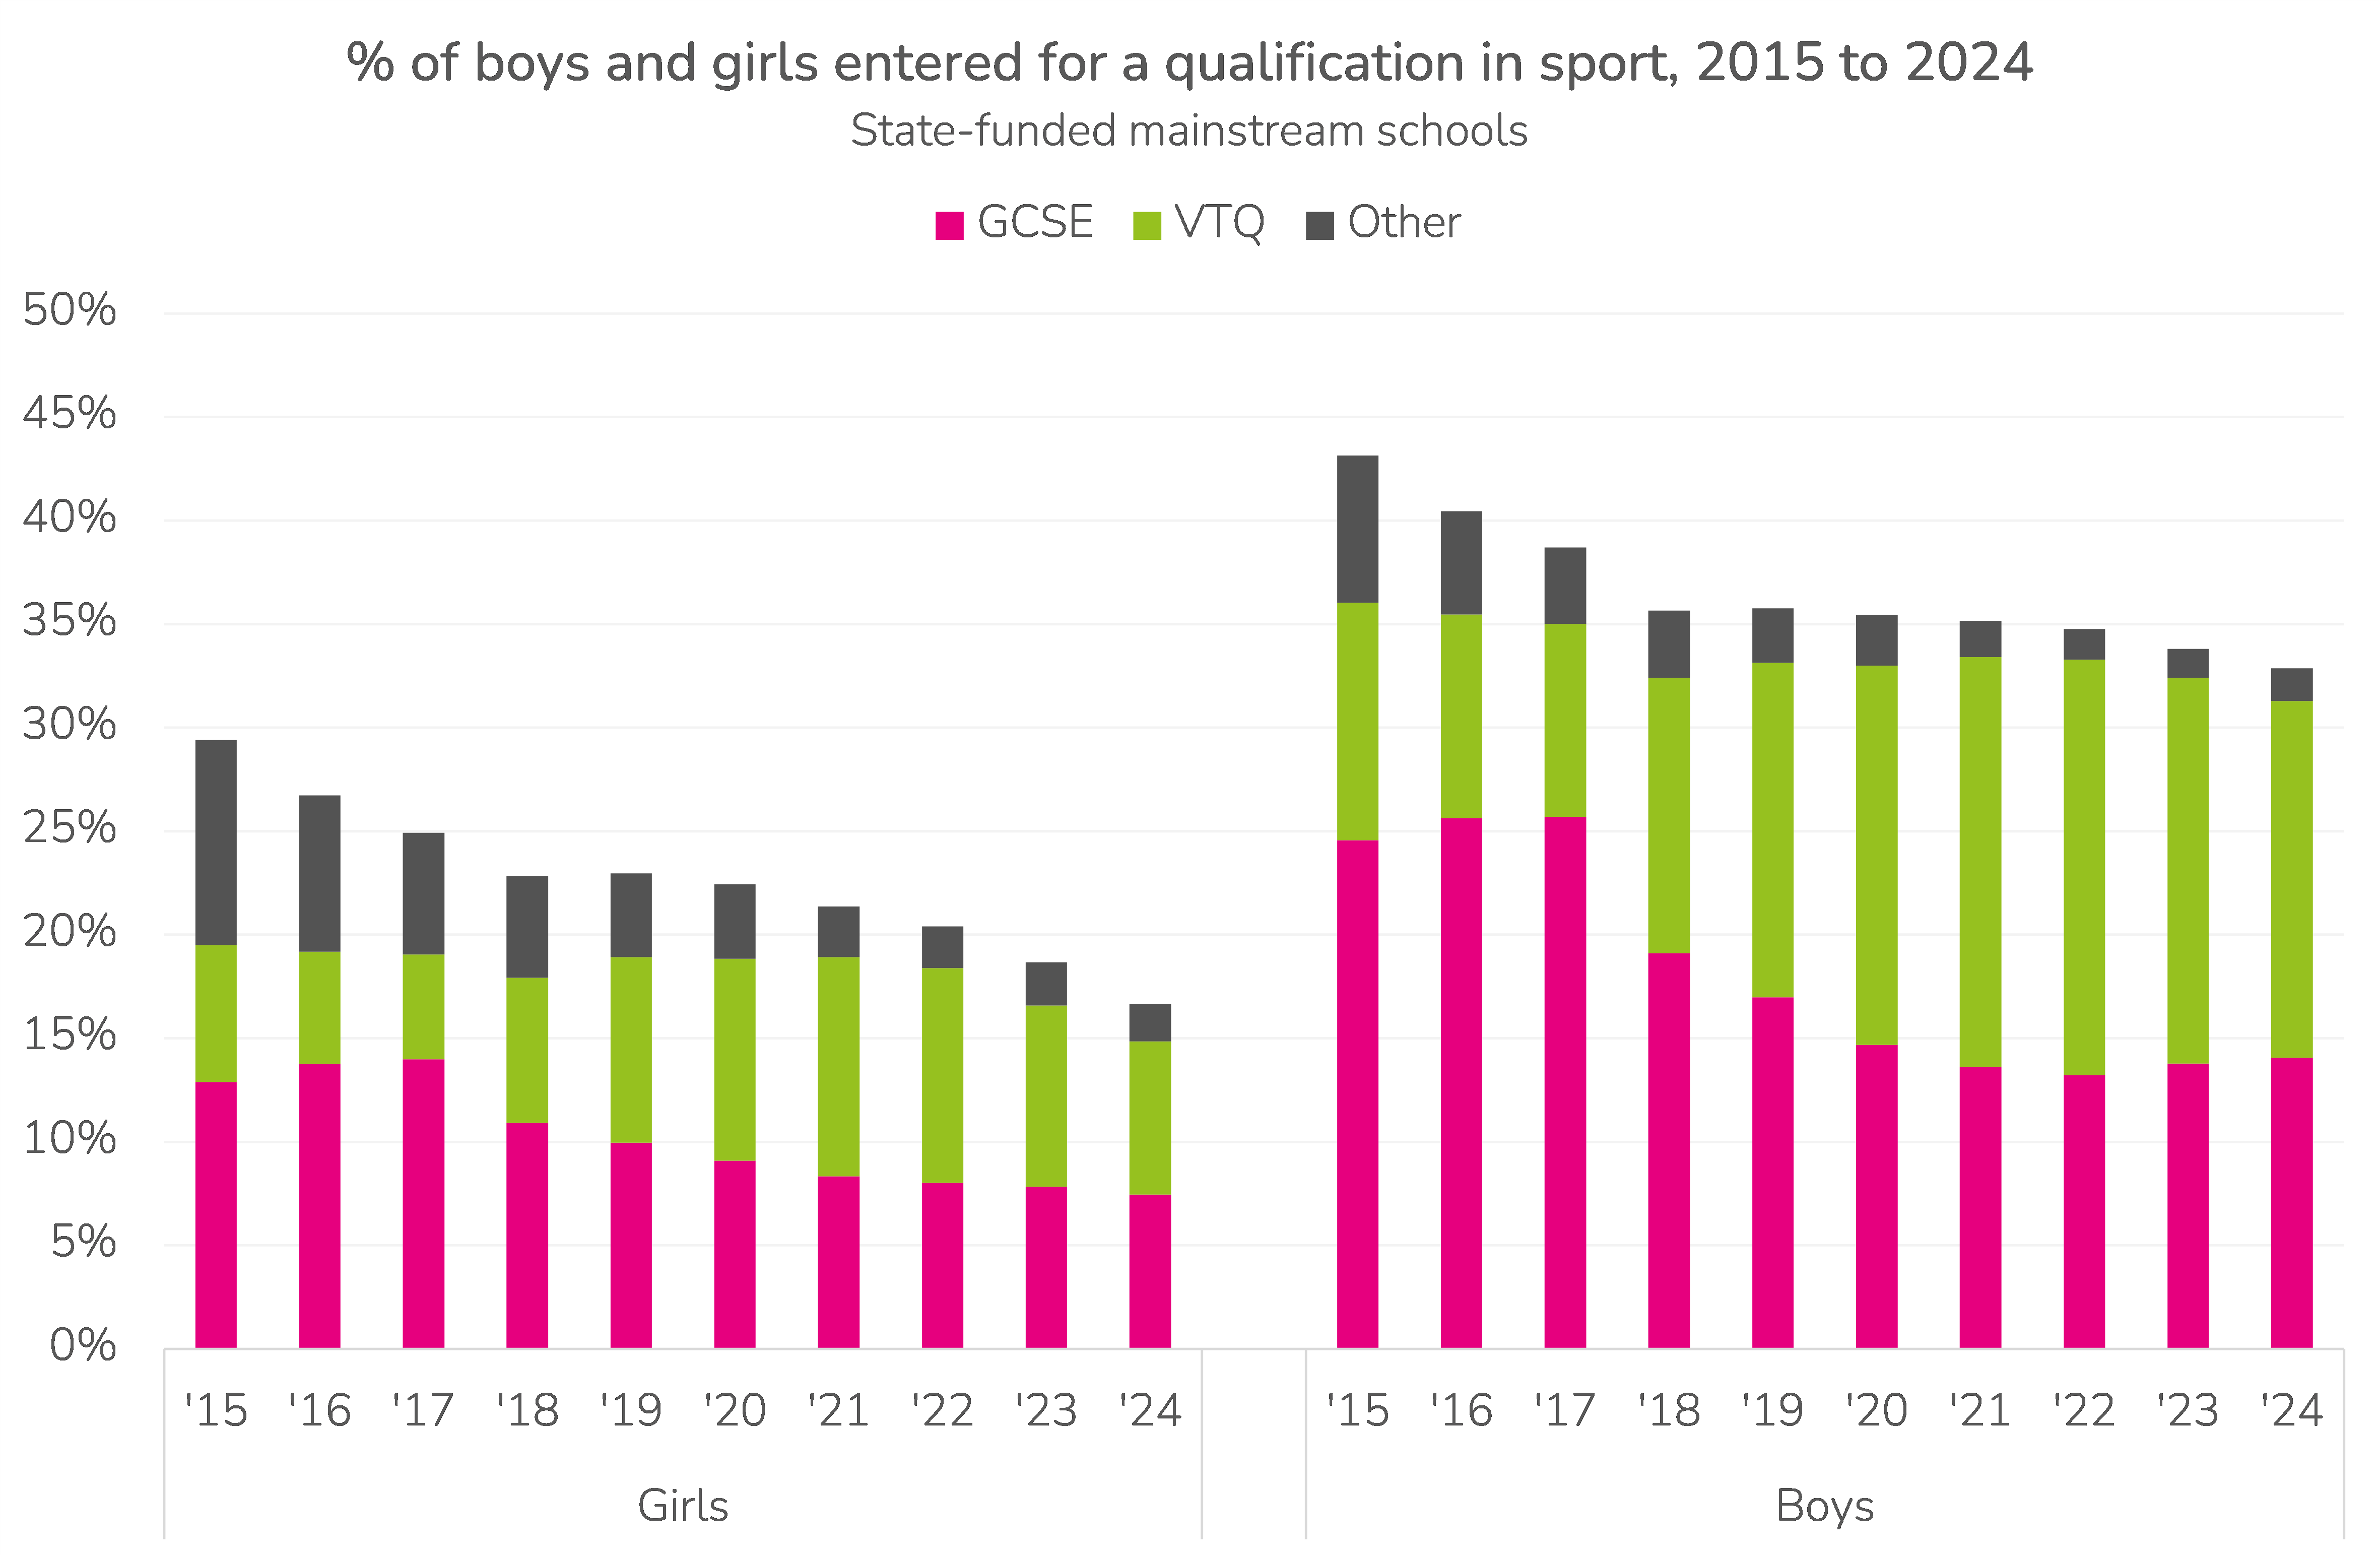
On the other hand, sport has gone somewhat under the radar. Entries in GCSE PE have actually been increasing over the last few years. However, this appears to be a function of a) a larger population of Year 11 pupils and b) a shift from VTQ qualifications to GCSE. This results in a progressively smaller proportion of the cohort taking sport, especially among girls (see Tables T1A and T1F of the appendix).
Schools which don’t offer subjects
The table below shows the percentage of state-funded mainstream schools (of which there are around 3,200) without any entrants in each subject group each year.
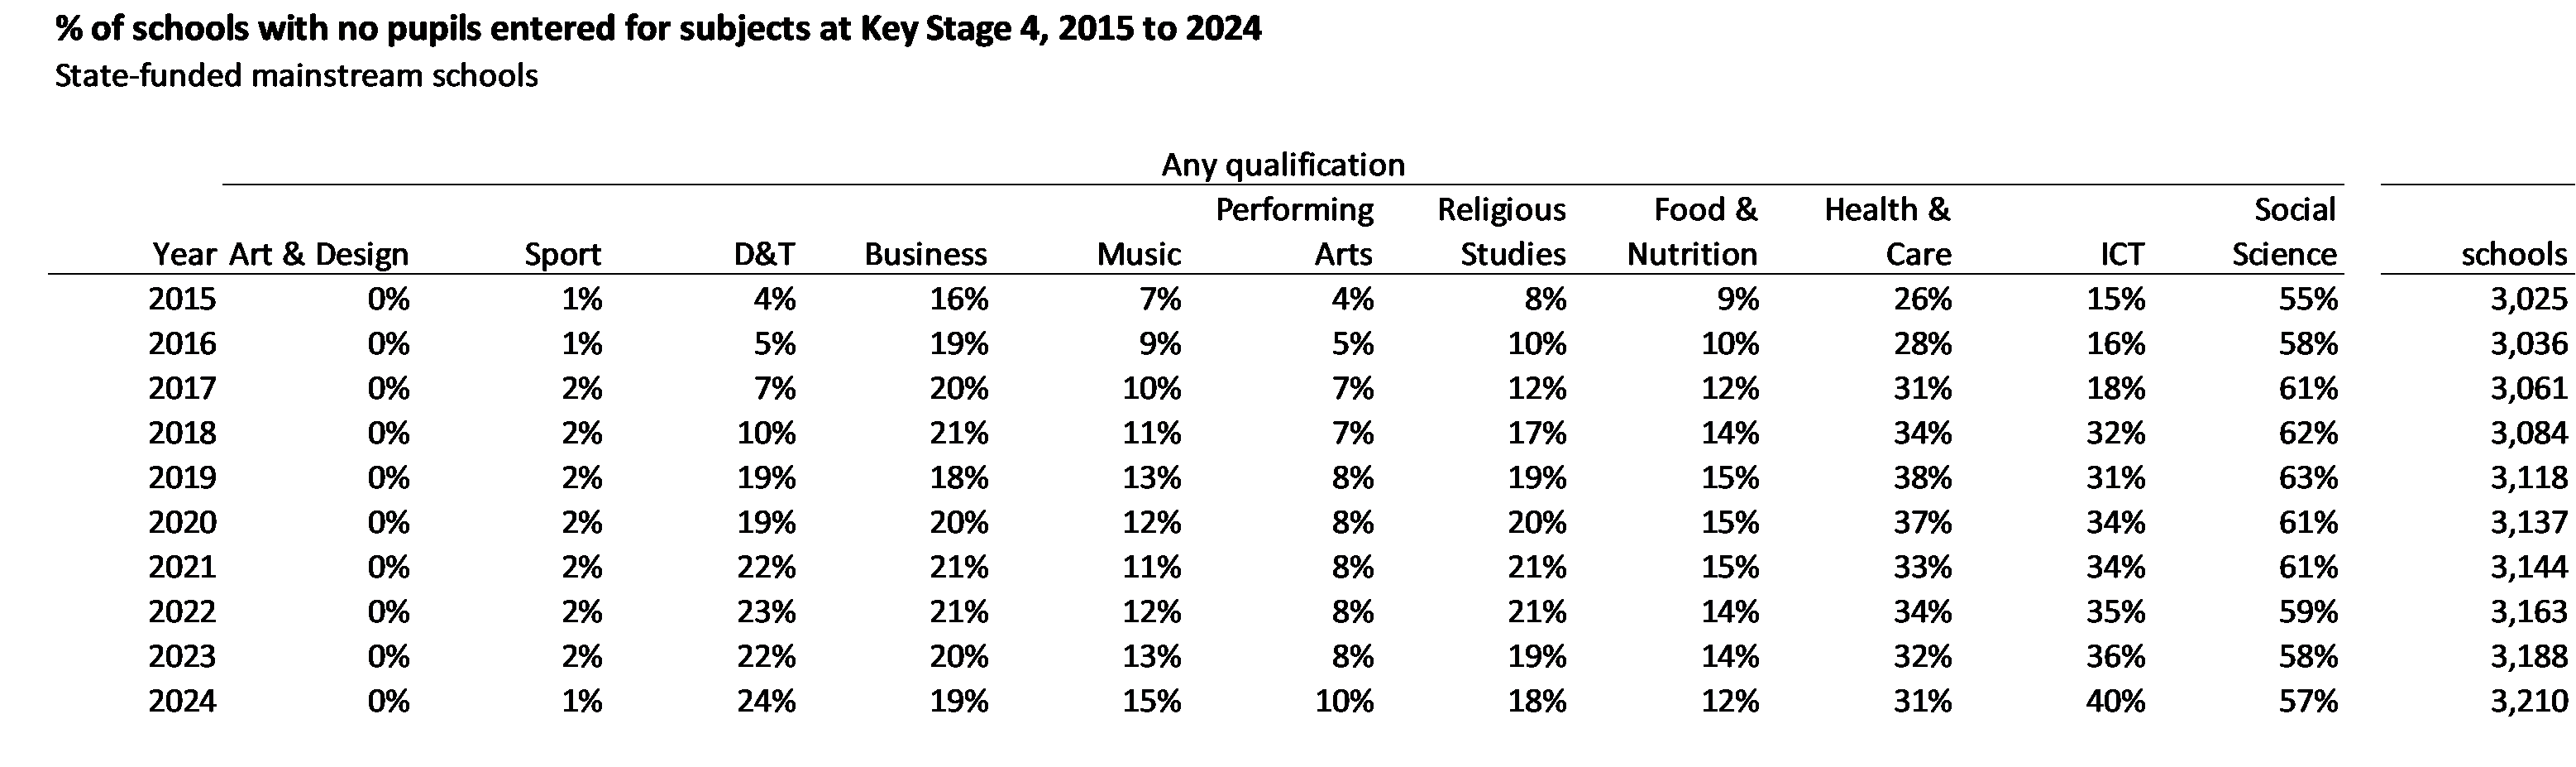
It is rare for schools not to offer art & design and sport.
However, other subject groups have experienced a decrease in the percentage of schools offering them.
This was particularly the case in D&T and ICT.
In our previous work on creative subjects we showed how schools with more disadvantaged cohorts were more likely not to offer creative subjects.
We repeat this analysis in the following chart, allocating schools to quintiles based on the percentage of Year 11 pupils who are disadvantaged[2]. We show the percentage of schools not offering D&T, sport and food and nutrition. We show entries in a) any qualification and b) GCSE only.

The most disadvantaged schools (Q5) are the most likely not to offer GCSEs. Or reversing the double negative, the least likely to offer GCSEs.
However, such schools make greater use of other types of qualification in sport and food & nutrition, hence there are relatively few schools that do not offer these subjects.
But this is not the case in D&T.
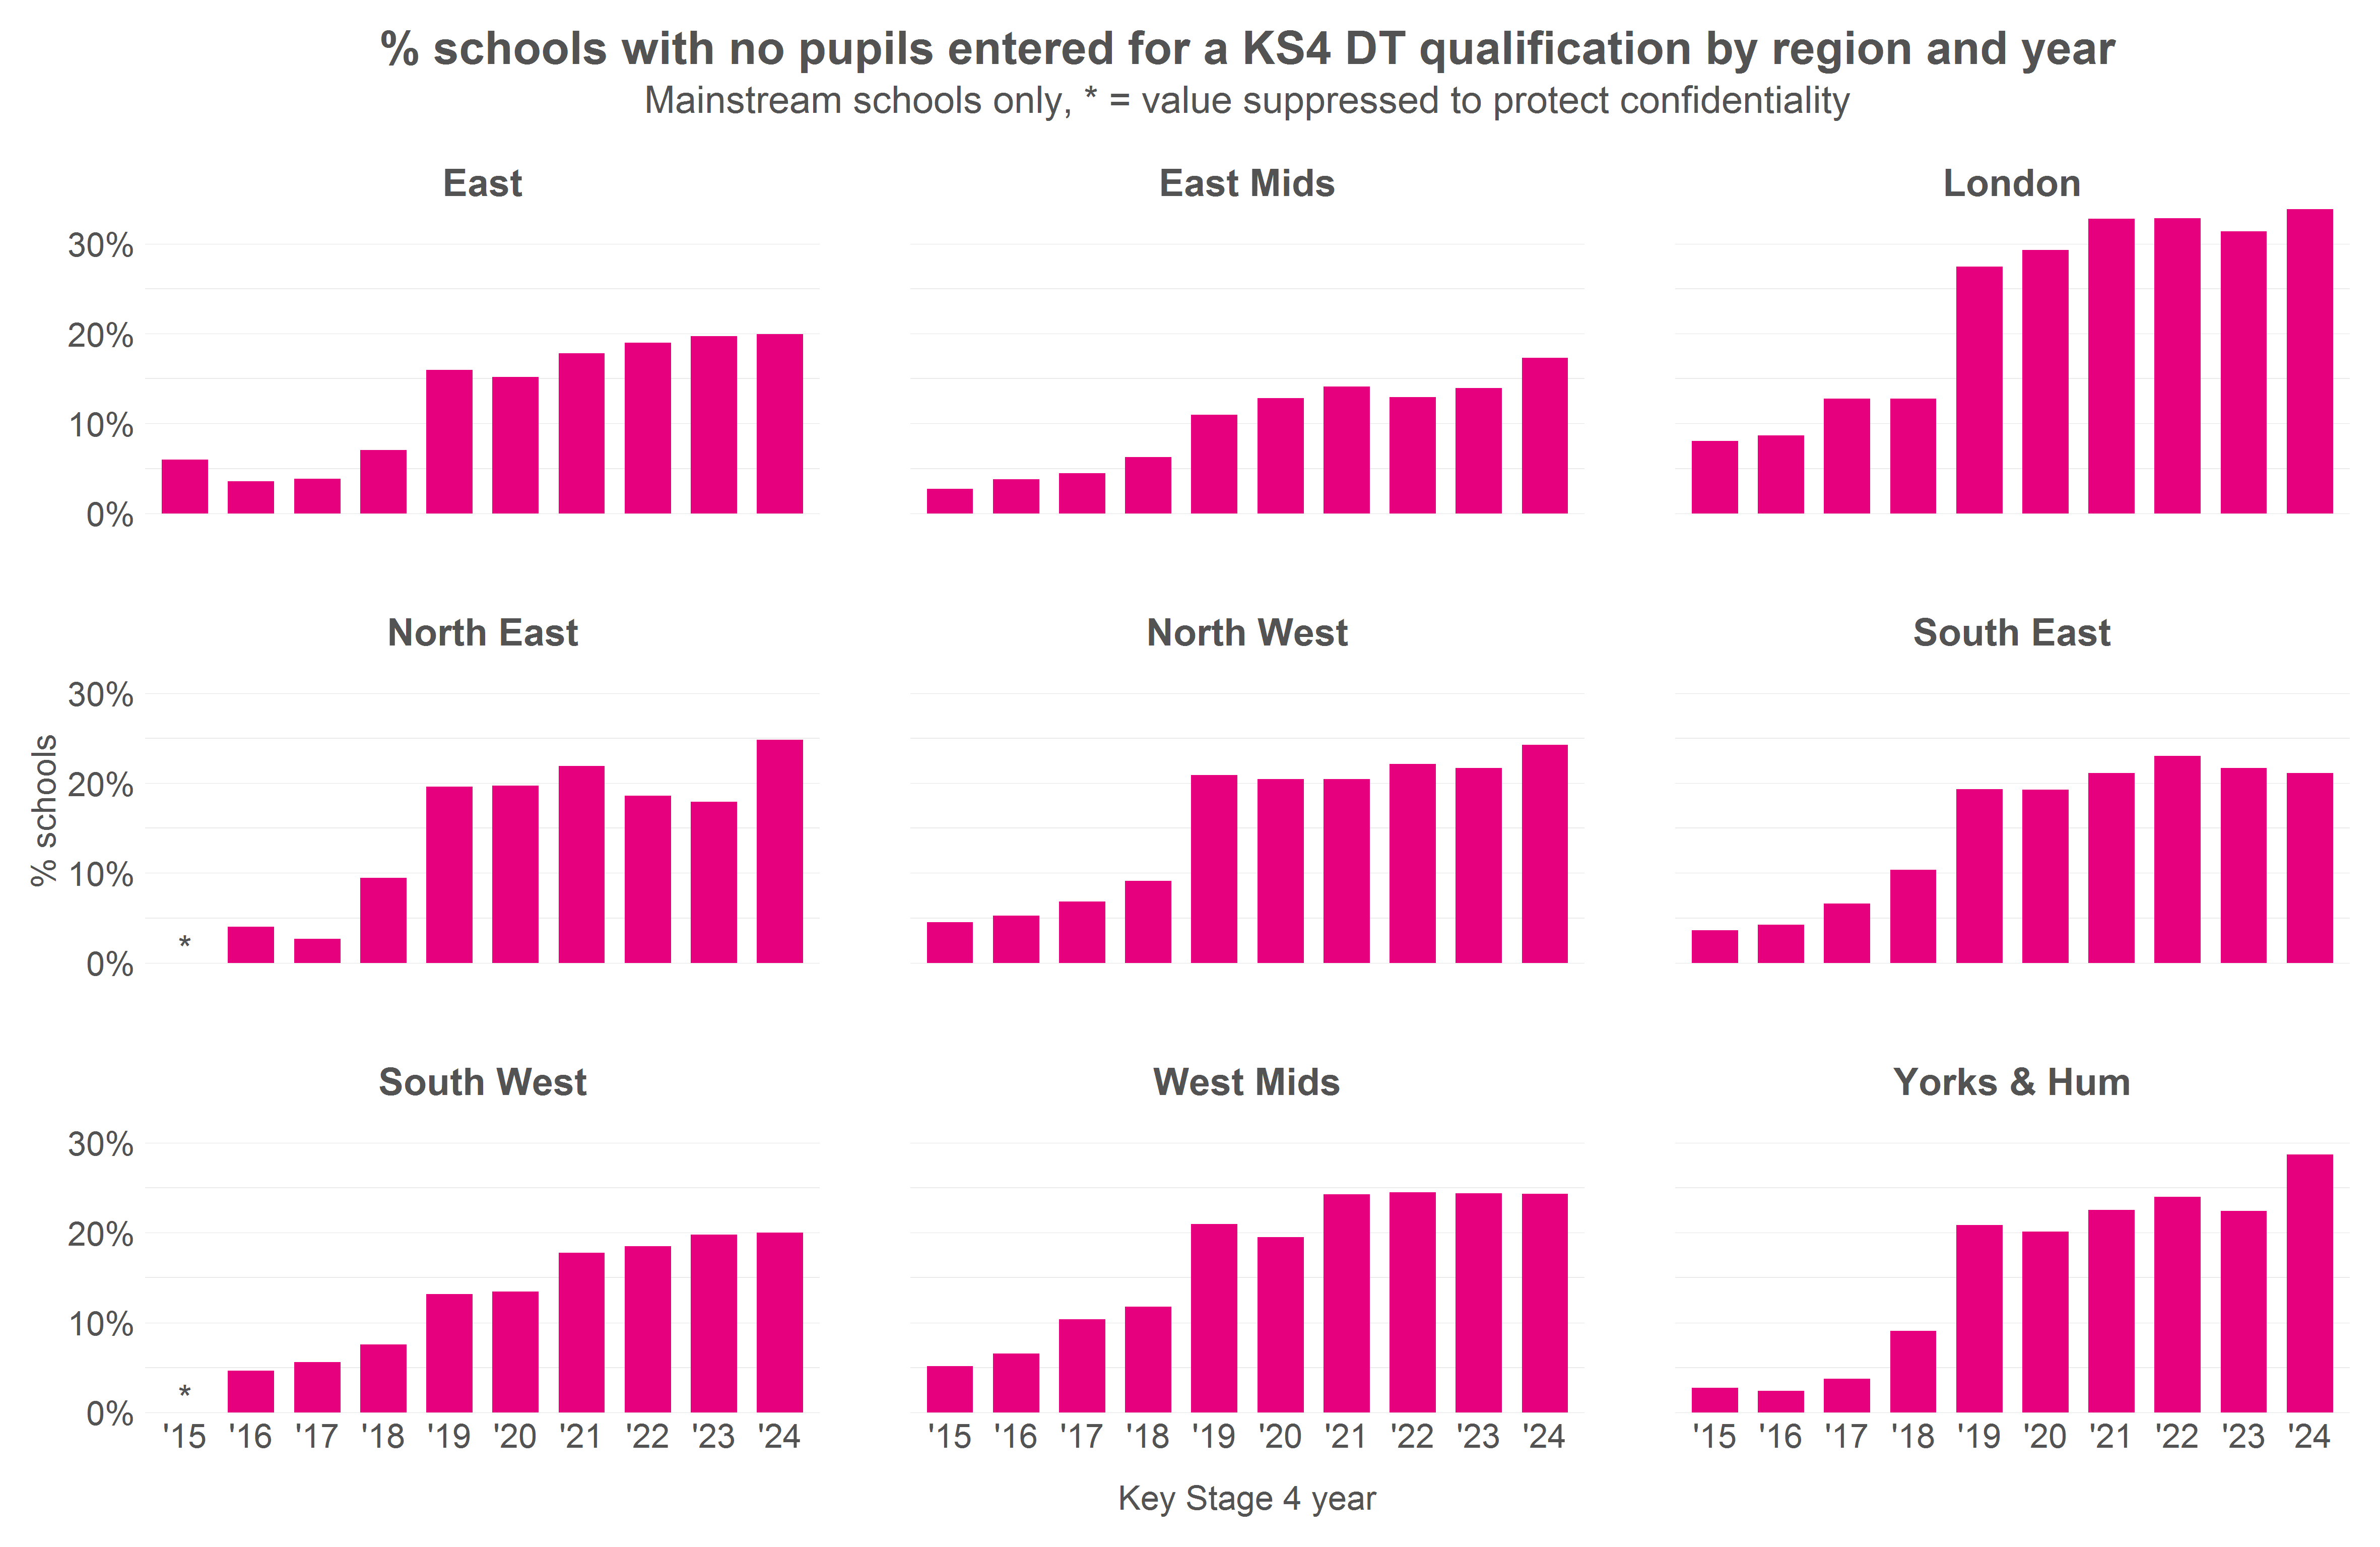
We provide a table of the number of schools not offering each subject in Table T5 of the appendix. London is the now the region with the highest percentage of schools not offering D&T.
Summing up
The last few years has seen a slight decline in the number of qualifications for which pupils are entered at the end of Key Stage 4. While over 90% of pupils are entered for at least 8 GCSEs or equivalent, the proportion entered for 10 or more has fallen from 59% in 2016 to 26% in 2024. This raises the question, which we are not going to answer, of how many qualifications is the right amount.
The impact of this reduced offer has been felt in some subjects more than others, notably D&T, ICT, religious studies and PE/ sport. Numbers of schools not offering these subjects at all have risen.
Schools serving disadvantaged intakes are more likely not to offer GCSEs in many subject areas, either offering VTQ alternatives or not offering the subject at all.
- For an explanation of how Attainment 8 and Progress 8 are calculated, see the DfE accountability guidance
- Eligible for free school meals in the last 6 years
Want to stay up-to-date with the latest research from FFT Education Datalab? Sign up to Datalab’s mailing list to get notifications about new blogposts, or to receive the team’s half-termly newsletter.


While over 90% of pupils are entered for at least 8 GCSEs or equivalent, the proportion entered for 10 or more has fallen from 59% in 2016 to 26% in 2024. This raises the question, which we are not going to answer, of how many qualifications is the right amount.
In the “8 GCSEs,” does this statistic double count Maths, English (lang/lit) and Science as two GCSEs each? Meaning 8 GCSEs only leaves two other option choices?
Yes, double science counts as 2, English counts as 1 for lang and 1 for lit but maths only counts for 1.
Worth being aware that some schools still offer 3D Design but have moved to use the Art & Design specifications rather than the the pure DT specifications. This may skew figures slightly although the trend remains.