




After we published our annual GCSE results day post, I like to take a look at the coverage in the papers to see what others have picked out. And this year I was alarmed to see that the BBC coverage seemed to contradict ours.
We agreed that the gender gap in GCSE grades narrowed this year, and that boys’ grades had increased slightly. But the BBC said that girls’ grades had dropped, while we said that there was no change.
Surely we couldn’t both be right?
But a closer look at the data proved otherwise.
Another day, another dataset
The key to the mystery is that the Joint Council for Qualifications, the main source for exam results data on results day, actually publish more than one dataset.
As well as UK-wide results, they publish separate results for England, Wales and Northern Ireland. And as well as results for all entrants, they publish results broken down into three groups by age: 15 and under, 16-year-olds and 17 and over.
Here at Datalab, we usually restrict our analysis to results for 16-year-olds in England. The BBC generally uses UK-wide results for all ages. This is where the disparity came in.
So which version is correct? And how much difference does it make which we choose?
Exploring the differences
Let’s take a look at the figures for both versions to get a sense of the difference we’re talking about.
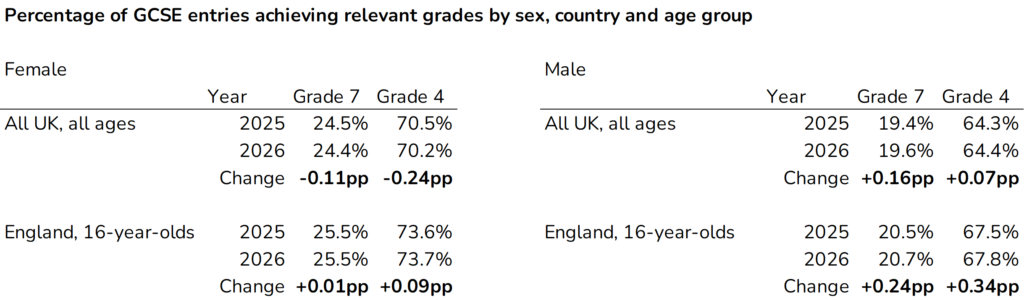
First, it’s worth pointing out that the changes are very small – all less than 0.5 percentage points. As are the differences in those changes.
Nevertheless, there are differences between the two sets of figures that led us and the BBC to draw opposite conclusions. The UK-wide all ages figures show that girls’ grades dropped slightly at both grade 7 and grade 4 compared to last year, while the England only 16-year-old figures show a slight increase in girls’ grades, albeit an extremely small increase that rounds to zero at grade 7.
The England only data for all ages show a similar pattern to the UK-wide all ages data – that is, a small fall in grades for female pupils compared to last year.
This is no surprise, because this year 92% of GCSE entries came from pupils at school in England. So the UK-wide figures very closely track the England only figures. The differences that we’re seeing between UK-wide all ages figures and figures for England only 16-year-olds are driven by differences between the age groups rather than by differences between UK-wide and England only.
All ages vs 16-year-olds in England
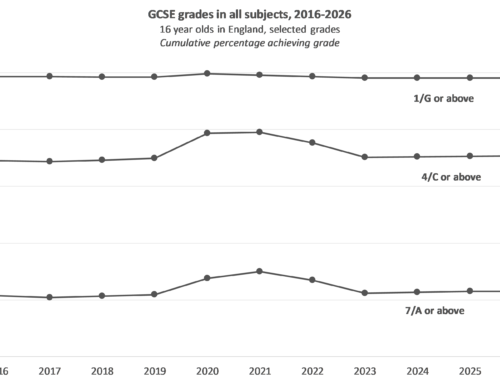
We’ll now look at how the figures for all ages compare to those for 16-year-olds, focusing on entries from female pupils in England only. We’ll see how attainment each year compares to 2018, which is the first year that data separated by country and age was routinely published.
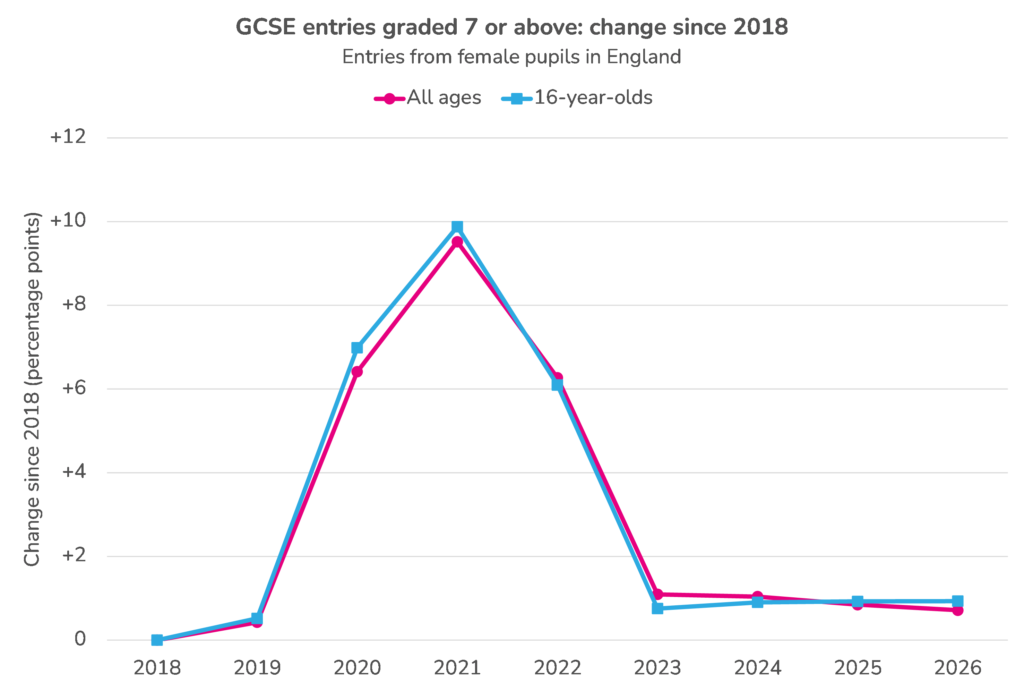
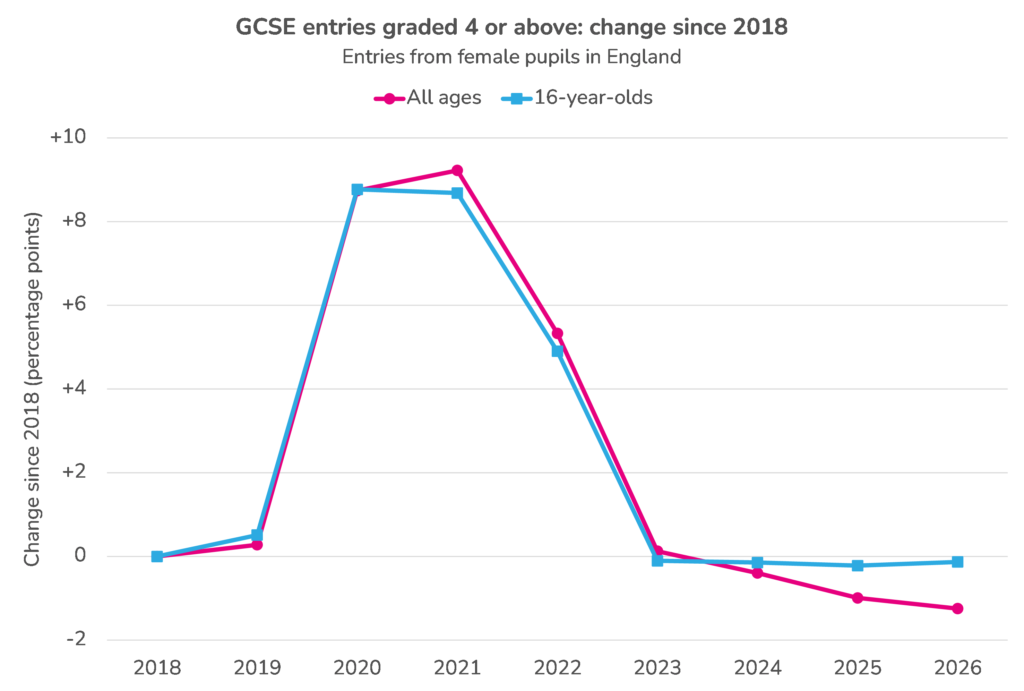
Here we can clearly see the difference between the two datasets, especially at grade 4. Since 2023, the all ages dataset shows a fall in the percentage achieving a grade 4 or above, while the 16-year-old dataset shows little to no change.
So what is behind the difference between the two datasets? My first thought was that it was something to do with gender differences in resit grades post-16. But it actually seems to be simpler than that.
Let’s look at how the two datasets compare for entries from male pupils.
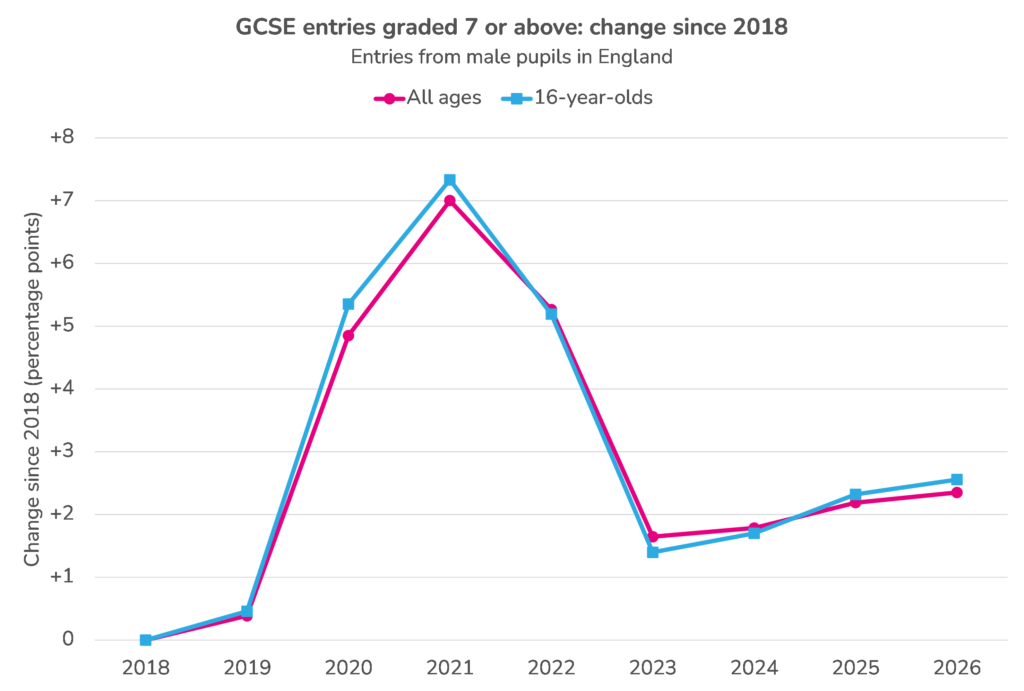
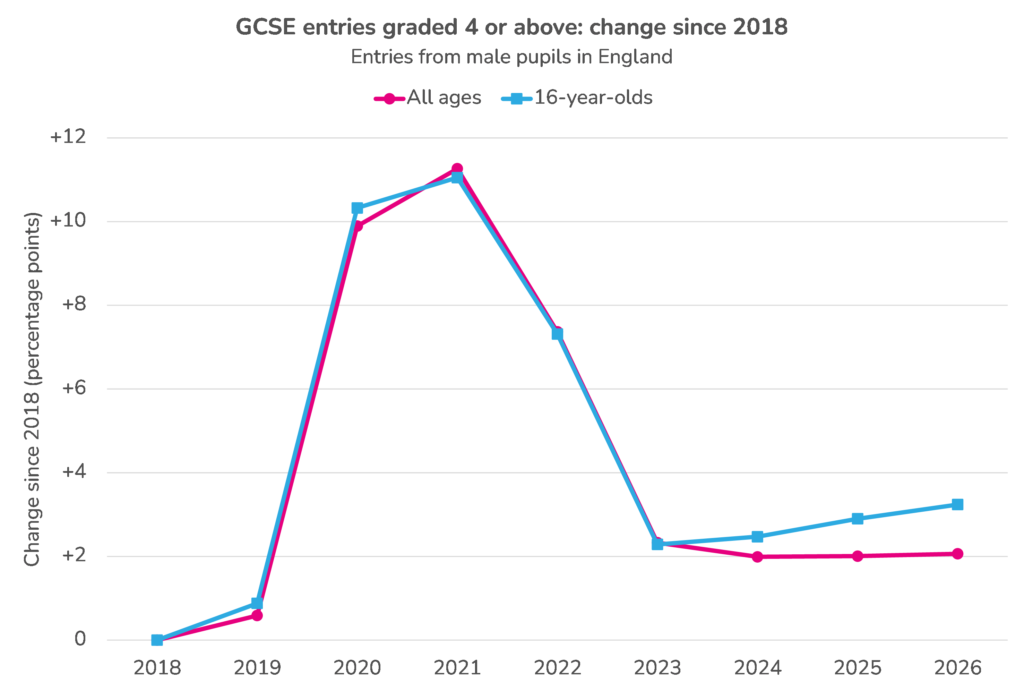
At grade 7 or above, both datasets show an increase since 2023, but the increases for 16-year-olds are sharper than the increases for all ages. And at grade 4 or above, the 16-year-old dataset shows increases each year since 2023, while the all ages dataset shows a small fall between 2023 and 2024 and relatively little change since then.
In other words, the 16-year-olds dataset shows more of a positive trend since 2023 than the all ages dataset. And this is exactly what we saw for entries from female pupils.
The table below compares change since 2023 by sex.
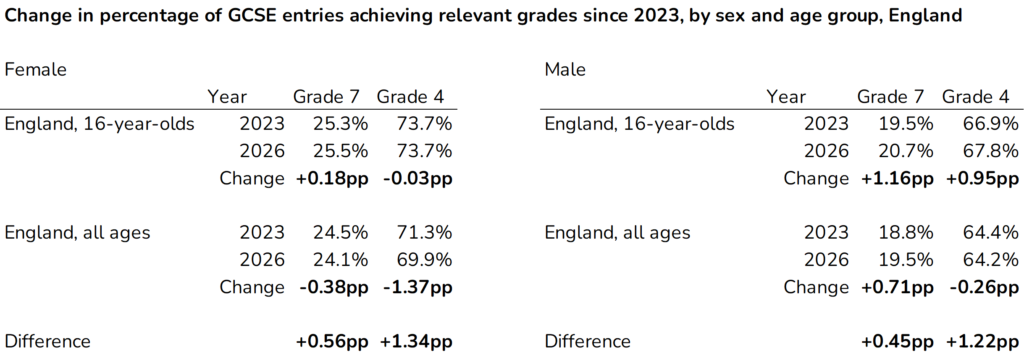
The difference between the two datasets is similar for boys and girls – the all ages dataset shows an increase roughly 0.4-0.6 percentage points lower than the 16-year-old dataset at grade 7, and 1.2-1.4 percentage points lower at grade 4.
And this difference is enough to change the pattern for girls from more-or-less flat when using the 16-year-old dataset to negative when using the all ages dataset.
Explaining the difference
But why is the trend in the all ages dataset less positive than in the 16-year-old dataset? This might suggest that grades for entries from pupils who are not 16 are falling.
And a look at the data for other age groups backs this up.
The vast majority of GCSE entries from pupils who are not 16 come from those who are 17 and over – 84% last year. And many of these will be resits of English and maths.
Focusing on the 17 and over group, entries fell following the years of TAGs and CAGs in the pandemic, with a low point in 2022 followed by increases year-on-year.
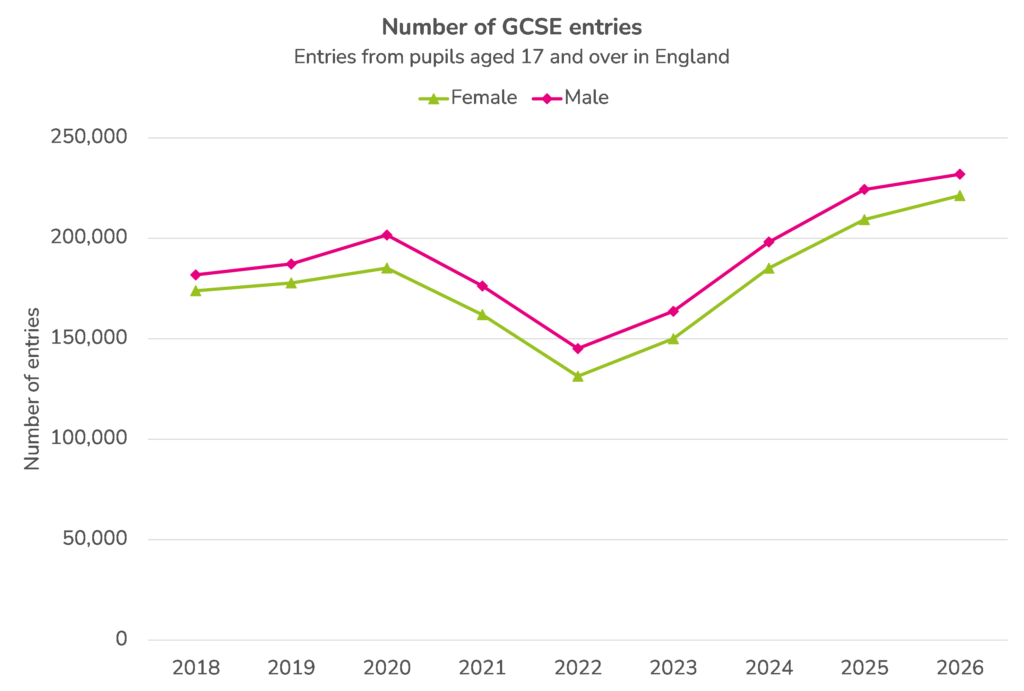
As entry numbers increased, grades fell, both for male and female pupils.
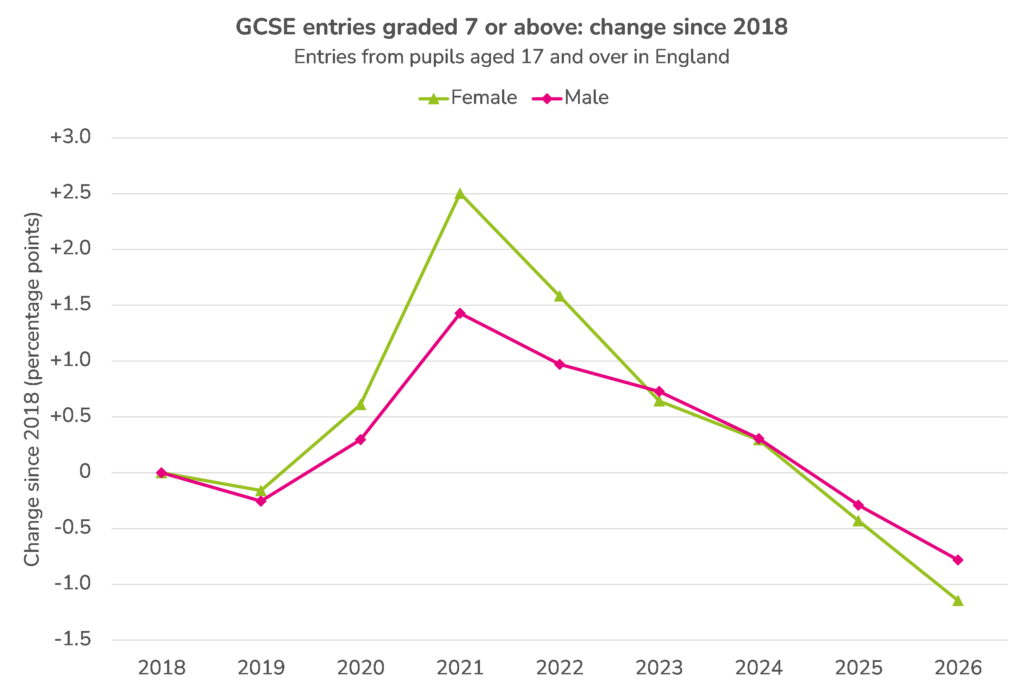
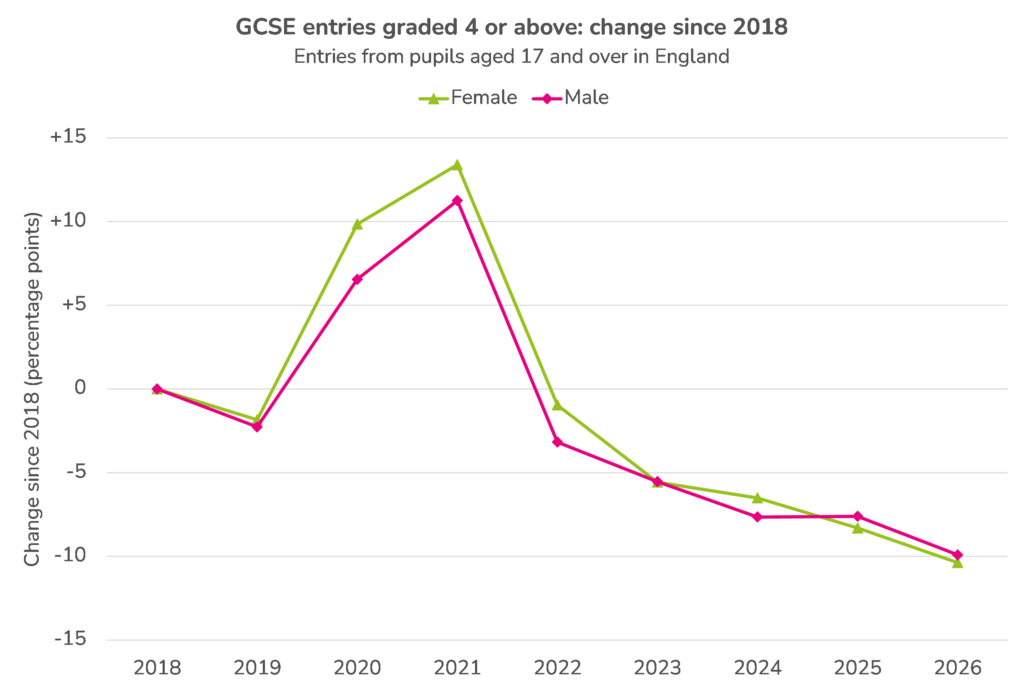
And it’s this fall in grades for older pupils that explains the differences between the all ages dataset and the 16-year-old dataset.
Summing up
Today we’ve played data detective, looking into why two different datasets point us in apparently contradictory directions.
And we found that the difference could be traced back to a negative trend in grades for GCSE entries from older pupils.
This negative trend pulled down grades in the all ages dataset for both boys and girls. For male pupils, this changed the positive trend seen from 2025 to 2026 in the 16-year-old dataset into a smaller, but still positive, trend in the all ages dataset. But for female pupils, it changed a flat trend into a negative trend.
And that led to Datalab and the BBC coming to two different conclusions – simply because of our choice of dataset.
Leave A Comment