This year’s secondary school performance tables include results in the second set of GCSE subjects to be reformed and graded 9-1.
This includes all the English Baccalaureate subjects (science, geography, history, modern foreign languages) and some other major subjects such as art and design, and religious studies. English and maths formed the first wave of reformed subjects, with 9-1 grades reported last year.
In addition, the European Computer Driving Licence, or ECDL, no longer counts towards performance tables.
Both of these changes have had an effect on schools’ Progress 8 scores this year.
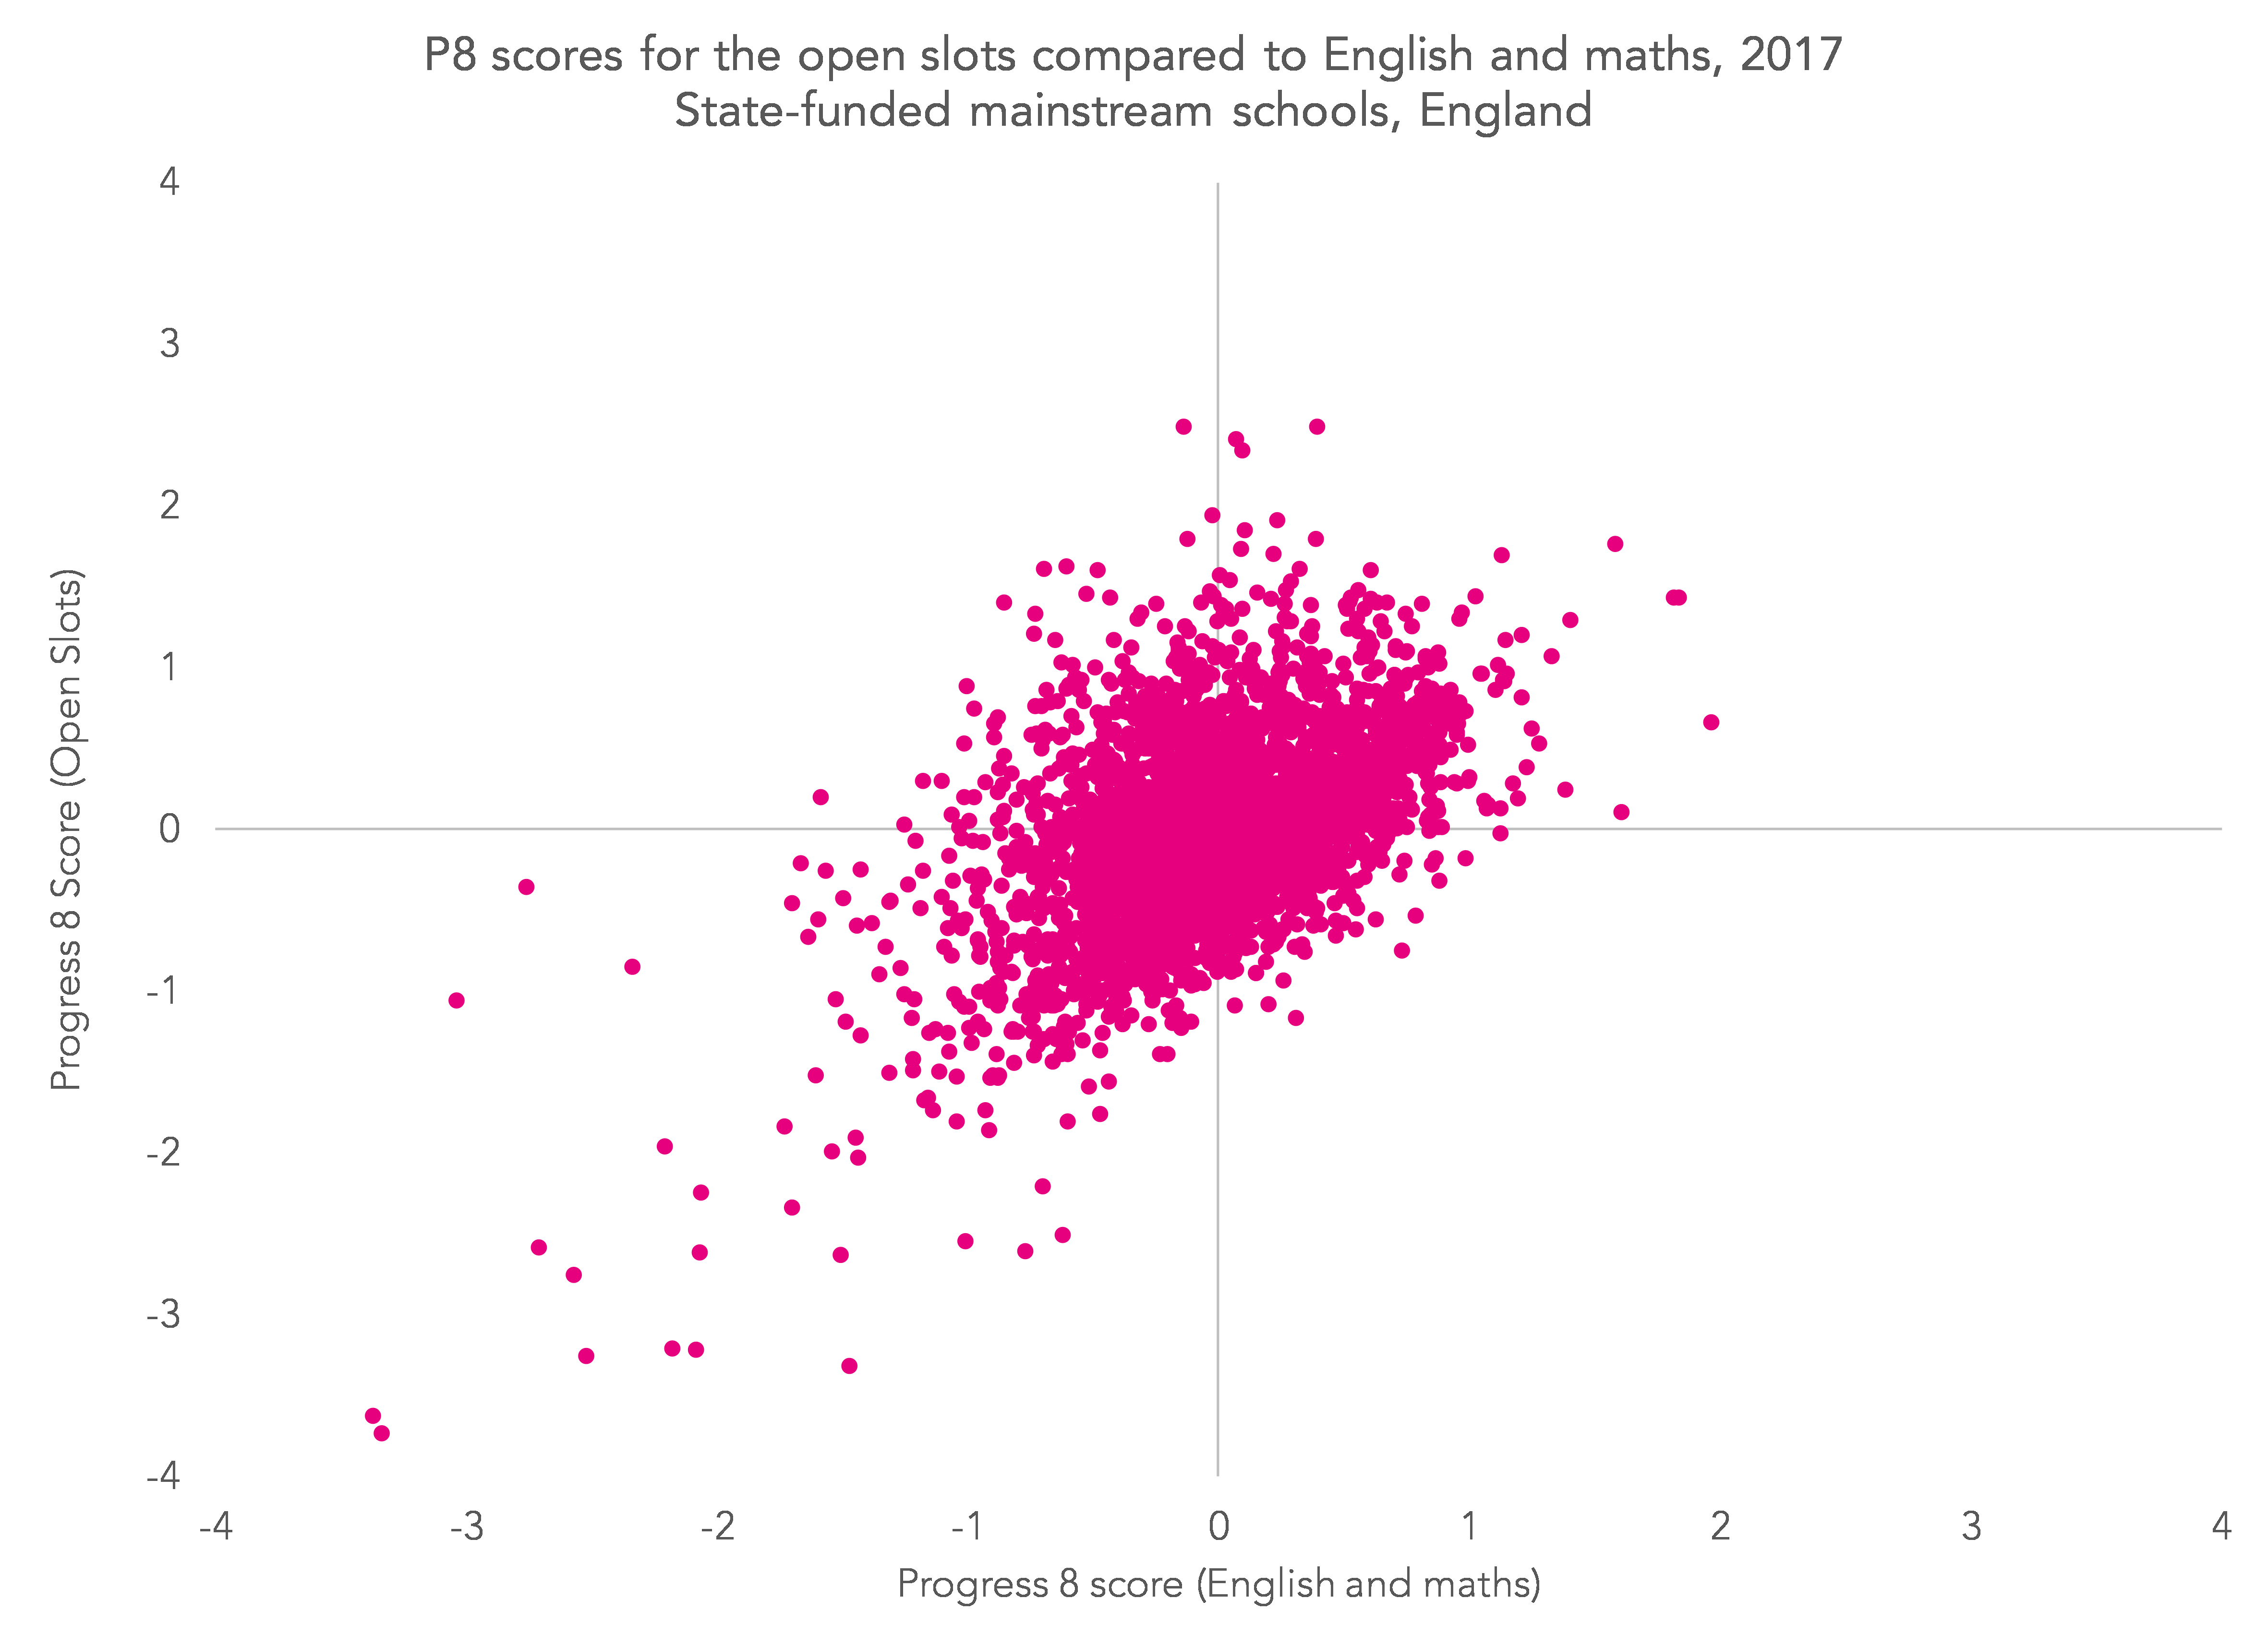
The correlation between P8 for the open slots and English and maths
In addition to an overall P8 measure, separate scores are published for its English, maths, EBacc and ‘open’ slots.
The chart below shows the relationship between schools’ P8 scores for the open slots and the average of their English and maths slots in 2017. The correlation is in the order of 0.52. In general terms, P8 for the open slots tends to increase as P8 for English and maths increases, but there were numerous schools achieving high P8 scores for the open slots despite low scores in English and maths.
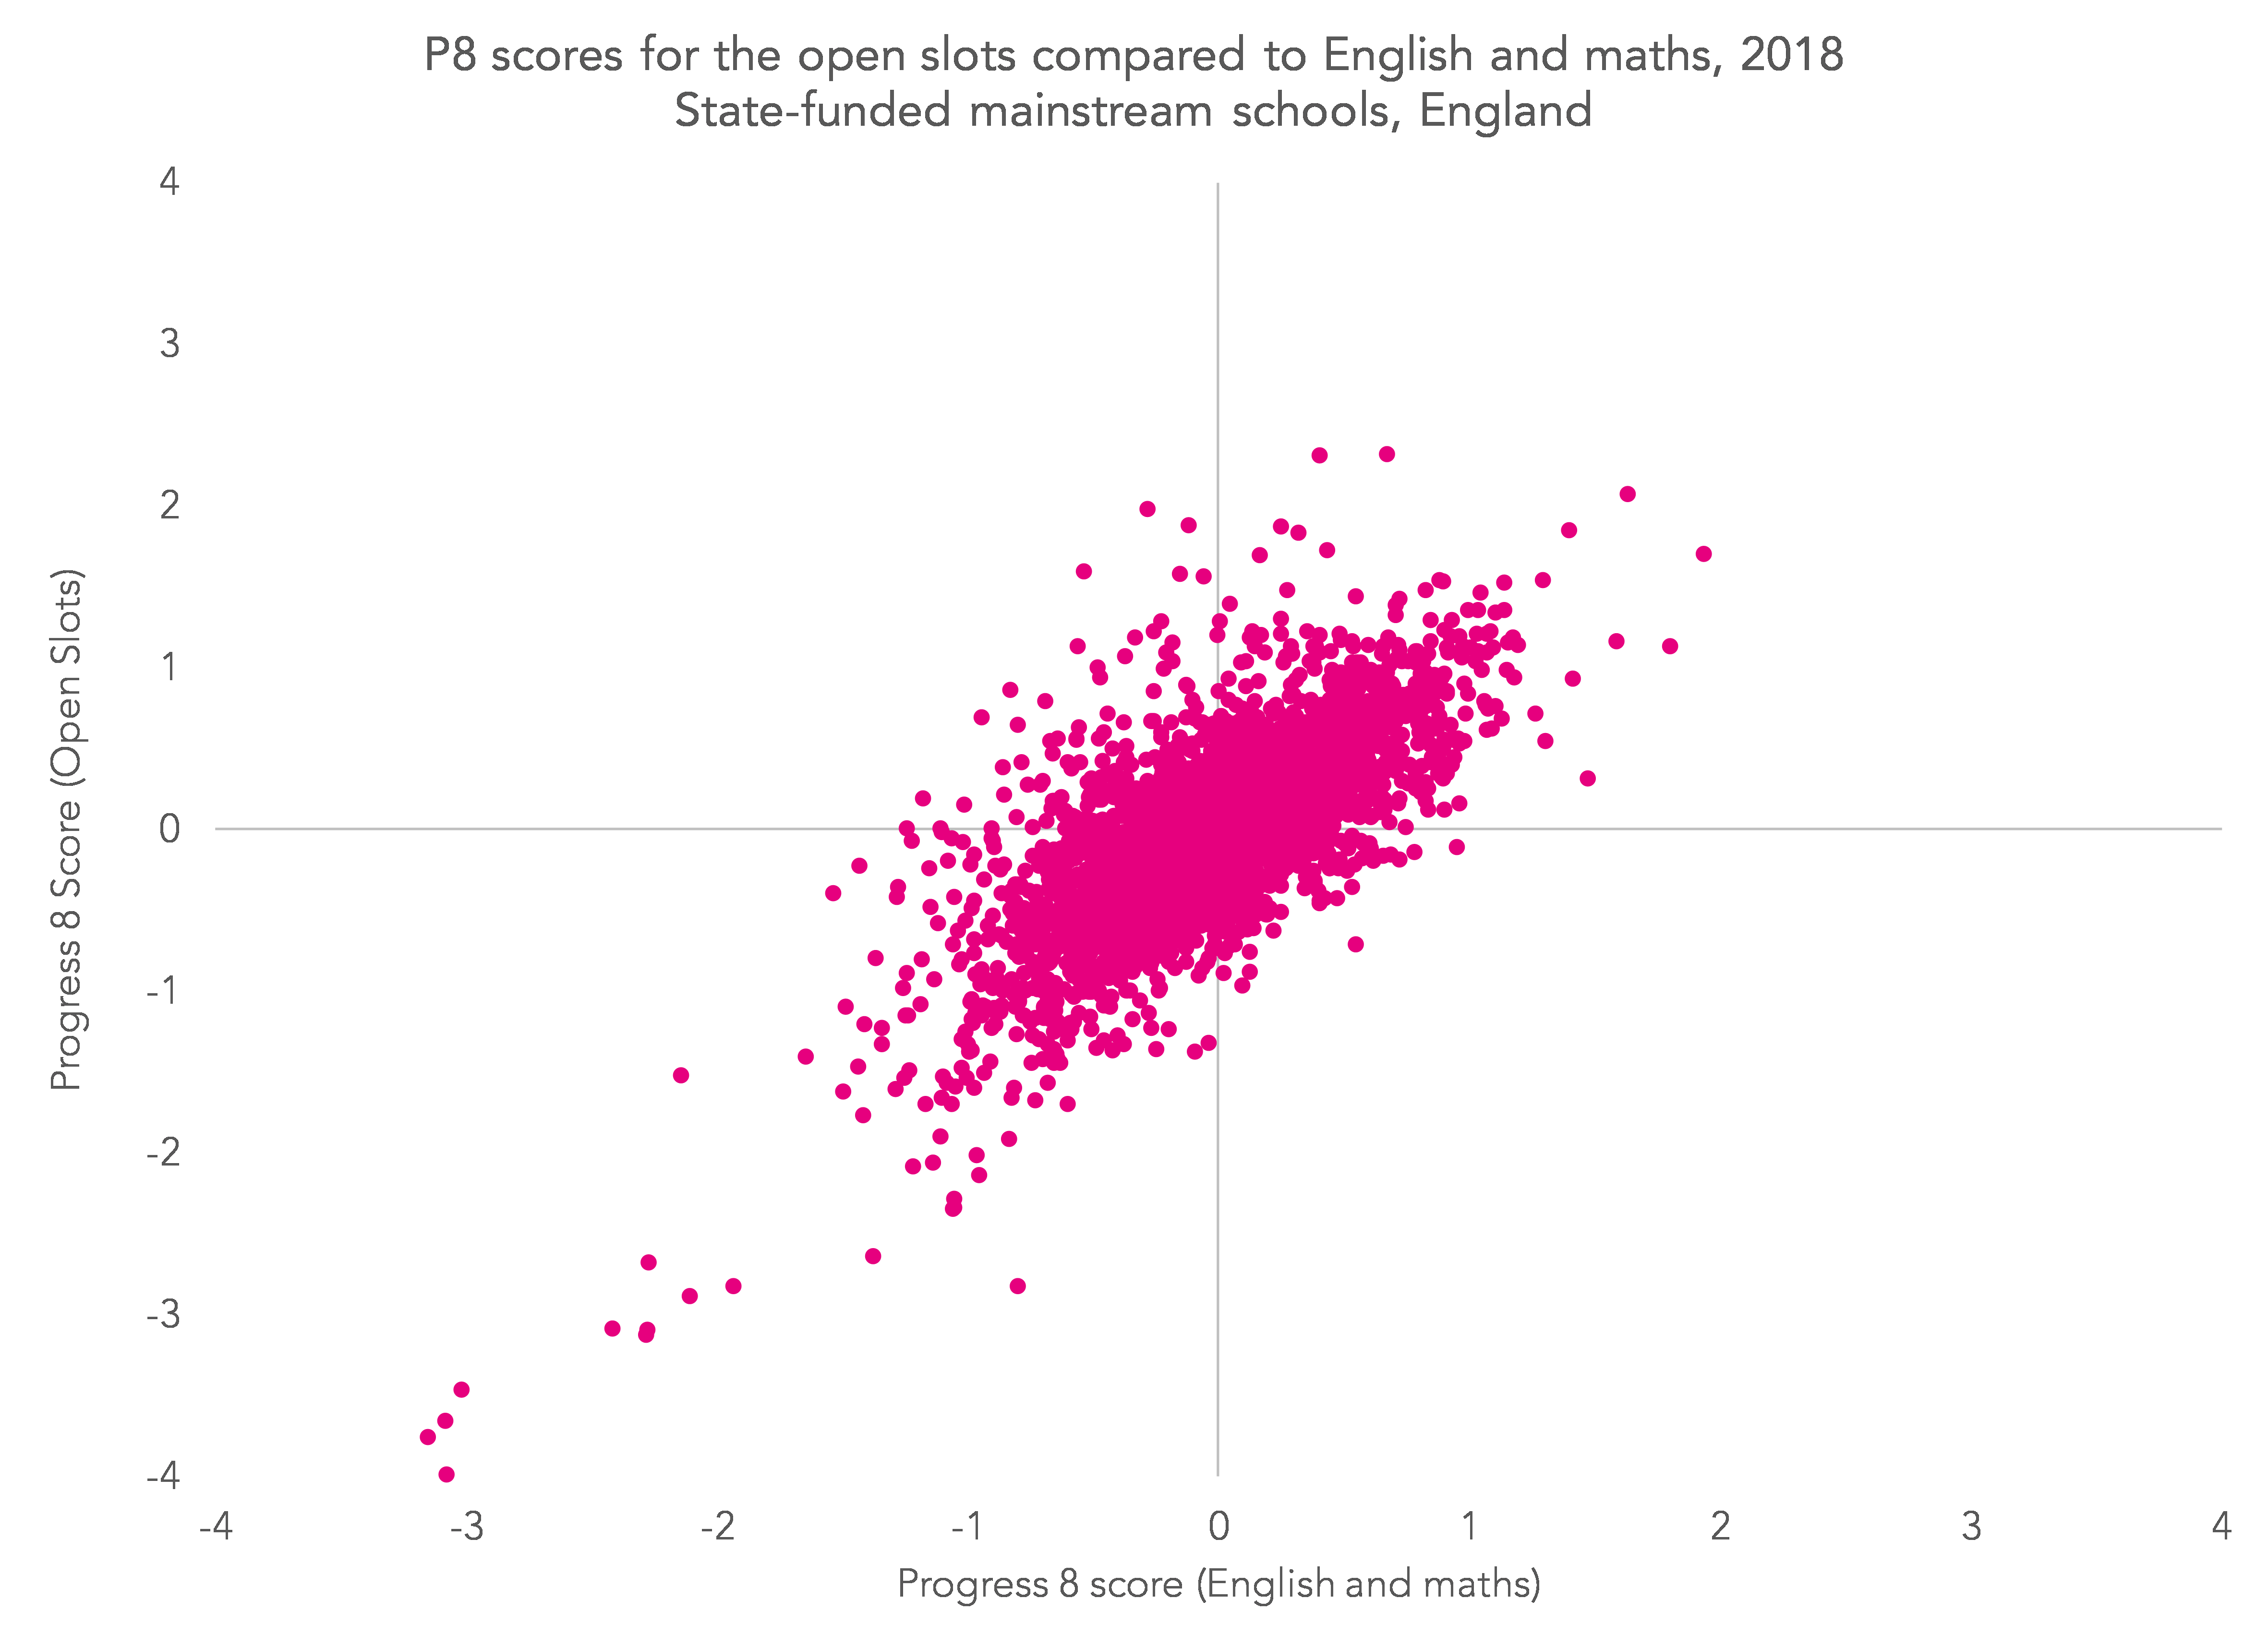
Looking at this year’s data, the correlation has visibly improved and now stands at 0.74. Even so, there are a number of schools with scores for the open slots far in excess of their scores for English and maths.
What this means is that some schools may have seen their P8 score for the open slots change markedly between 2017 and 2018, as the chart below suggests.
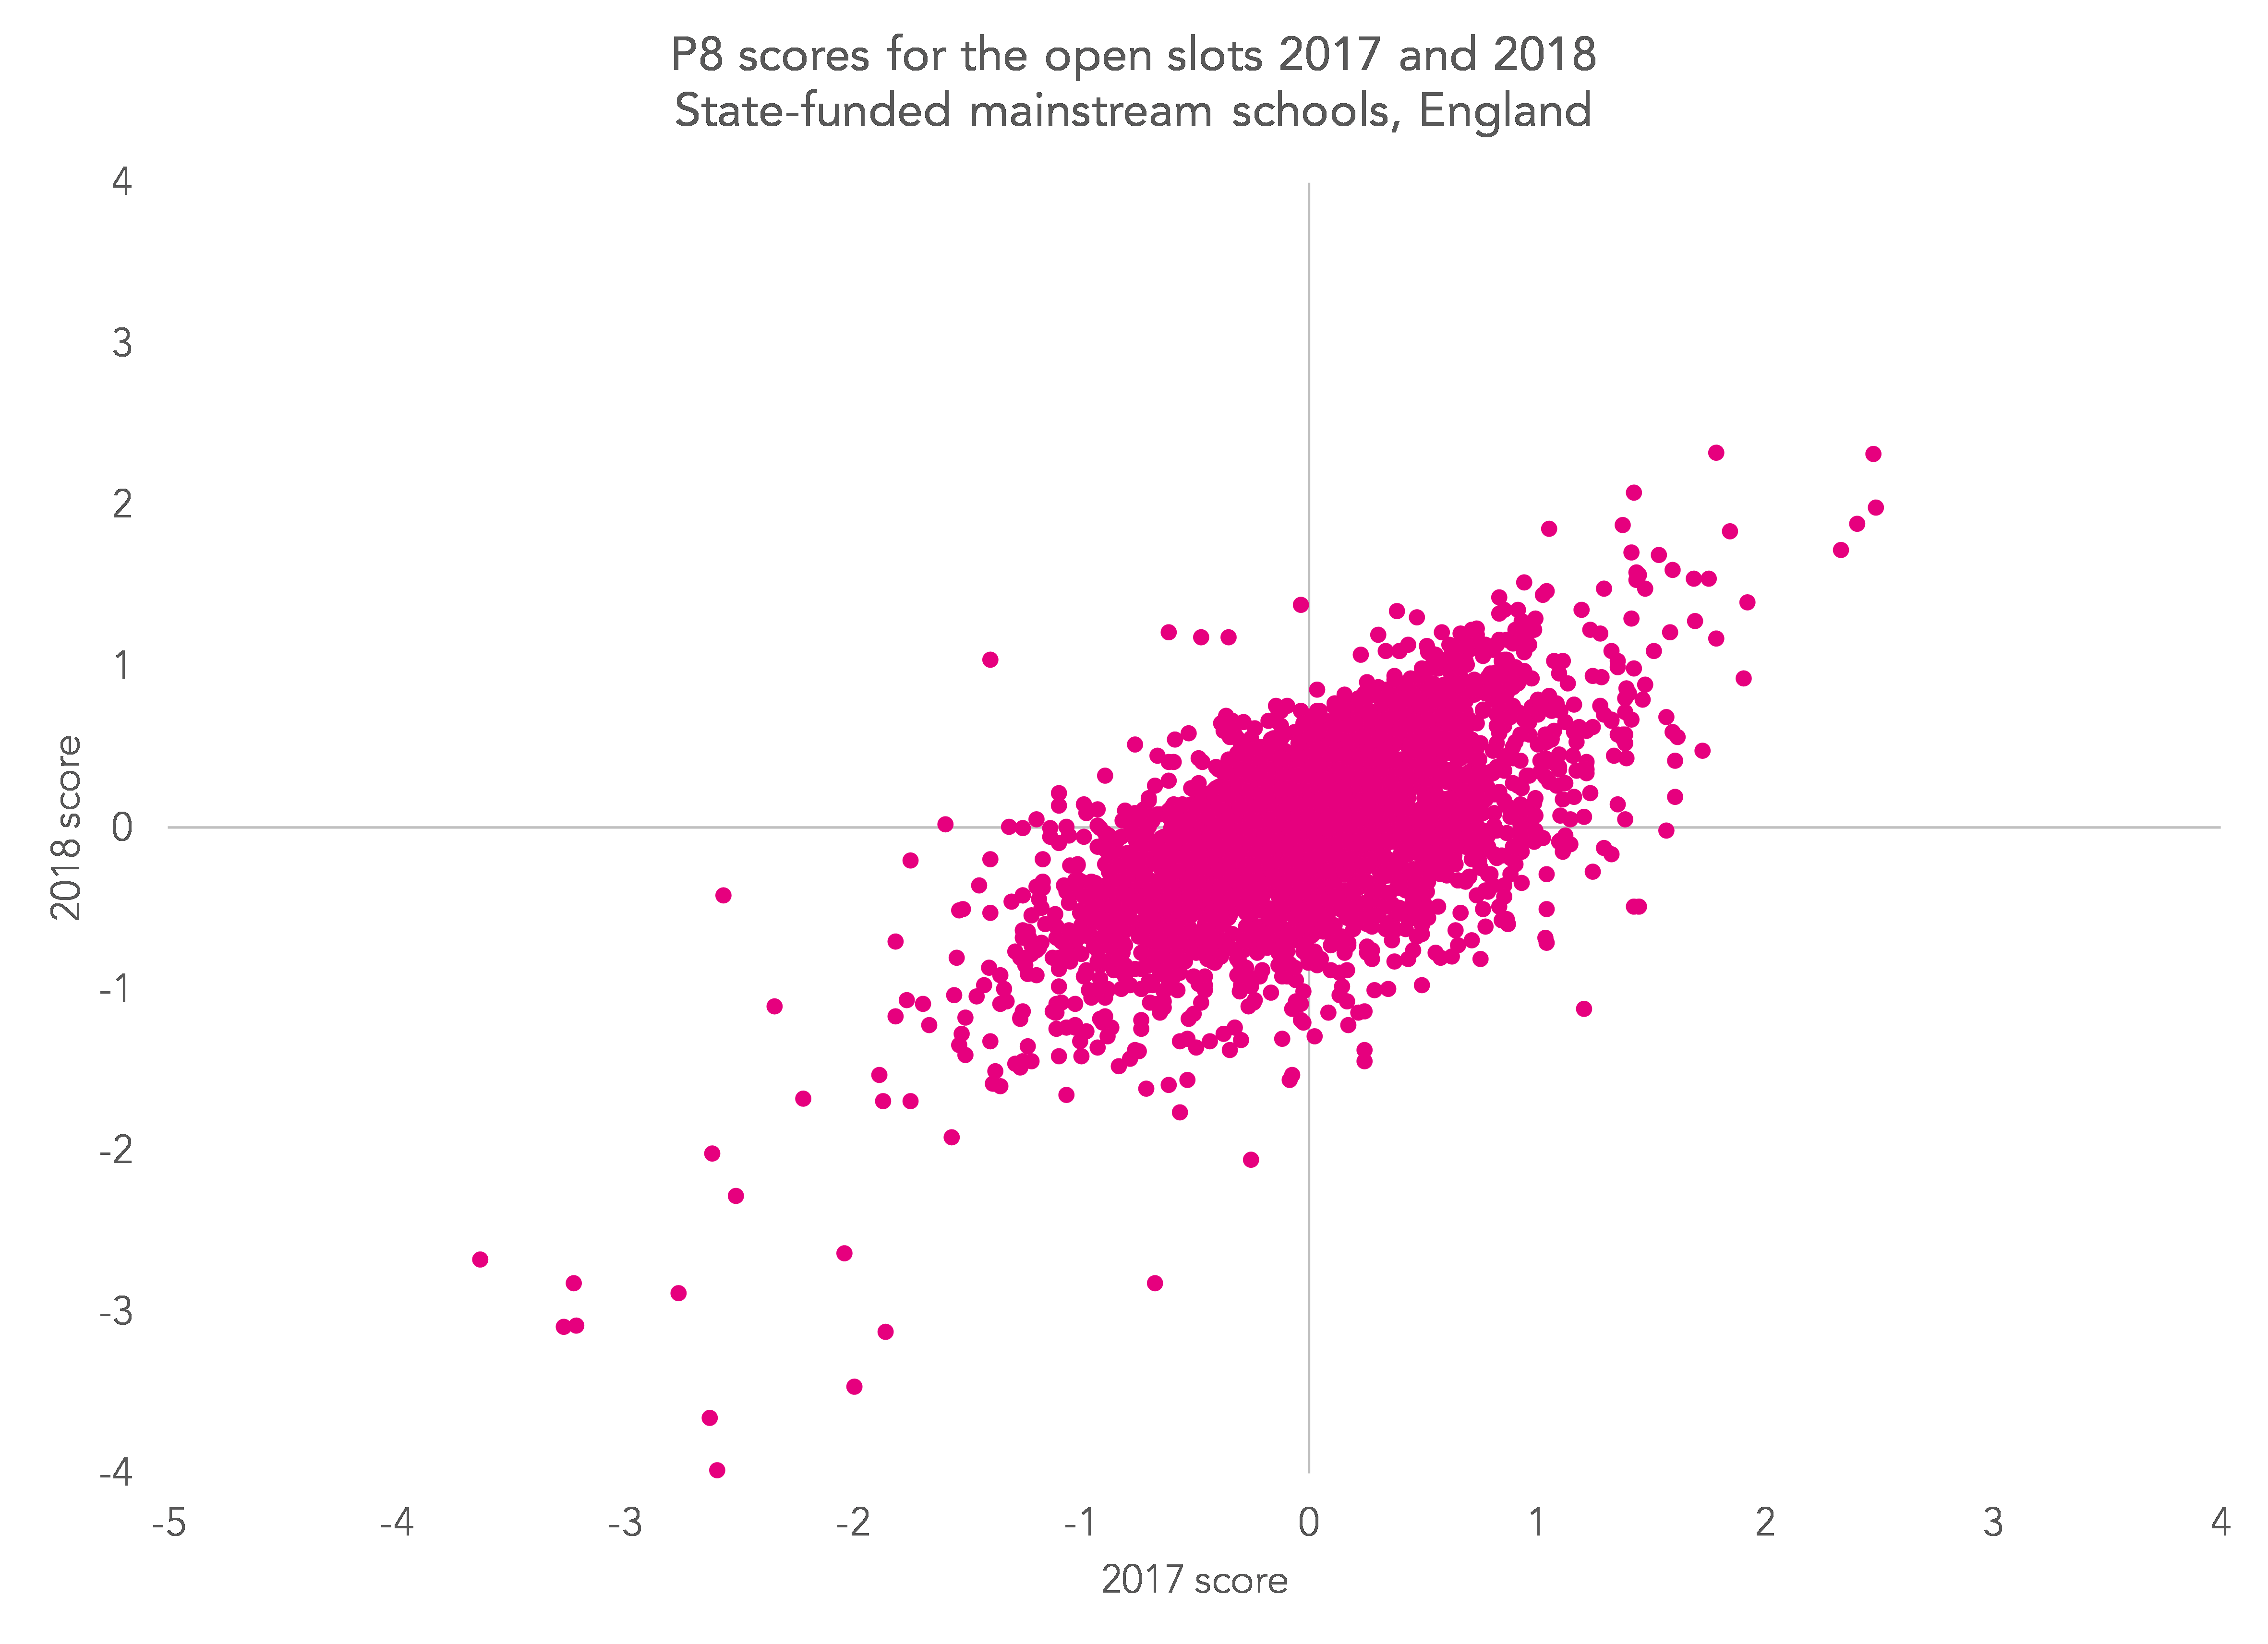
The correlation between 2017 and 2018 for the open slots is still moderately high (0.64), but lower than that for the English slots (0.79), the maths slots (0.77) and the EBacc slots (0.82). Most of this is driven by the removal of ECDL from the list of qualifications eligible for performance tables.
Analysing P8 slots
On the subject of P8 slots, for schools looking to analyse their performance it’s worth a reminder that comparing results in the open slots to those in the other slots isn’t the most meaningful thing to do. In schools that offer a lot of EBacc qualifications, P8 for the open slots will by definition be lower than for the EBacc slots since the best grades will count towards the EBacc. Combining the scores for the EBacc and open slots would give a more rounded picture.
EBacc attainment
Attainment in the EBacc slots has increased.
Or has it?
Today’s statistical release shows that the average point score for the EBacc slots increased in state-funded schools from 12.6 to 13.4. Given an average of 2.8 entries per pupil, that’s an increase of around a quarter of a grade per entry.
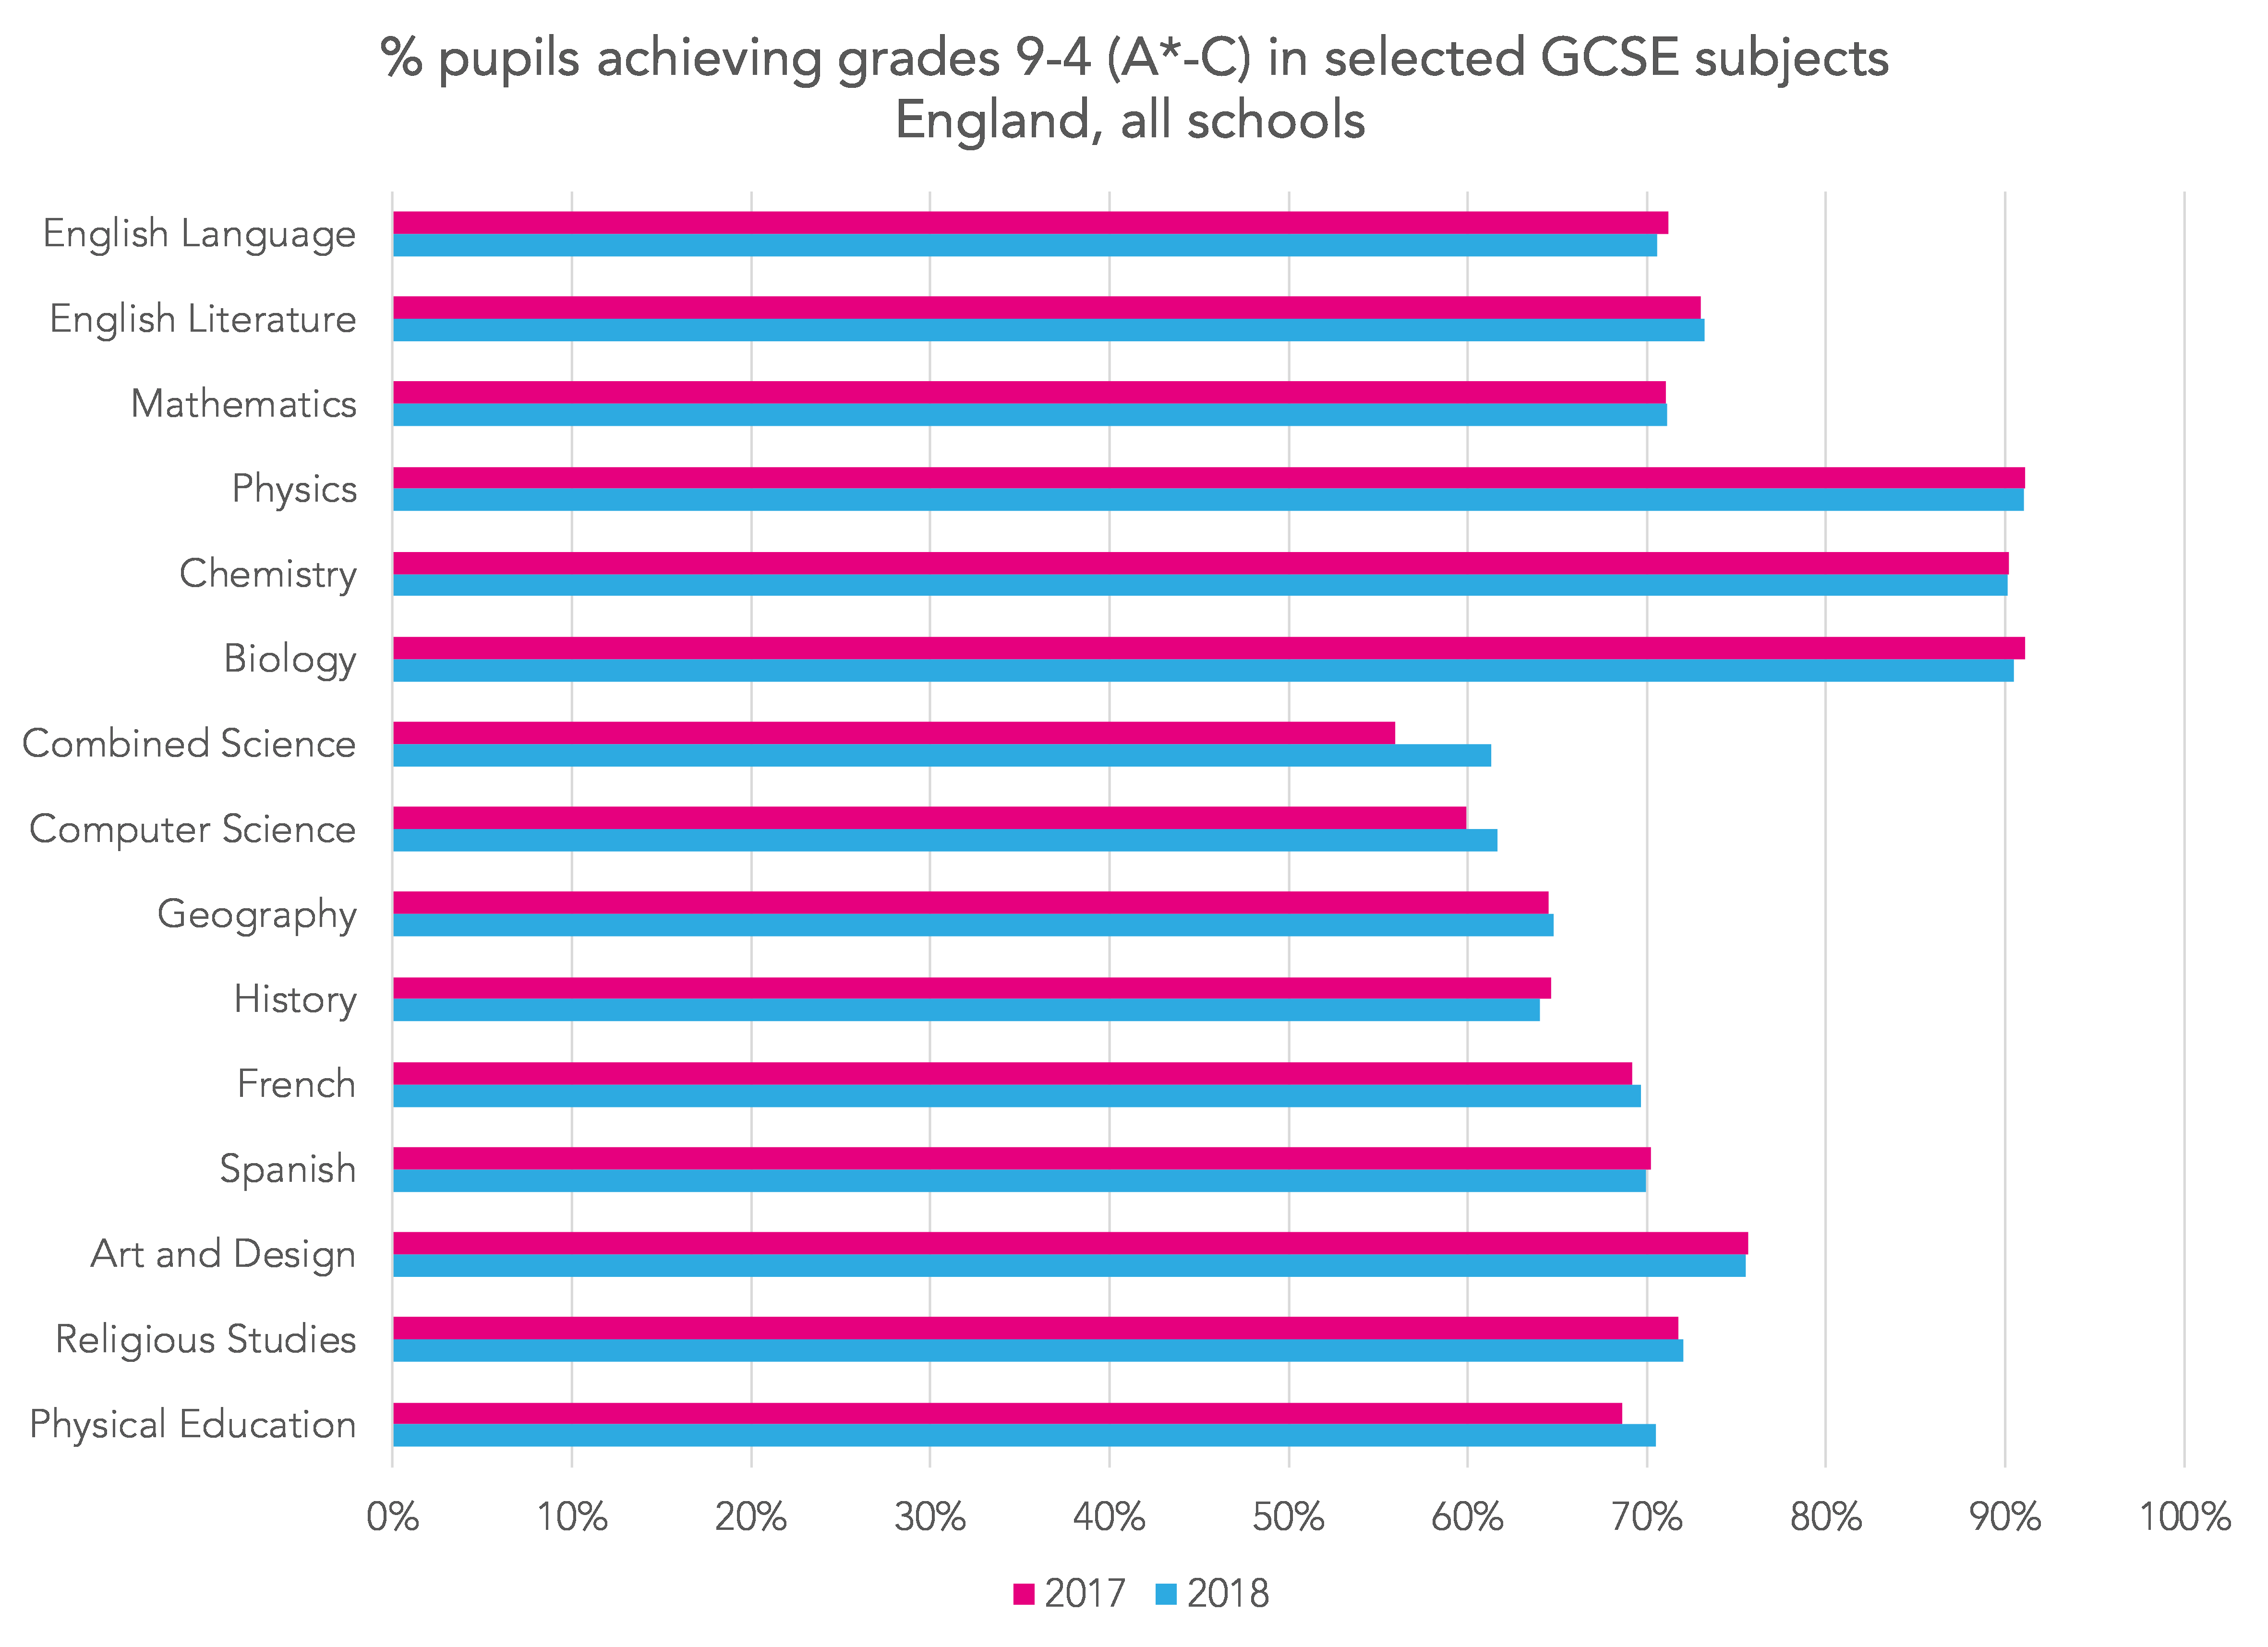
Looking at the following two charts this might seem surprising. The percentage of pupils achieving grades 9-4 in 2018 are pretty much the same as the percentage achieving A*-C in 2017, across the board. The same is true for grades 9-7 (A*-A in 2018). This is what we would expect given the comparable outcomes approach taken by Ofqual to maintain standards.

Nonetheless, the average point scores of reformed subjects have increased.
The reason for this is relatively straightforward. Within the grade ranges 9-7, 6-4 and 3-0, more points were available in 2018 than in 2017. Or put another way, the points scores used for legacy GCSEs in 2017 and 2018 were a touch on the low side.
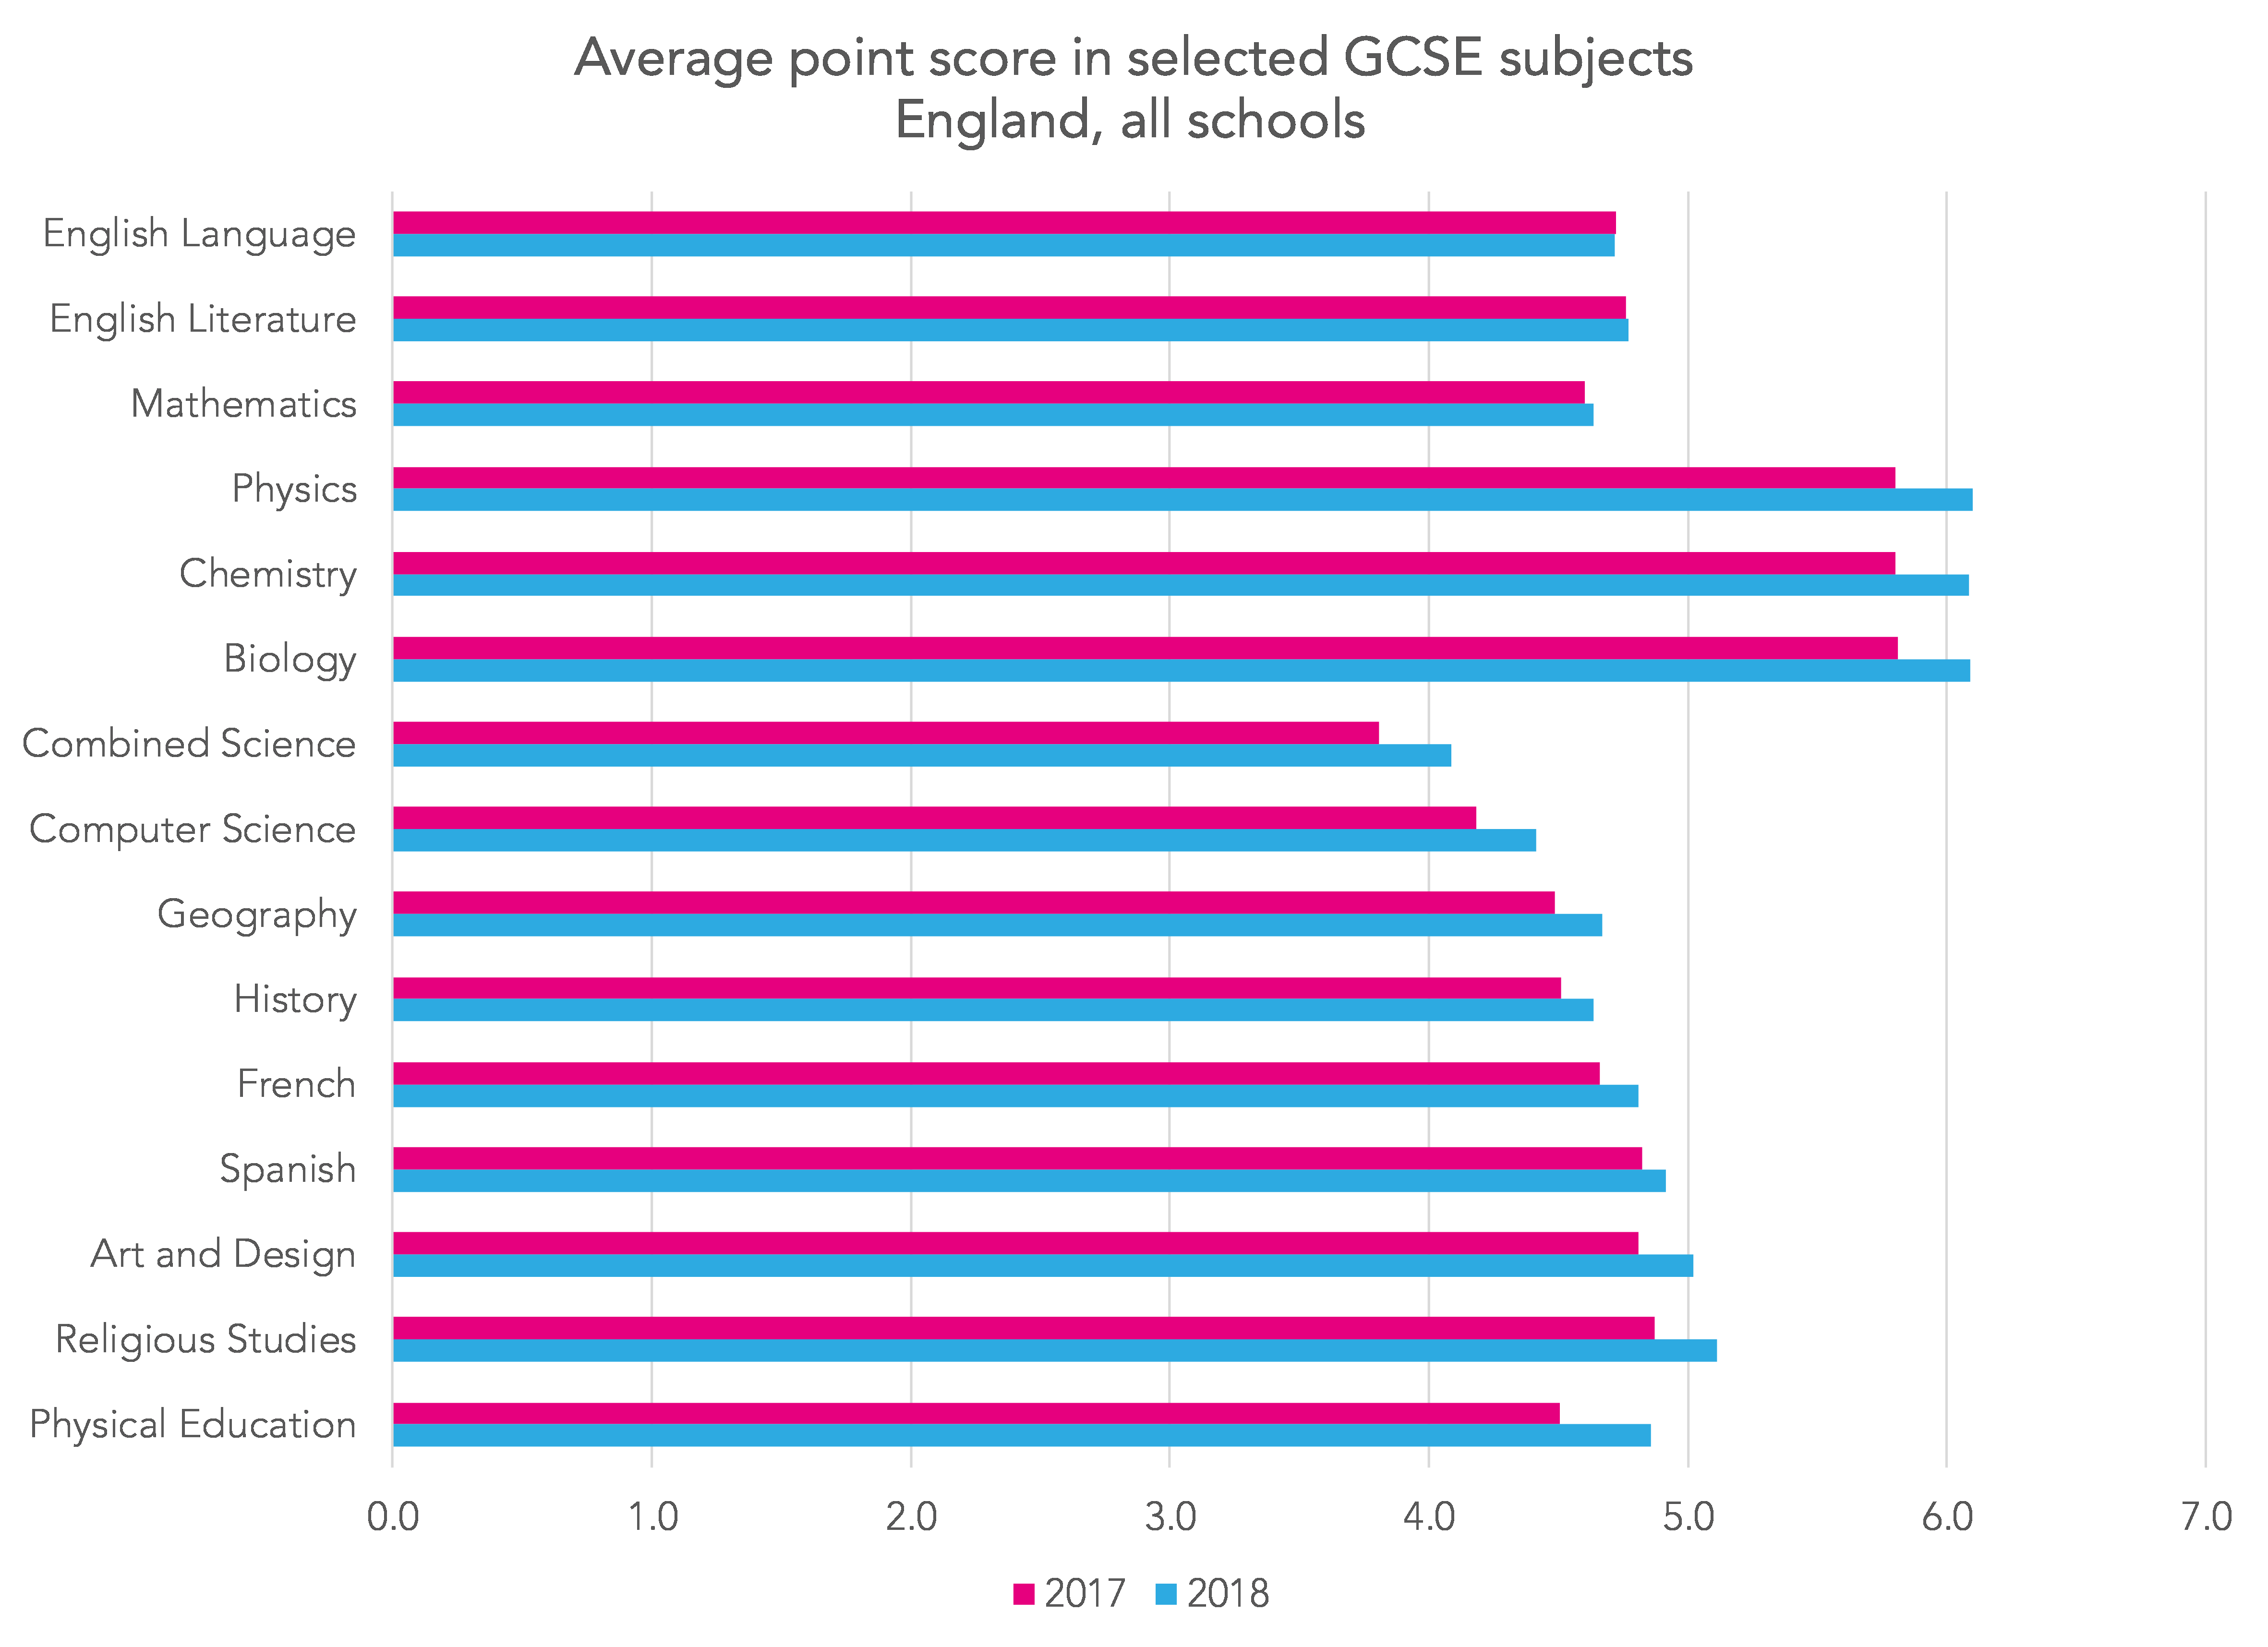
To illustrate this, the chart below shows the points achieved by pupils who took GCSE geography in 2017 and in 2018, broken down by grade range. In particular, those in the 6-4 range (formerly B and C) achieved higher points in 2018. If B and C had been given higher points score (e.g. 4.33 for C), we wouldn’t see this.

So any increase in attainment in the EBacc slots of Attainment 8 this year is largely artificial.
Want to stay up-to-date with the latest research from FFT Education Datalab? Sign up to Datalab’s mailing list to get notifications about new blogposts, or to receive the team’s half-termly newsletter.


Leave A Comment