Last week, Ofsted’s Chief Inspector, Amanda Spielman spoke at the Northern Powerhouse Partnership summit on the importance of understanding context in education outcomes.
I’d spoken before her so she didn’t have to do a great deal to say something more interesting than the previous speaker.
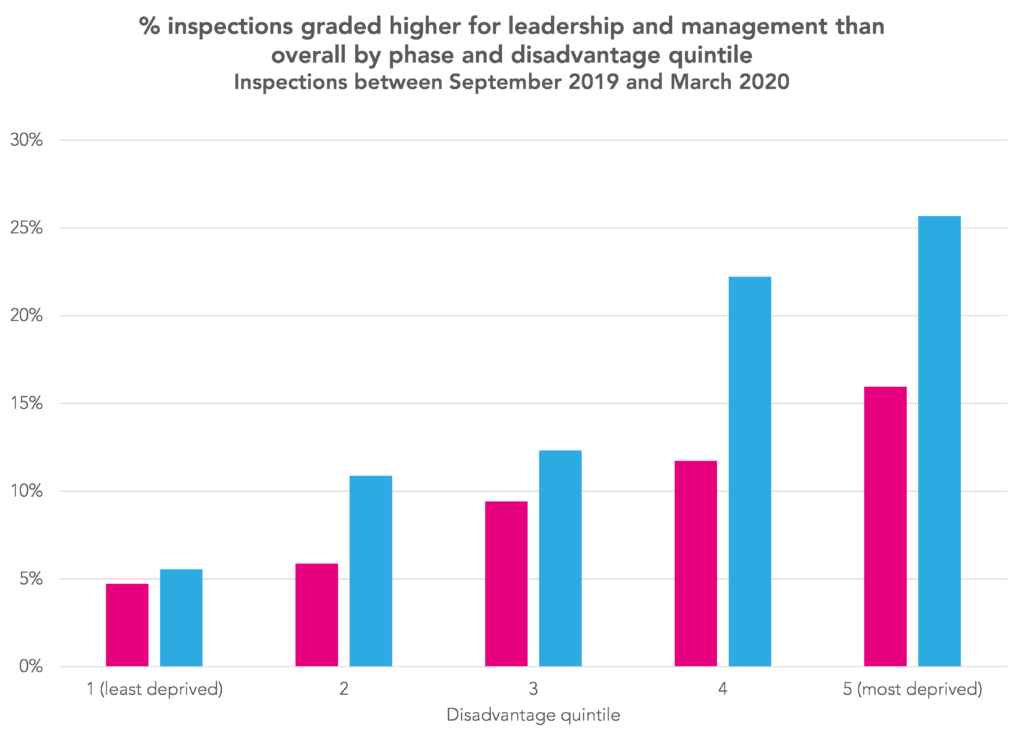
Her speech was picked up by Schools Week, which focused on her claims that “disadvantaged schools are quite a lot more likely to have Ofsted rate their leadership and management more highly than their overall effectiveness.”
But does the data back up this claim?
Inspections in 2019/20
To look at this, I’ve downloaded data on all school inspections which took place between September 2019 and the end of March 2020 when inspection was paused due to COVID.
This contains the results of some 3,247 inspections. 1,696 did not lead to the award of a grade for overall effectiveness, mostly due to being Section 8 inspections which did not convert to a full inspection.
I also remove 117 inspections related to special schools, nursery schools and pupil referral units. This is just because there are too few of each for any meaningful analysis.
This leaves 1,434 inspections of primary and secondary schools.
Disadvantage data
Data on free school meal eligibility at each primary and secondary school can be downloaded from the Department for Education website.
All state-funded primary and secondary schools are ranked from lowest to highest according to the percentage of pupils eligible for free school meals. Five evenly sized bands are created separately for primary and secondary schools, with the 20% most disadvantaged schools in each phase in the highest band.
Results
As the chart below shows, the Chief Inspector’s claims are backed up by the data. Schools with more disadvantaged intakes do tend to achieve higher grades for leadership and management than for overall effectiveness. This was particularly the case for secondary schools.
But is there more to it?
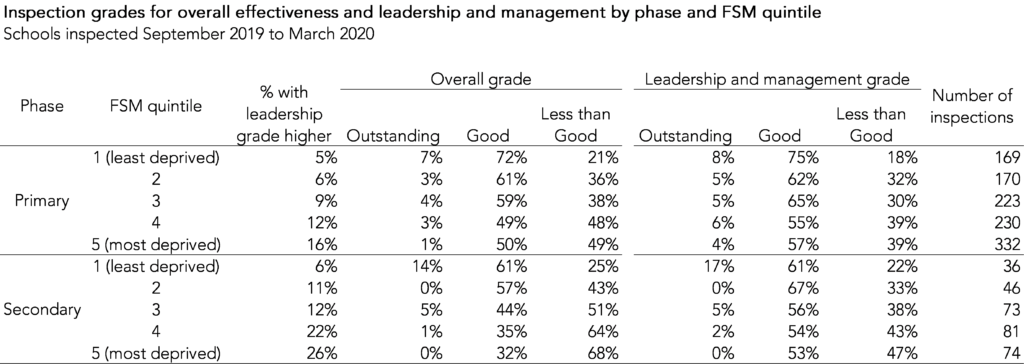
The table below shows some more detailed data about the relationship between school disadvantage and inspection outcomes.
First an obvious point. If a school is graded outstanding overall, it cannot be graded higher for leadership and management. However, relatively few of the inspections summarized above resulted in outstanding overall grades.
More importantly, it can be seen that disadvantaged schools are more likely to be inspected. Nationally, there are even numbers of schools in each of the five bands. Yet there were more inspections in the more disadvantaged schools.
Finally, it is still the case that disadvantaged schools are still more likely to judged less than good both overall and for leadership and management. As we showed here, it can take some time to become good for overall effectiveness, particularly for schools with disadvantaged intakes.
So perhaps some recognition from Ofsted about the challenges of leading schools with disadvantaged intakes. But perhaps it doesn’t go far enough for some.
Want to stay up-to-date with the latest research from FFT Education Datalab? Sign up to Datalab’s mailing list to get notifications about new blogposts, or to receive the team’s half-termly newsletter.


Leave A Comment