KS4 Early Results Service
Free to all Aspire schools, this year’s KS4 service features an entirely new upload and report experience.
By using FFT’s new pupil tracking tool for secondary schools, you will be able to access your results analysis in real-time. Schools using the KS4 service will also gain early access to estimates of future KS5 attainment in September.
This post was updated on 13 September 2024 to bring in data from more schools.
GCSE results are out today. And we’ve already written about the official figures that have been published by the Joint Council for Qualifications and Ofqual. But the figures published so far don’t tell us anything about the indicators that will be published in performance tables, like Attainment 8, for example.
In this post, we’re going to present some findings from data that FFT has collected as part of our Key Stage 4 Early Results Service. To use the service, schools upload their results data to FFT’s Aspire system, and are then able access results analysis, including Progress 8, in real-time.
By analysing the data sent in by participating schools, we’re able to bring you some insights into how today’s results compare to last year’s for various demographic groups including gender, disadvantage and region. And we’re able to go into more detail than the statistics published by JCQ and Ofqual have done, as yet.
We’ll be looking at Attainment 8, as well as the proportion of pupils achieving a standard pass (9-4) or a strong pass (9-5) in both English and maths GCSE.
Data
Before getting into what we’ve found, we’ll start by sounding a characteristic note of caution. These figures are based on analysis of data from 340,000 pupils from 1,800 state-funded schools that have submitted data to the Early Results Service. This is well over half the cohort.
We do not claim that this is a representative sample, so national results, when they come out, may not quite match up to what we see here. But we have found in the past that our analysis of samples from results service data do tend to align fairly closely with the national picture. We also compare to last year’s results for the same set of schools to get an early handle on whether anything has changed.
To get a sense of whether our sample does align with the national picture, let’s take a quick look at how overall attainment for our sample compares to last year.
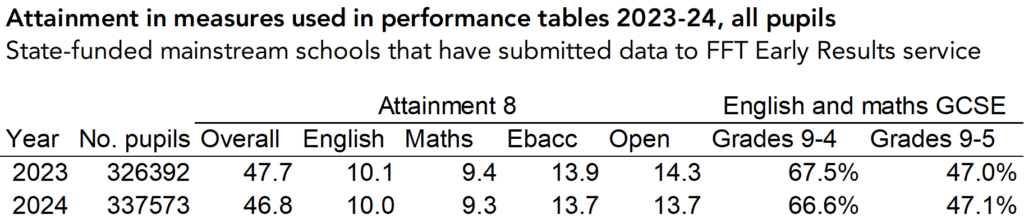
Overall attainment is similar to last year. The proportion of pupils achieving a standard pass in English and maths is down slightly, as is Attainment 8, but the proportion of pupils achieving higher grades, i.e. a strong pass in the basics is up slightly. This fits with what the national figures show.
The exception is the open slot of Attainment 8, in which attainment appears to be down this year. This might be an area in which we’ll see results go up when remarks and late results (and graded music qualifications) are included. But it could also reflect slightly lower attainment in reformed tech awards.
The fact that the patterns are similar to what we see nationally is reassuring in terms of how well these findings might reflect the national picture, although the pupils in our sample do appear to be slightly higher attaining, on average, than pupils nationally: the national average A8 for all state-funded mainstream schools last year was 47.2, while for our sample it was 47.7.
The disadvantage gap may be narrowing (or is it?)
Last year, the disadvantage gap at GCSE was at its highest level since 2011. No official figures have yet been published on the gap this year, and we don’t expect them until Key Stage 4 performance data is published in the autumn.
But looking at results from our sample, it appears that the gap may have narrowed slightly this year.
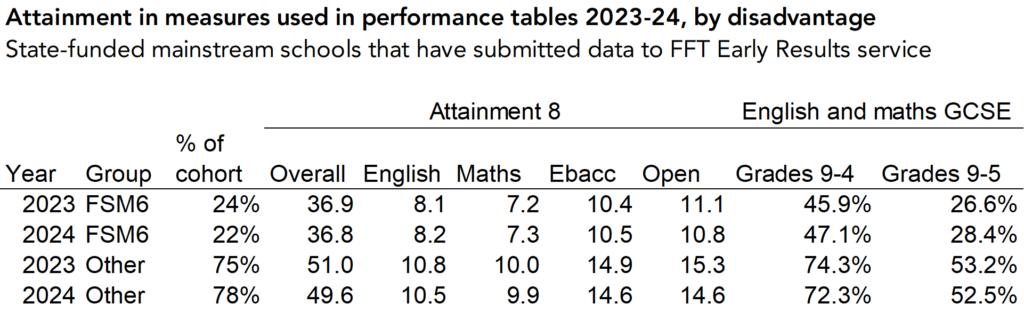
The gap in the proportion of pupils achieving a strong pass in English and maths has narrowed from 26.7 percentage points to 24.0 percentage points, and the gap in Attainment 8 scores has lowered from 14.2 to 12.8.
While this is promising, and certainly better news than an increased gap, changes in how free school meal eligibility is calculated may mean that this year’s cohort of disadvantaged pupils is not really comparable with earlier cohorts. Whereas in the past disadvantaged pupils were those eligible for free school meals in the past 6 years, this year it is those eligible in the last 7 years. This makes it difficult to be sure how the disadvantage gap has really changed over time.
English as an additional language
Pupils for whom English is not their first language tend to have slightly higher attainment than their peers, on average. Differences in the proportion of EAL pupils, as well as disadvantaged pupils, in different areas are behind quite a lot of the infamous regional differences in attainment (of which more in a moment).
But results from our sample suggest that the difference in attainment between EAL pupils and their peers may be slightly lower this year than last.
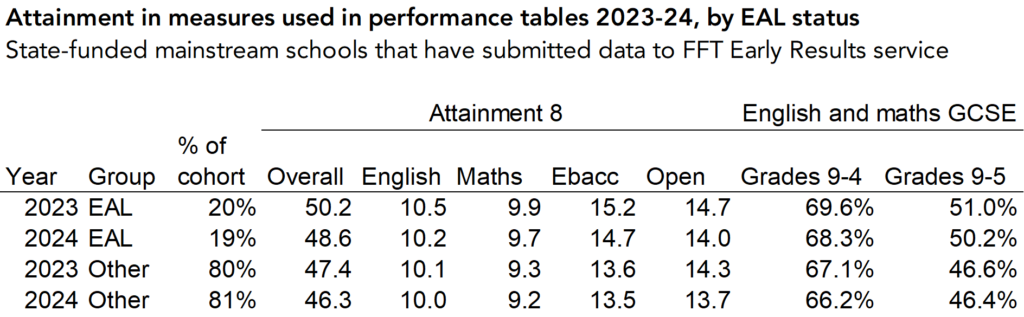
Last year, the difference in Attainment 8 scores for EAL and other pupils was 2.9, compared to 2.2 this year.
Regional differences are going nowhere… but aren’t the whole story
National figures have included data on attainment by region. And these show some large, and consistent, differences.

This year, 28.5% of GCSE entries in London were graded 9-7, compared to 17.8% in the North East.
Data from our sample shows regional differences in both Attainment 8 and in English and maths threshold measures. Attainment 8 scores appear to have fallen by a larger amount among schools in the North East (1.5 points) than average (1.0 points), largely driven by a dip in attainment in the open slots.
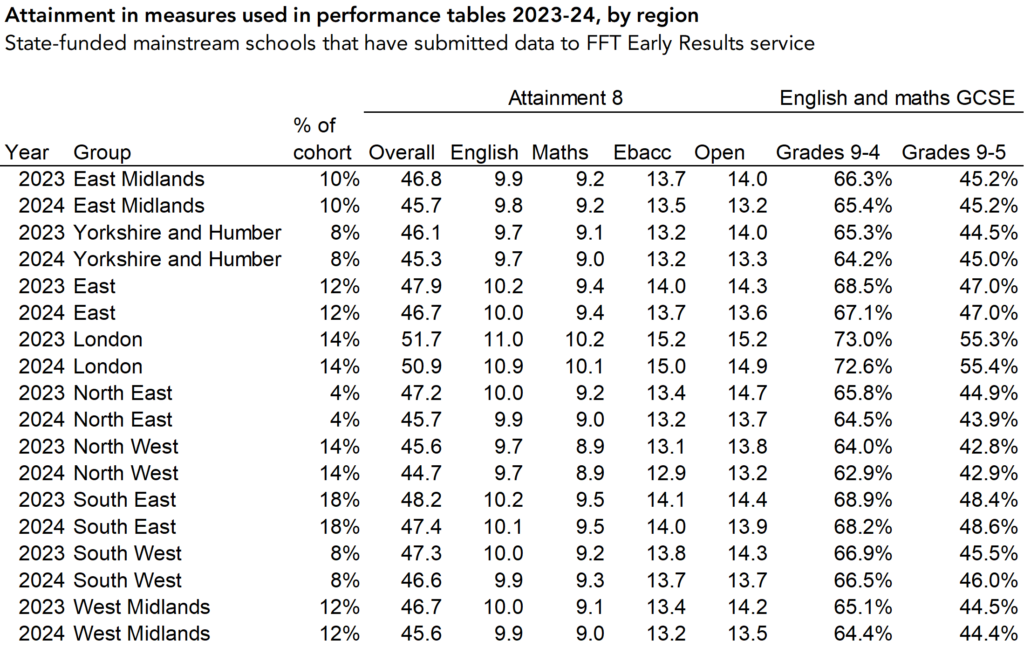
But we should be careful not to get too focused on differences at the regional level. Differences at the local level, and even within schools, can be much more significant than differences between regions.
The gender gap
Again, national figures on attainment by gender have been published, and we have written about the closing of the gender gap in top grades. But the results from our sample show that, while the gender gap in Attainment 8 scores has narrowed, the gap in achieving a strong pass in English and maths has widened slightly.
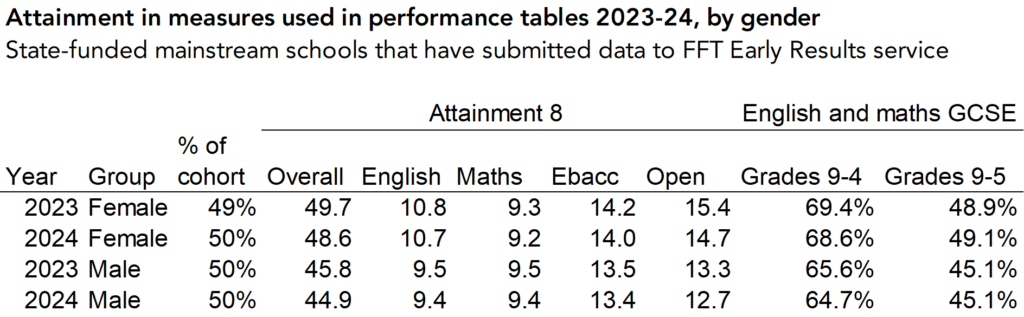
The proportion of female students achieving a strong pass in English and maths is up 0.3 percentage points since last year, while for male students it remains the same as last year.
Summing up
Analysis of the data from our sample of schools provides promising indications that the disadvantage gap may be shrinking, although we are cautious in drawing any conclusions about the gap considering the changes in how free school meals eligibility is defined. It also offers a more detailed look at how attainment varies by region and gender than the official figures yet provide.
We’ll be ready to crunch the numbers when the national figures are published in the autumn but, in the meantime, we hope that this post has given readers some food for thought.
We updated this post in September 2024 with data from more schools.
Want to stay up-to-date with the latest research from FFT Education Datalab? Sign up to Datalab’s mailing list to get notifications about new blogposts, or to receive the team’s half-termly newsletter.


Leave A Comment