In this article we return to earlier work in which we examined attainment in literacy from Key Stage 1 to Key Stage 2 to GCSE.
Briefly, this work tracked how the attainment of pupils changed over time, identifying key benchmarks at each Key Stage that corresponded with a high probability of achieving grade 4 or above in GCSE English language.
We also examined variation in attainment over time for groups of pupils defined by gender, disadvantage and term of birth.
Whereas last time we based our analysis on data from 2019, this time we use data from 2023. However, broad patterns remain the same.
As a bonus, we look at how attainment gaps in literacy change over time for different groups of pupils based on gender, disadvantage and term of birth.
Data
We link data about pupils who completed Key Stage 4 in state-funded schools[1] in 2023 to their attainment at Key Stage 1 and Key Stage 2. There were 604,000 pupils in the cohort in total but we mainly concentrate on the 543,000 (89%) with results at KS1, KS2 and KS4. The majority of those not included would not have been attending schools in England at either KS1 and/ or KS2[2].
For each pupil we calculate literacy scores at Key Stage 1 (based on reading and writing teacher assessments) and at Key Stage 2 (based on tests in reading, GPS[3] and teacher assessment in writing). We use the method described in our previous report. We use GCSE grade in English language as a measure of KS4 literacy.
As KS1 literacy, KS2 literacy and GCSE English language are all measured using different scales, we create standardised versions of each by converting percentiles into standardised scores using the inverse of the normal distribution.
We also calculate KS1 and KS2 literacy scores for pupils assessed at KS1 and KS2 in 2023.
For each pupil we also use their gender, month of birth and their disadvantage status[4] in our analysis. We acknowledge here the problems with measuring disadvantage. We also calculate what would have been pupils’ disadvantage statuses at the end of KS1 and KS2.
The relationship between GCSE outcomes and KS1 reading
69% of the 2023 cohort achieved grade 4 or above in GCSE English language.
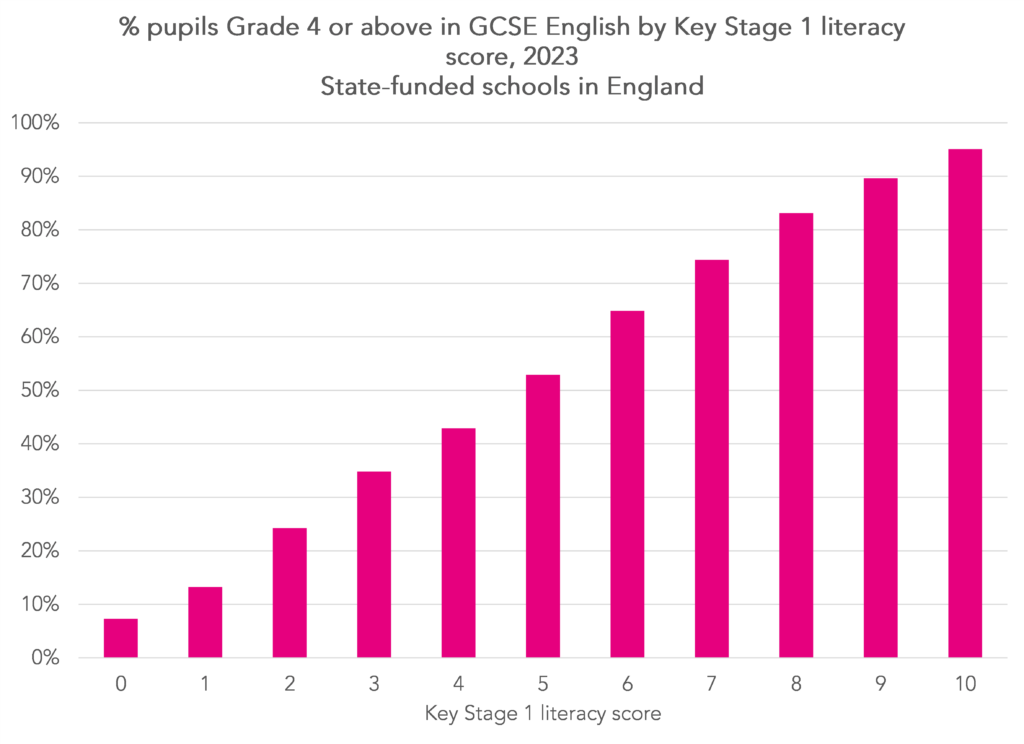
Firstly, we show how this percentage varied given pupils’ KS1 literacy scores.
This chart shows the importance of early literacy for future attainment: the probability of achieving grade 4 increases with KS1 literacy score. Pupils with a score of 5 had a roughly 50:50 chance of achieving grade 4. The majority of this cohort of pupils would have been assessed at Key Stage 1 in 2014 when national curriculum levels were still in place. A score of 5 is equivalent to having level 2B in either of reading or writing and level 2C in the other subject.
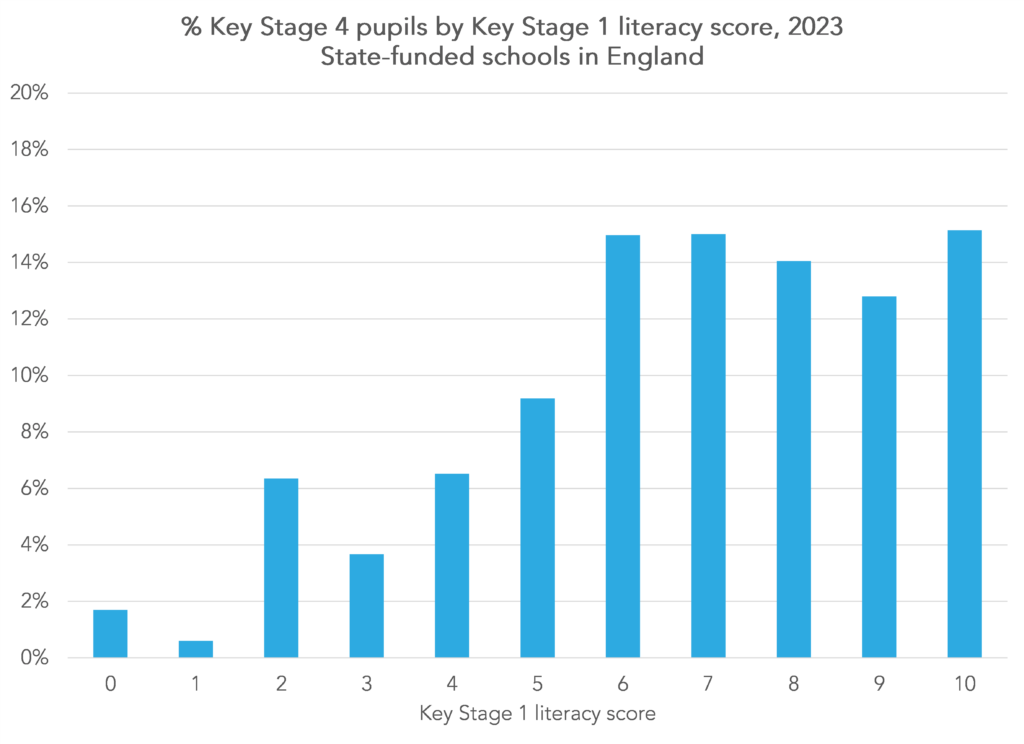
In this cohort of pupils, 81% of pupils had achieved a score of 5 or higher.
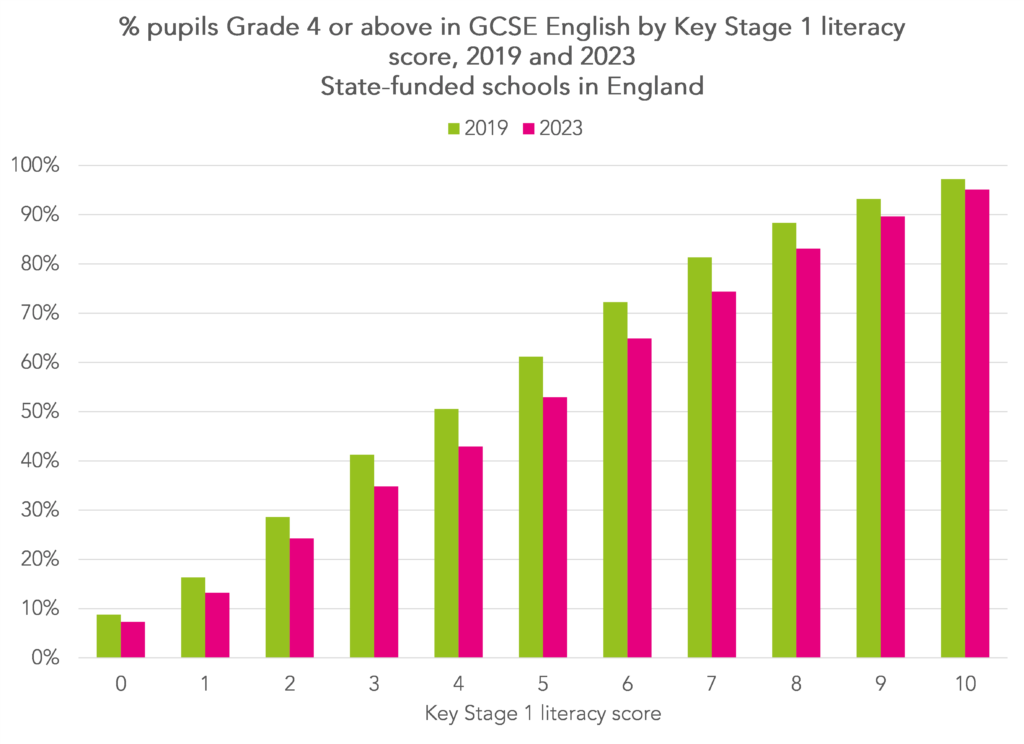
We can compare the results from the first chart to the results from the last time we ran this analysis based on the 2019 cohort.
Among the 2019 cohort, 70% of pupils achieved grade 4 or above in GCSE English language, just fractionally higher than the 2023 figure.
Proportionately fewer pupils in each KS1 band achieved grade 4 in English language in 2023. Given that attainment in GCSE English language was broadly similar for the two cohorts, this suggests that KS1 scores were higher among the 2023 cohort but this did not translate into higher attainment at KS4.
Of course, there was the not insignificant matter of a pandemic in the interim. While GCSE grades in 2023 were maintained at roughly the same level as 2019, it does not necessarily follow that the same standards were achieved in 2023 as in 2019.
GCSE attainment by pupil characteristics
Now let’s take a look at how attainment at GCSE varies by pupil characteristics. Firstly, we look at the whole cohort of 604,000 pupils.
82% of Autumn born girls who were not disadvantaged achieved grade 4 or above in English language. This compares to 39% of disadvantaged summer born boys.
When we last did this analysis, these figures were 84% and 39% respectively.
As most of our analysis relates to pupils who we track from Key Stage 1, we repeat the table removing any pupils without KS1 results. The results are largely similar.
By the end of Key Stage 1, 81% of these pupils had achieved a score of 5 in literacy. This figure varied from 93% for Autumn born girls who were not disadvantaged to 56% for disadvantaged summer born boys.
The appendix table shows the percentage of pupils in each of the 12 groups shown in the table above who achieved the key benchmarks at the end of each Key Stage.
Key Stage 1 attainment in 2023
The cohort of pupils which were assessed at the end of Key Stage 1 (end of Year 2) in 2023 were assessed using the reformed national curriculum assessments.
They would have had their Nursery and Reception years disrupted by Covid-19.
Both of these factors are relevant when we compare the KS1 attainment of the 2023 KS1 cohort to the 2023 KS4 cohort.
71% of the 2023 KS1 cohort achieved a score of 5 or above in literacy. The last time we looked at this (based on the 2019 cohort), 77% of pupils achieved this standard. This gives an indication of the effect of the pandemic on the 2023 cohort.
Comparing the attainment of different groups in 2023, we see that 85% of Autumn born girls who were not disadvantaged achieved a score of 5 or above compared to 46% of Summer born disadvantaged boys.
Changes in standardised score over time
Finally, we try to show how literacy attainment gaps change from KS1 to KS4 for the groups of pupils we look at defined by gender, disadvantage (at the end of Key Stage 1) and term of birth.
The use of standardised scores gives us a way of using a score that has been made comparable across Key Stages.
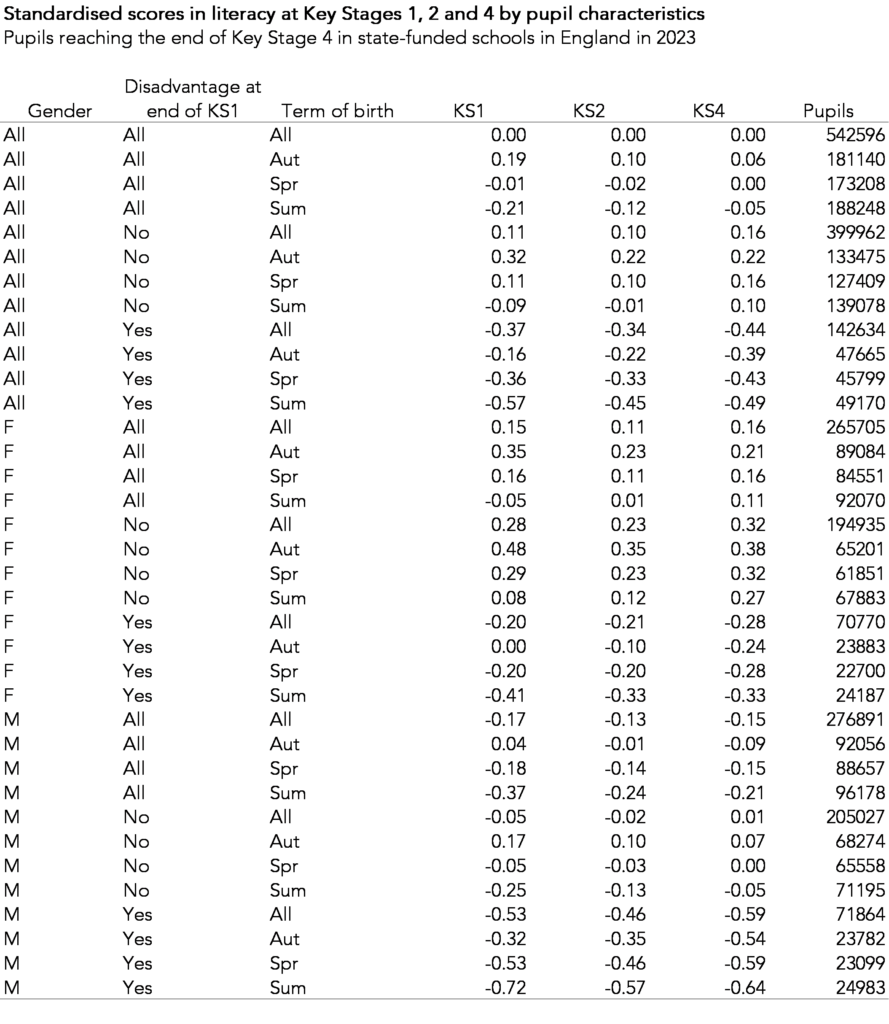
Results are shown in the table below. By definition the mean score for each Key Stage is 0.
There are lots of numbers in this table but let’s pick out some of the key ones.
Firstly, the literacy attainment gap at KS4 for all disadvantaged pupils compared to all non-disadvantaged pupils in 2023 was 0.16 – (-0.44) = 0.6SD standard deviations. For reference, the standard deviation in GCSE English language was 2.13 points[5].
0.6SD at KS4 can be compared with the gaps at KS1 and KS2. These were 0.48SD and 0.44SD respectively. In other words, the attainment gap widened between KS2 and KS4.
We also see that summer born pupils catch-up to some extent.
Comparing the attainment of all summer born pupils to all autumn born pupils, attainment gaps change from 0.4SD at KS1 to 0.22SD at KS2 to 0.11SD at KS4.
These changes in gap between Autumn and Summer born pupils are consistent across different groups of pupils.
For summer born disadvantaged boys, the gaps change from 0.4SD at KS1 to 0.22SD at KS2 to 0.1SD at KS4.
And for Autumn born non-disadvantaged girls, the gaps change from 0.4SD at KS1 to 0.23SD at KS2 to 0.11SD at KS4.
Finally, we can compare the attainment gap between autumn born girls who are not disadvantaged and summer born disadvantaged boys.
This changes from 1.2SD at KS1 to 0.92SD at KS2 and then to 1.02SD at KS4.
Summing up
It has been four years since we last looked at the relationship between attainment in literacy at Key Stage 1 and attainment in GCSE English language.
The Covid-19 pandemic notwithstanding, the sorts of patterns we previously reported still hold. Although some pupils who did not achieve our benchmark score of 5 in literacy at KS1 do go on to achieve grade 4 in GCSE English language, those with higher scores are more likely to do so.
We see some closing of attainment gaps between autumn and summer born pupils but a widening of the gap between disadvantaged and non-disadvantaged pupils.
- Includes maintained schools and academies. Includes mainstream schools and special schools
- Due to being overseas, elsewhere in the UK or in the independent sector. Similarly, some pupils will have been assessed at KS1 or KS2 but left the country by the time of KS4
- Grammar, punctuation and spelling
- Ever eligible for free school meals when aged 5 to 7
- Grades are converted into points, e.g. grade 1= 1 point up to grade 9= 9 points
Want to stay up-to-date with the latest research from FFT Education Datalab? Sign up to Datalab’s mailing list to get notifications about new blogposts, or to receive the team’s half-termly newsletter.








In my research I noted the combination on summer born and disadvantaged were the kids who performed most poorly in metrics. Also disadvantaged girls did anomalously poorly at maths, so much so their overall performance score was significantly poorer.