




Results for GCSEs and other Level 2 qualifications are out today. And, as ever, we’ve been digging into all the published data to bring you our analysis of all the main trends.
Our analysis is based on the national figures published by the Joint Council for Qualifications and Ofqual. If you want more detail about any individual GCSE subject then visit our dedicated results microsite.
To find out where your own school sits, FFT’s Early Results Service benchmarks your results against national data as soon as you upload them – log in to upload, or find out more. FFT will be publishing its own 2026 national figures later today, and running a free webinar tomorrow (Friday) at 11am, focussing on where your school sits in the national picture.
Datalab will also be running a free webinar on Thursday 10th September at 4pm, looking at the national headlines in more depth, and what they might mean for the year ahead. Sign up now to book your place.
Grades are up very, very slightly from last year
When A-Level results came out last week, there were headlines about the increase in top grades, even though the increase was almost imperceptible. And it’ll probably be the same story today – the proportion of entries in England graded 7 or above has increased but by just 0.1 percentage points, from 23.0% to 23.1%.
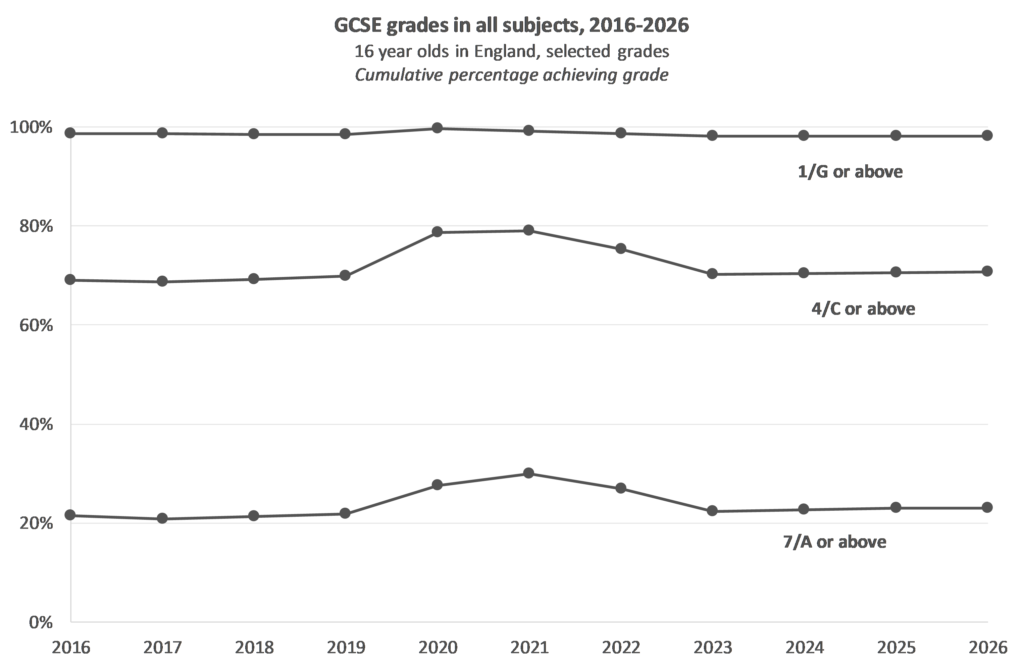
The proportion achieving a grade 4 or above has increased by slightly more: 0.2 percentage points, from 70.5% to 70.7%.
While the increases are small, it is the third year in a row that grades have increased. And grades remain slightly above pre-pandemic levels: in 2019, 21.9% of entries were graded 7 or above and 69.9% graded 4 or above.
In Wales and Northern Ireland, the pattern this year is similar to England.
Across all three nations, the proportion of entries graded 7/A or above has increased by 0.1 percentage points. And in all three, it remains somewhat above pre-pandemic levels.
Grades are up by more in some subjects, including modern foreign languages
While overall the proportion of top grades remains virtually the same as last year, there is some variation by subject.
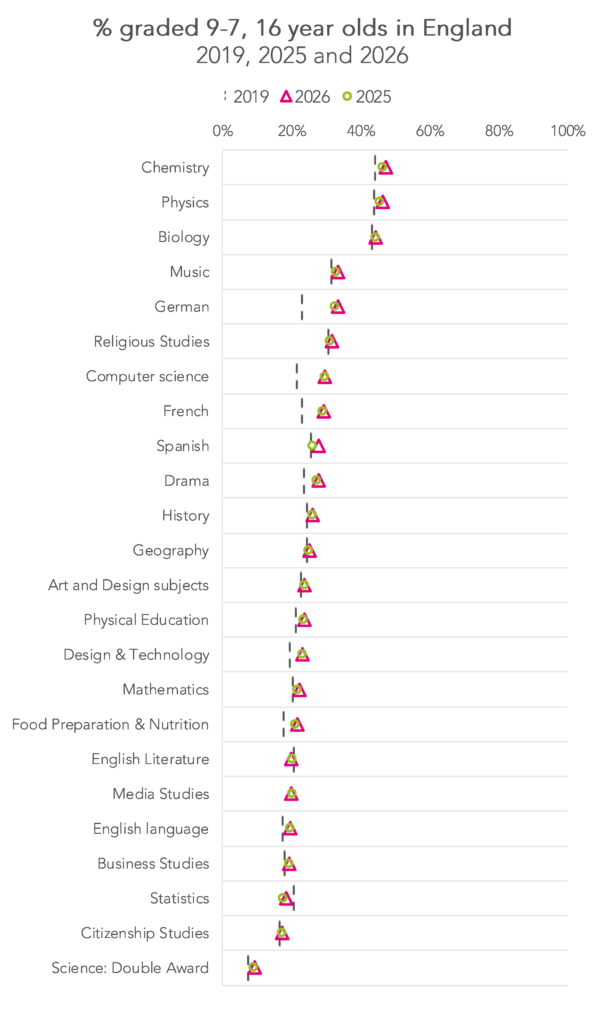
The subject with the largest increase is Spanish, in which the proportion achieving top grades is up by nearly two percentage points, from 26.0% to 27.8%. Grades in German and French also saw relatively high increases of 0.7 and 0.6 percentage points.
This year’s MFL pupils are the first to take exams under the new specifications. It seems likely that the increase in top grades is linked to these changes as we know of no attempts to change grade boundaries – despite our long-held belief that grading in modern foreign languages is unduly severe.
When pupil level data for this cohort becomes available, we will be revisiting our series on grade severity to delve into this in more detail.
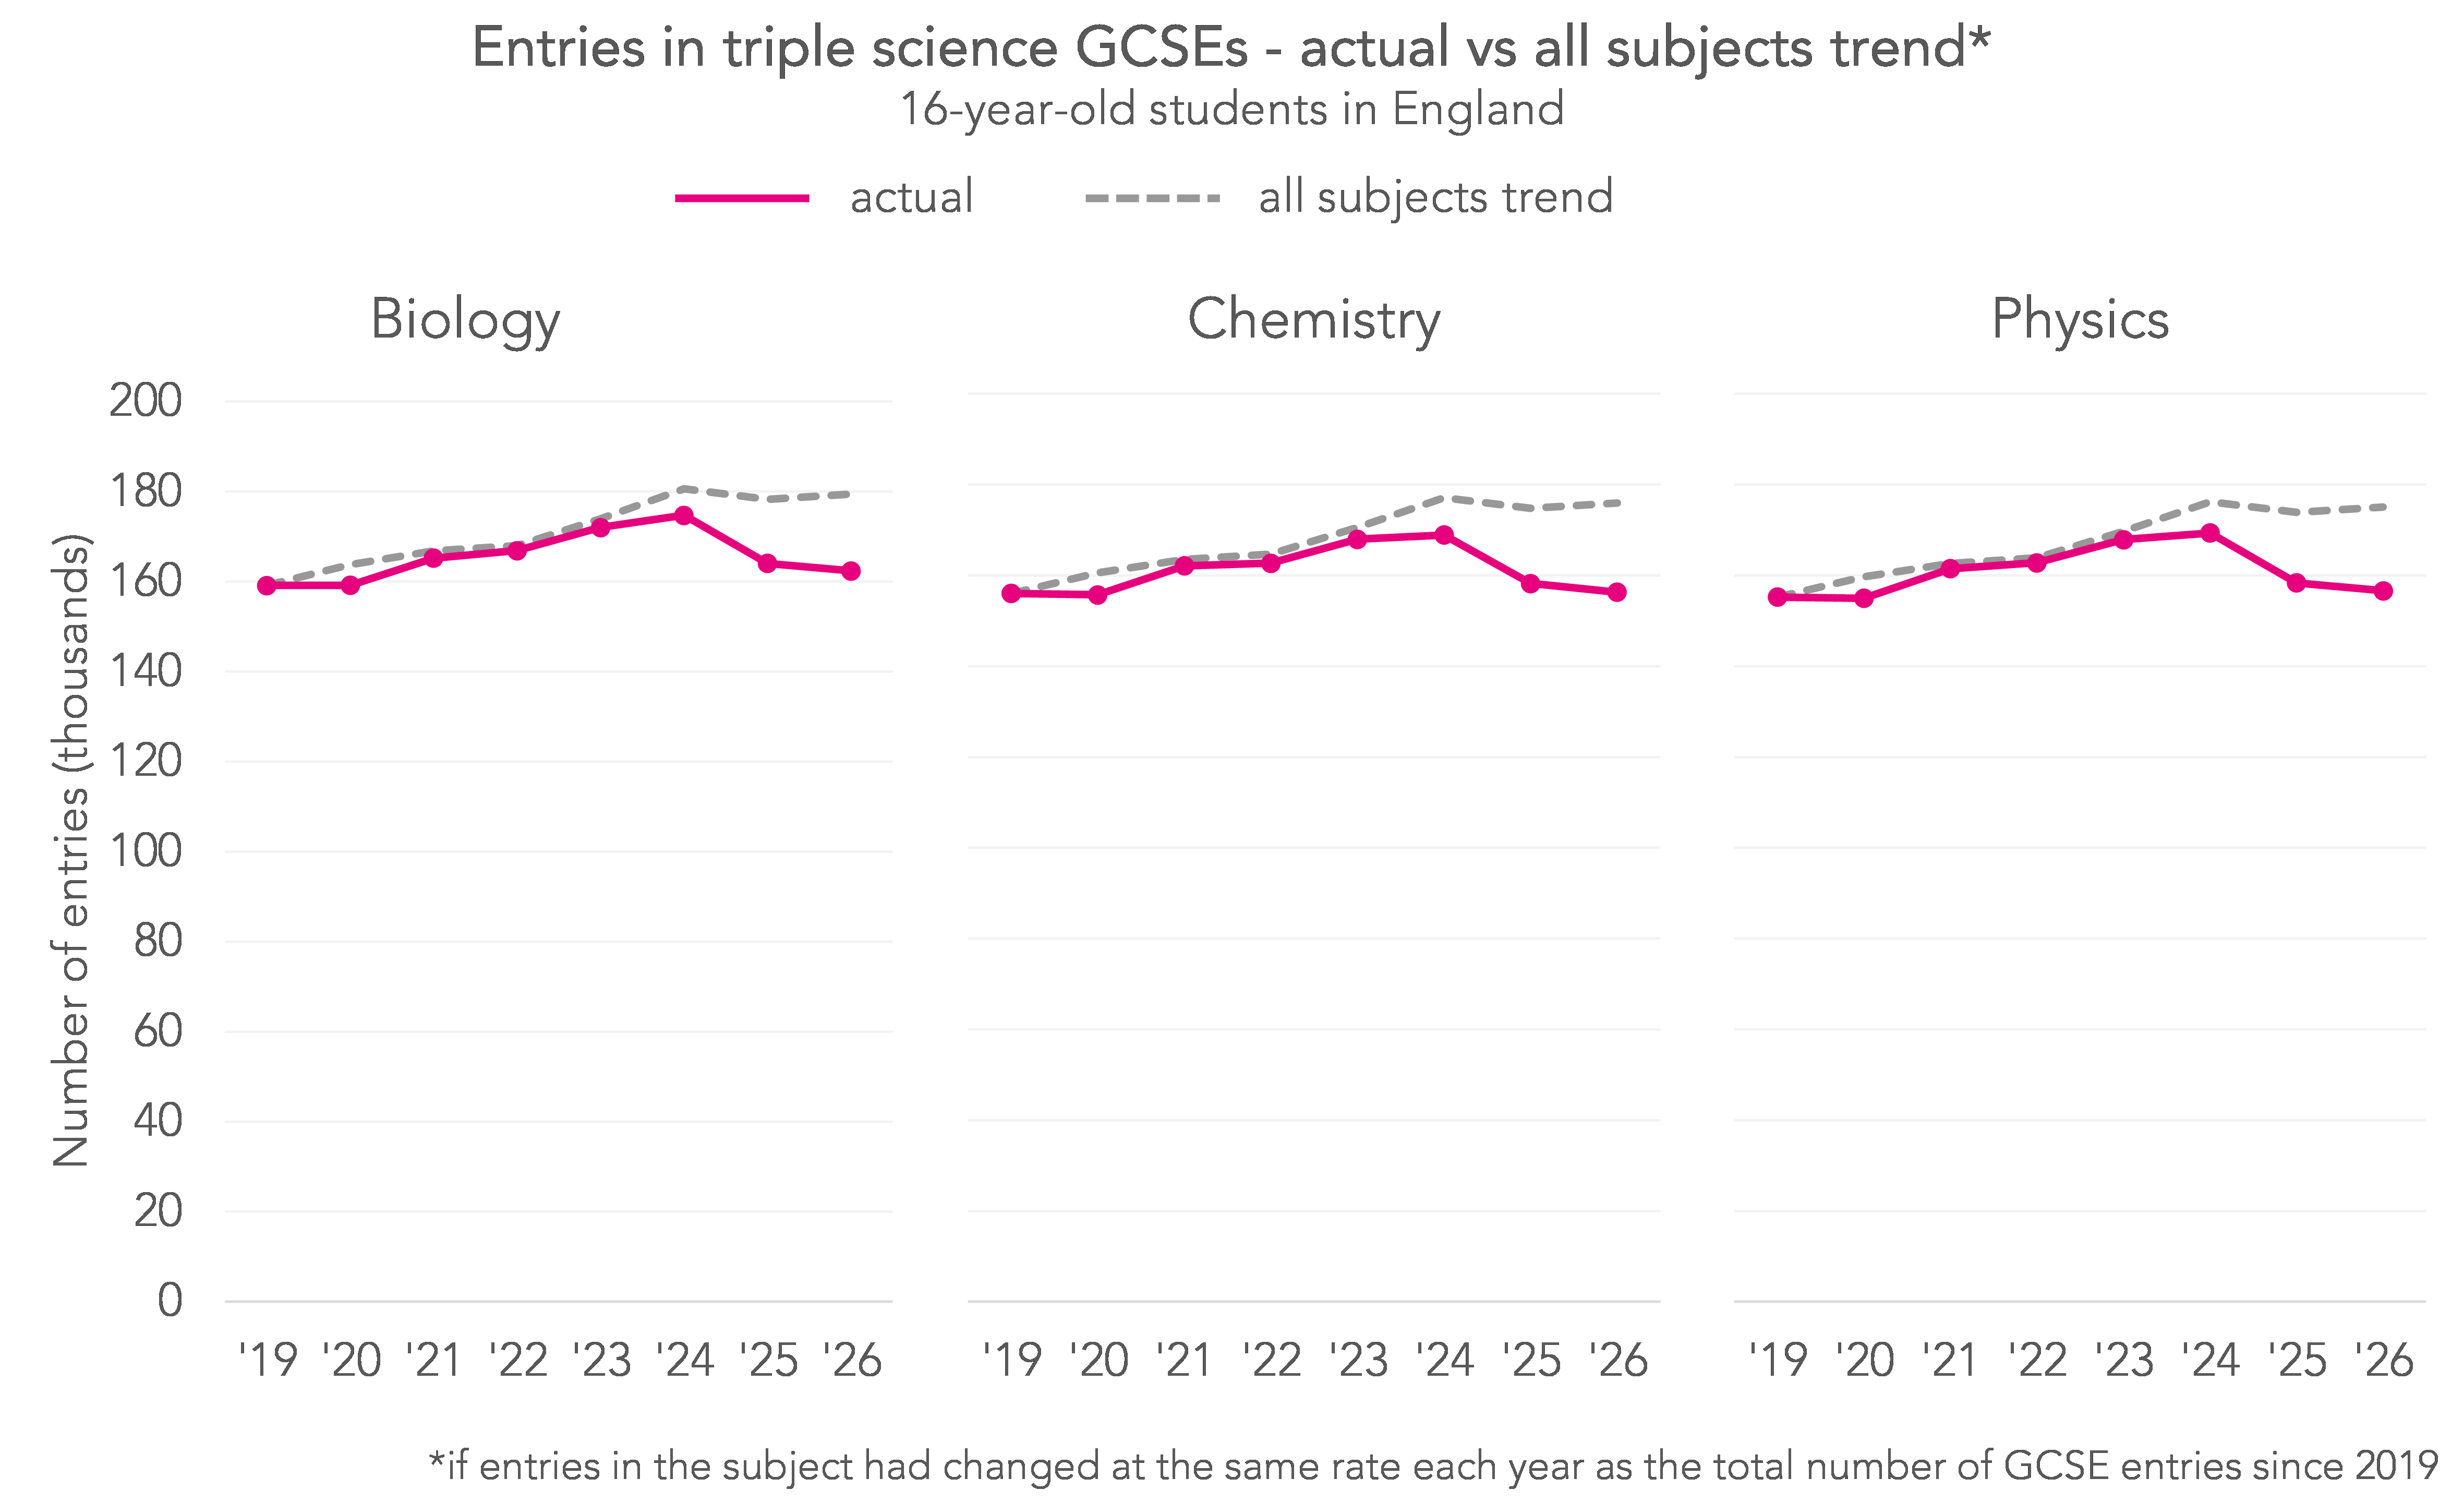
Other subjects with relatively large increases in top grades include chemistry and physics, up by 1.0 and 0.9 percentage points, although, interestingly, not biology, which increased by just 0.1 percentage points. But while grades are up, entries to all three subjects are down for the second year in a row, as we discuss below.
At the other end of the scale, two subjects have seen a small fall in top grades: media studies [1] and English literature, which both fell by 0.4 percentage points.
The proportion of grades awarded 9-4 increased overall by 0.2 percentage points from last year.
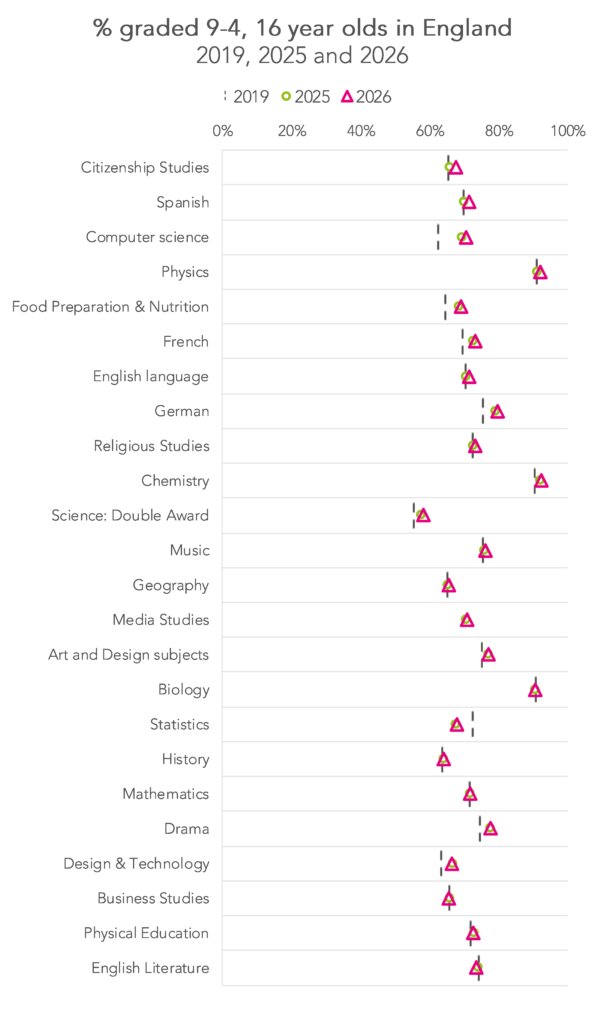
As at grade 7, English literature saw a fall in the proportion of pupils achieving grade 4 or above. There are also relatively high increases in modern foreign languages and in physics and chemistry, as at grade 7. Unlike at grade 7, citizenship studies and computer science are among the subjects with the highest increase in the proportion achieving grade 4 or above.
The gender gap in grading has fallen again
Overall, a higher proportion of entries from female pupils received top grades than male this year: 25.5% of entries from female pupils compared to 20.7% from male were graded 7 or above.
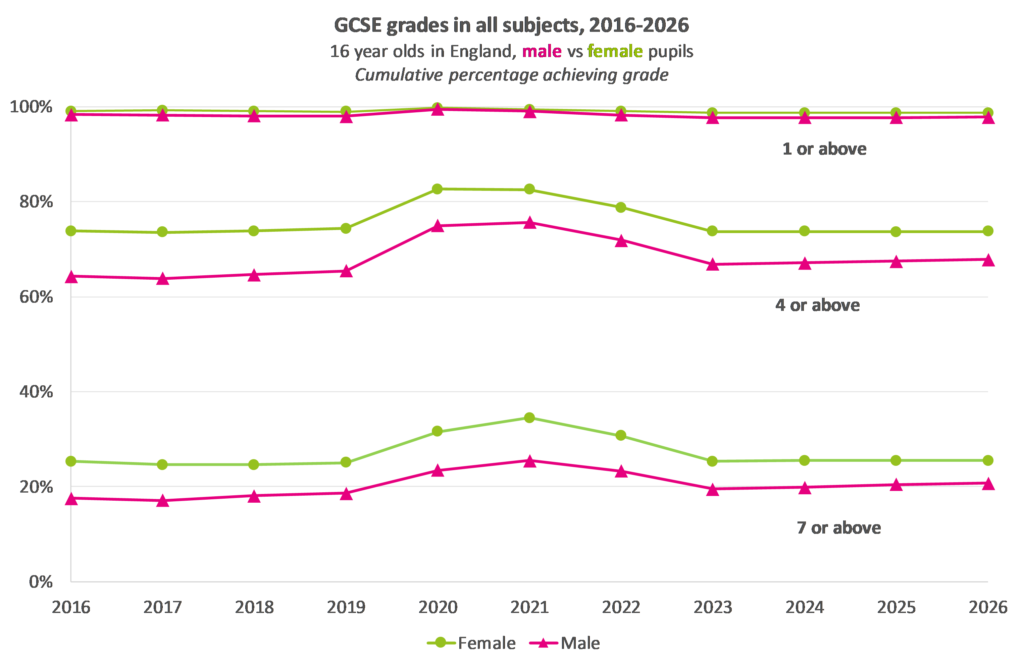
But that gap has fallen this year, for the fifth year in a row.
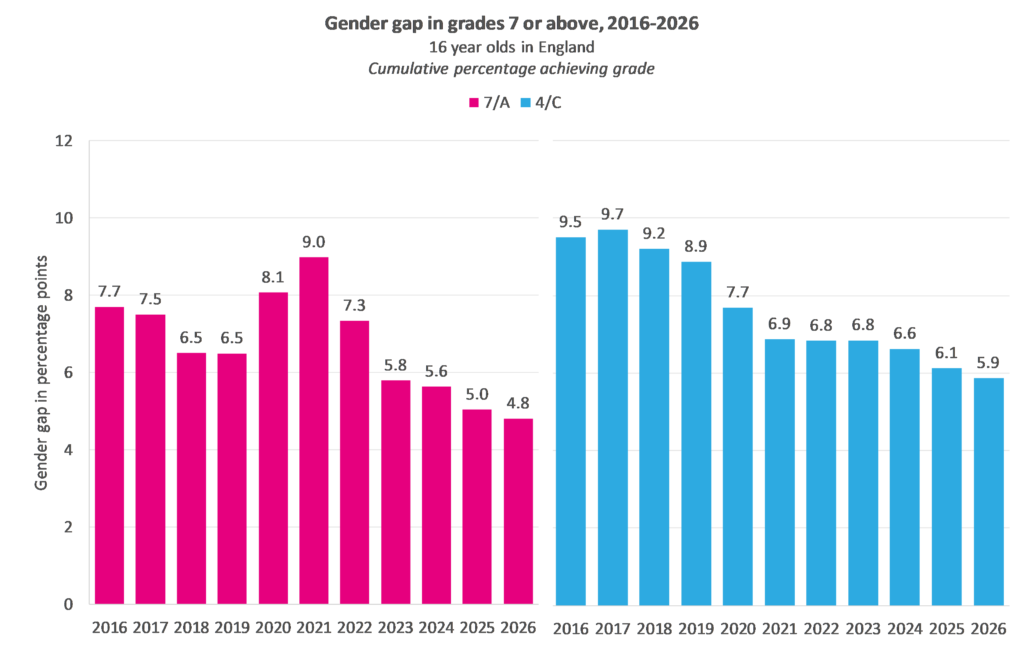
The gap in top grades stood at a high of 9.0 percentage points in 2021, when grades were awarded via teacher assessed grades following the cancellation of public exams during the pandemic. It has now fallen to well below pre-pandemic levels.
At grade 9-4, there were no extreme peaks during the pandemic. Instead, we see a consistent fall in the gap over the last few years, with the exception of a very small increase between 2022 and 2023 of less than 0.1 percentage points.
The change in the gap appears to have come from an increase in boys’ grades rather than a fall in girls’ grades. During and immediately after the pandemic grades for both male and female pupils were higher, but since 2023 the proportion of female entries graded 9-7 has changed very little since 2023, up just 0.2 percentage points, whereas for boys the increase is 1.2 percentage points. At 9-4, there has been no change for female entries but an increase of 1.0 for male.
Numbers of entries are similar overall, but some subjects have seen increases
The total number of GCSE entries has increased by 0.7% since last year, explainable by an increase of around 1% in the population of 16 year-old pupils.
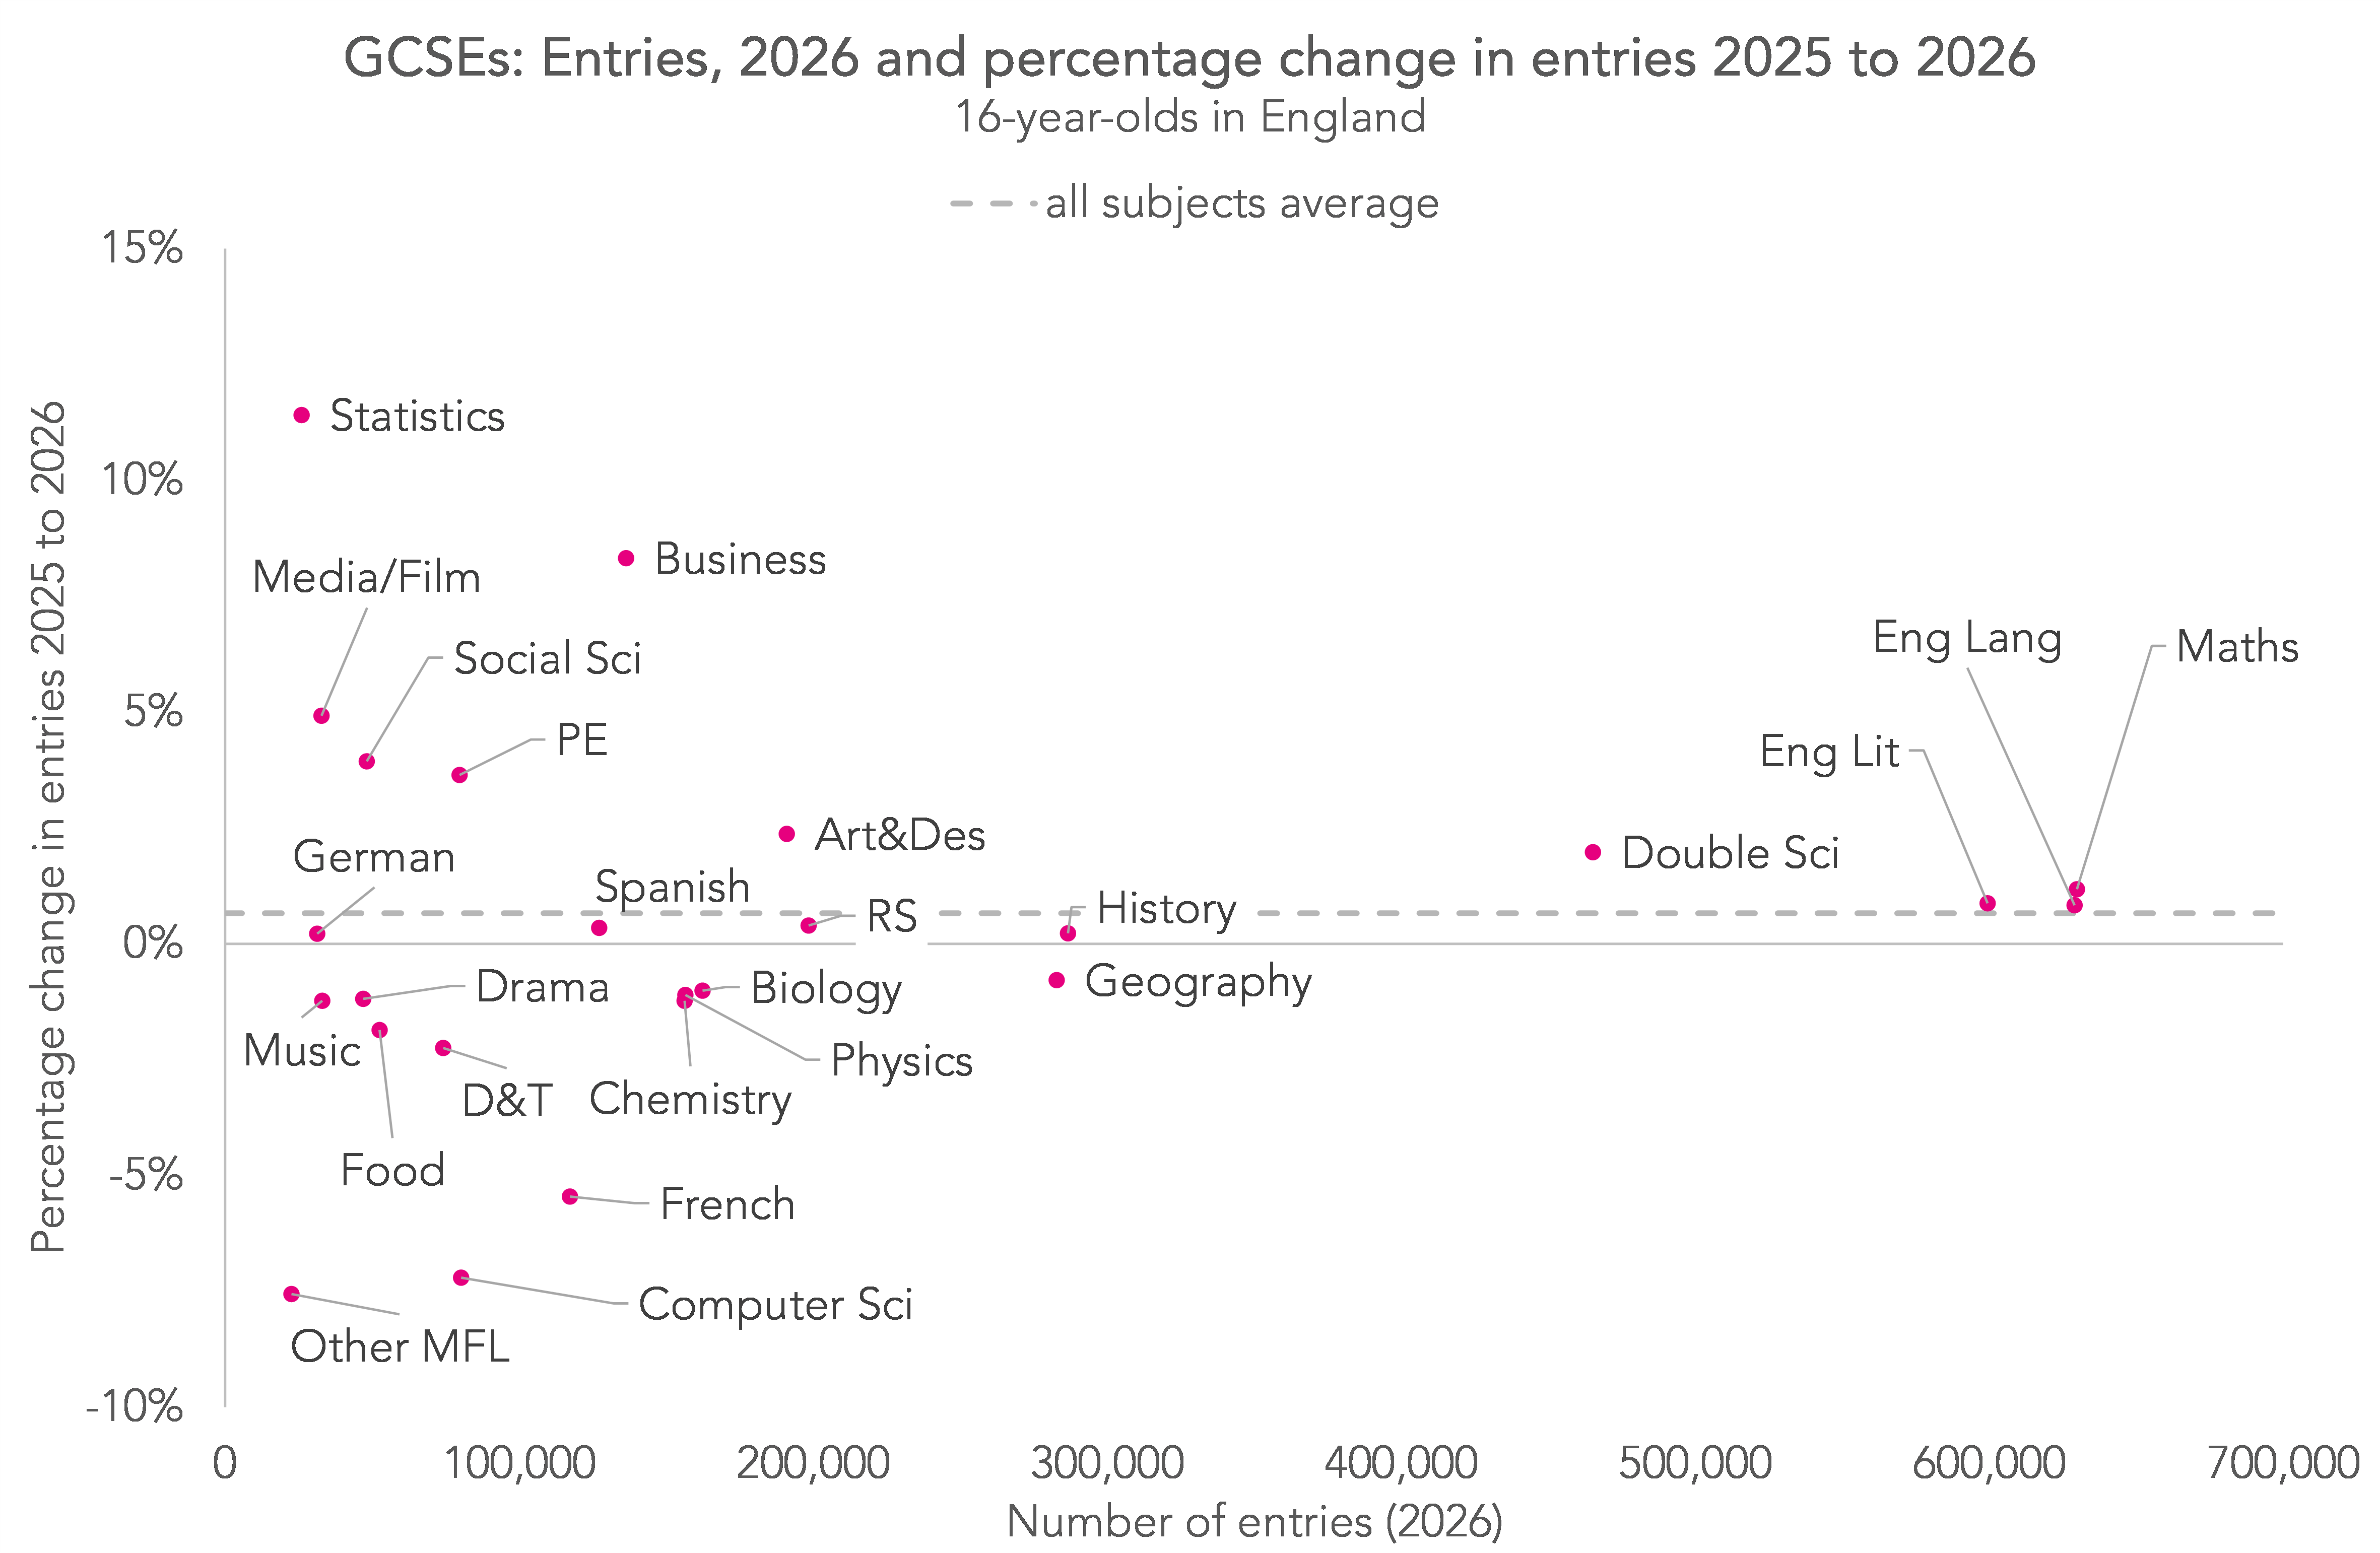
The subjects with the biggest percentage increases in entries were statistics, business studies, and media/film. The subjects with the biggest decreases were other modern foreign languages, computer science, and French.
In our preview post we noted that entries to religious studies had decreased. This was using provisional entries data for short course and full course combined. Today’s entries data, for full course only, shows that entries to full course RS have actually increased, broadly in-line with the overall increase of 0.7%.
For the third year running, we’ve seen a relative decrease in entries to the separate sciences (biology, chemistry and physics), and an increase to double science, though this shift from triple to double is smaller than we saw last year.
The proportion of 9-4 grades in English and maths is down overall, but not for 16-year-olds
You might see reports of the “pass rate” for English and maths having fallen this year. That’s because, looking at the figures for all GCSE candidates, then the proportion of grades awarded a grade 9-4 in English language and maths is down slightly – by 0.2%pts in English and 1.0%pts in maths.
However, the overall figures for GCSE English and maths are skewed by large numbers of older candidates, often re-taking the qualifications at post-16 having not yet reached the grade 4 benchmark.
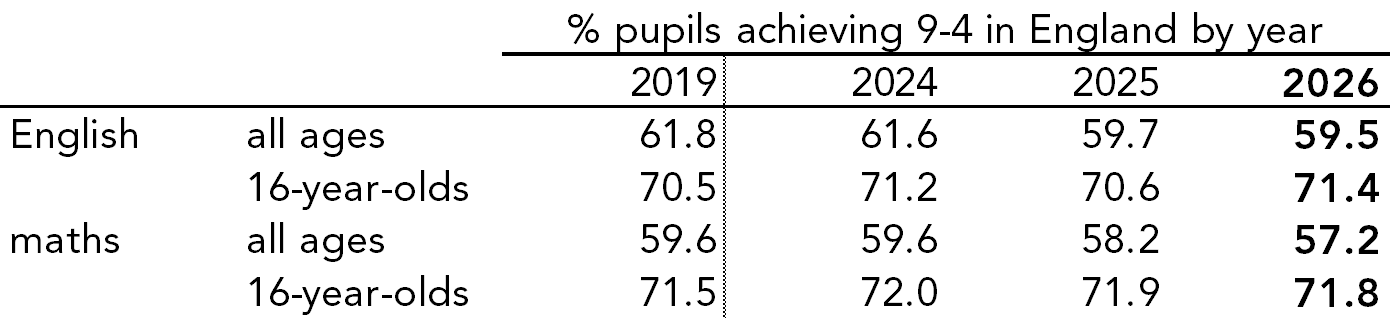
If we just look at 16 year-old pupils, then the proportion of grades awarded 9-4 in English language has actually increased by 0.8%pts, and in maths it’s stayed more-or-less the same (down by 0.1%pts).
Re-take entries are up, but grades remain low
The reason why the overall and 16 year-old headline English and maths trends don’t match is that there’s been another increase in the number of entries from older candidates this year. In English language, the number of entries from 17-19 year-olds has increased by 7% (160 thousand to 171 thousand), and in maths by 6% (187 thousand to 199 thousand).
We had hoped that we might see an increase in the proportion of re-take students achieving a grade 4 or better, with rules around the amount of teaching time having tightened this year, but unfortunately there’s actually been another fall.
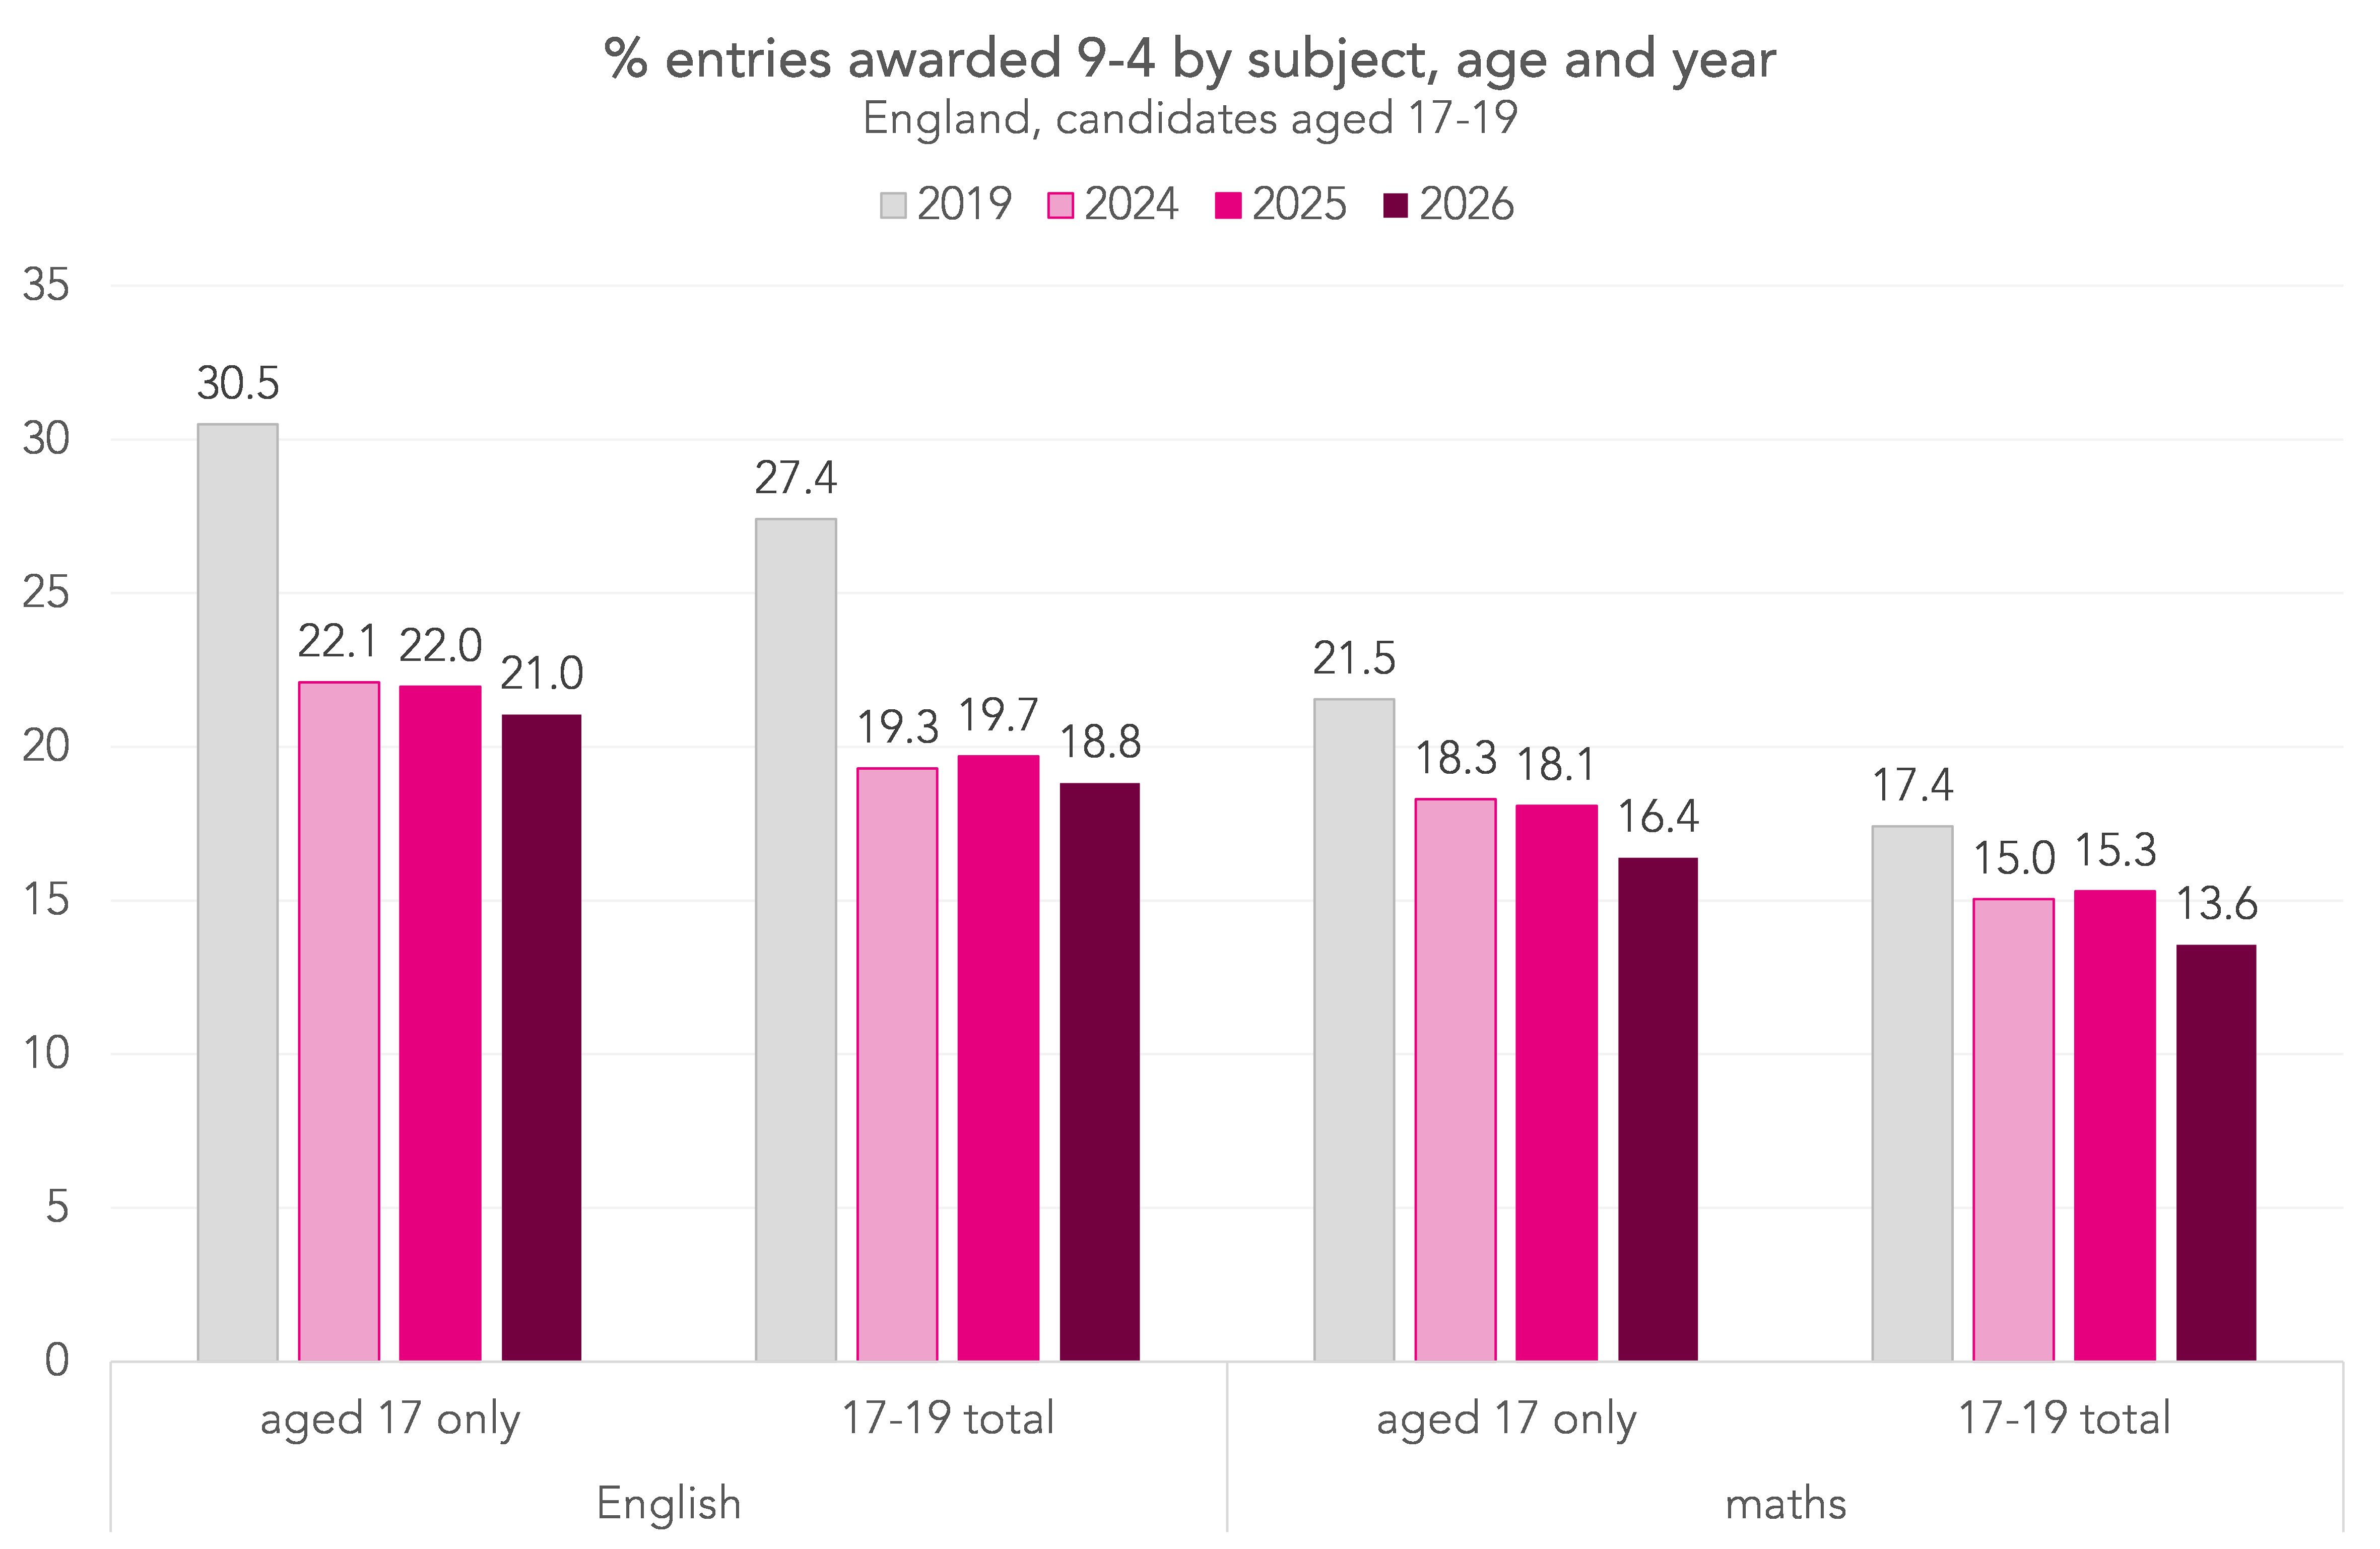
Today’s data doesn’t tell us about how many 17-19 year olds who did not achieve grade 4 by the end of KS4 don’t enter a resit qualification, nor how many resit more than once. This is something we looked at previously.
Nonetheless, these results will strengthen calls for alternative pathways for some students, recommended by the curriculum review earlier this year, and mentioned by the education secretary in interviews this morning.
The National Reference Test finally proves its worth
Last year, we bemoaned the fact that, although the National Reference Test (NRT) showed an increase in attainment in English, grades at GCSE actually fell. And in our results day preview post, we said that the NRT would probably be ignored again this year.
But we are eating those words, because Ofqual have reported that they have moved grade boundaries in maths this year to reflect findings from the NRT. The NRT benchmarks attainment against grades in 2017 and this year’s test shows a long-term slight increase in attainment at grade 9-7 and 9-5 in maths.
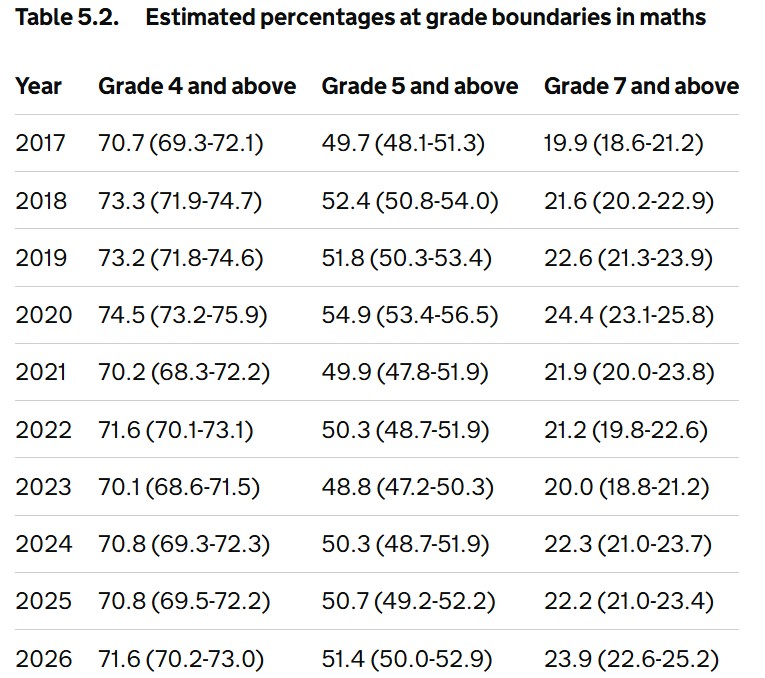
As a result, boundaries for higher grades were shifted down slightly this year so that more pupils achieved top grades. In practice this is a relatively small change: 21.2% of entries in maths received a grade 7 or above this year, compared with 20.3% last year. That’s an increase of 0.8 percentage points.
In English language, results for the 2026 NRT shows lower attainment compared to 2017 at each grade boundary, but none of these differences have been considered sufficiently large to prompt Ofqual into adjusting grading standards.
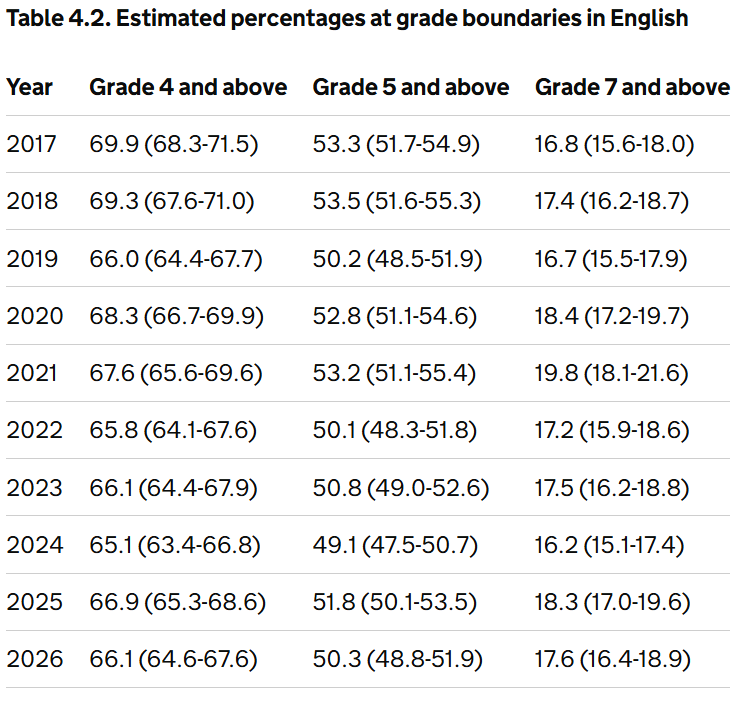
What we can say from 10 years of the NRT is that it is not designed to detect small, incremental changes in attainment from year to year. Rather it is being used to detect change over a longer time period, benchmarking attainment against 2017 levels.
Attainment in vocational and technical qualifications has improved again
JCQ awarding organisations awarded 445 thousand VTQ results this year. Of these, 339 thousand were for Tech Awards, 11 thousand for Technical Certificates, and the remaining 95 thousand for non-performance table qualifications.
Focussing on the biggest category, Tech Awards graded L1P/L1M/L1D/L2P/L2M/L2D/L2D*, we see an increase in grades for the second year running.
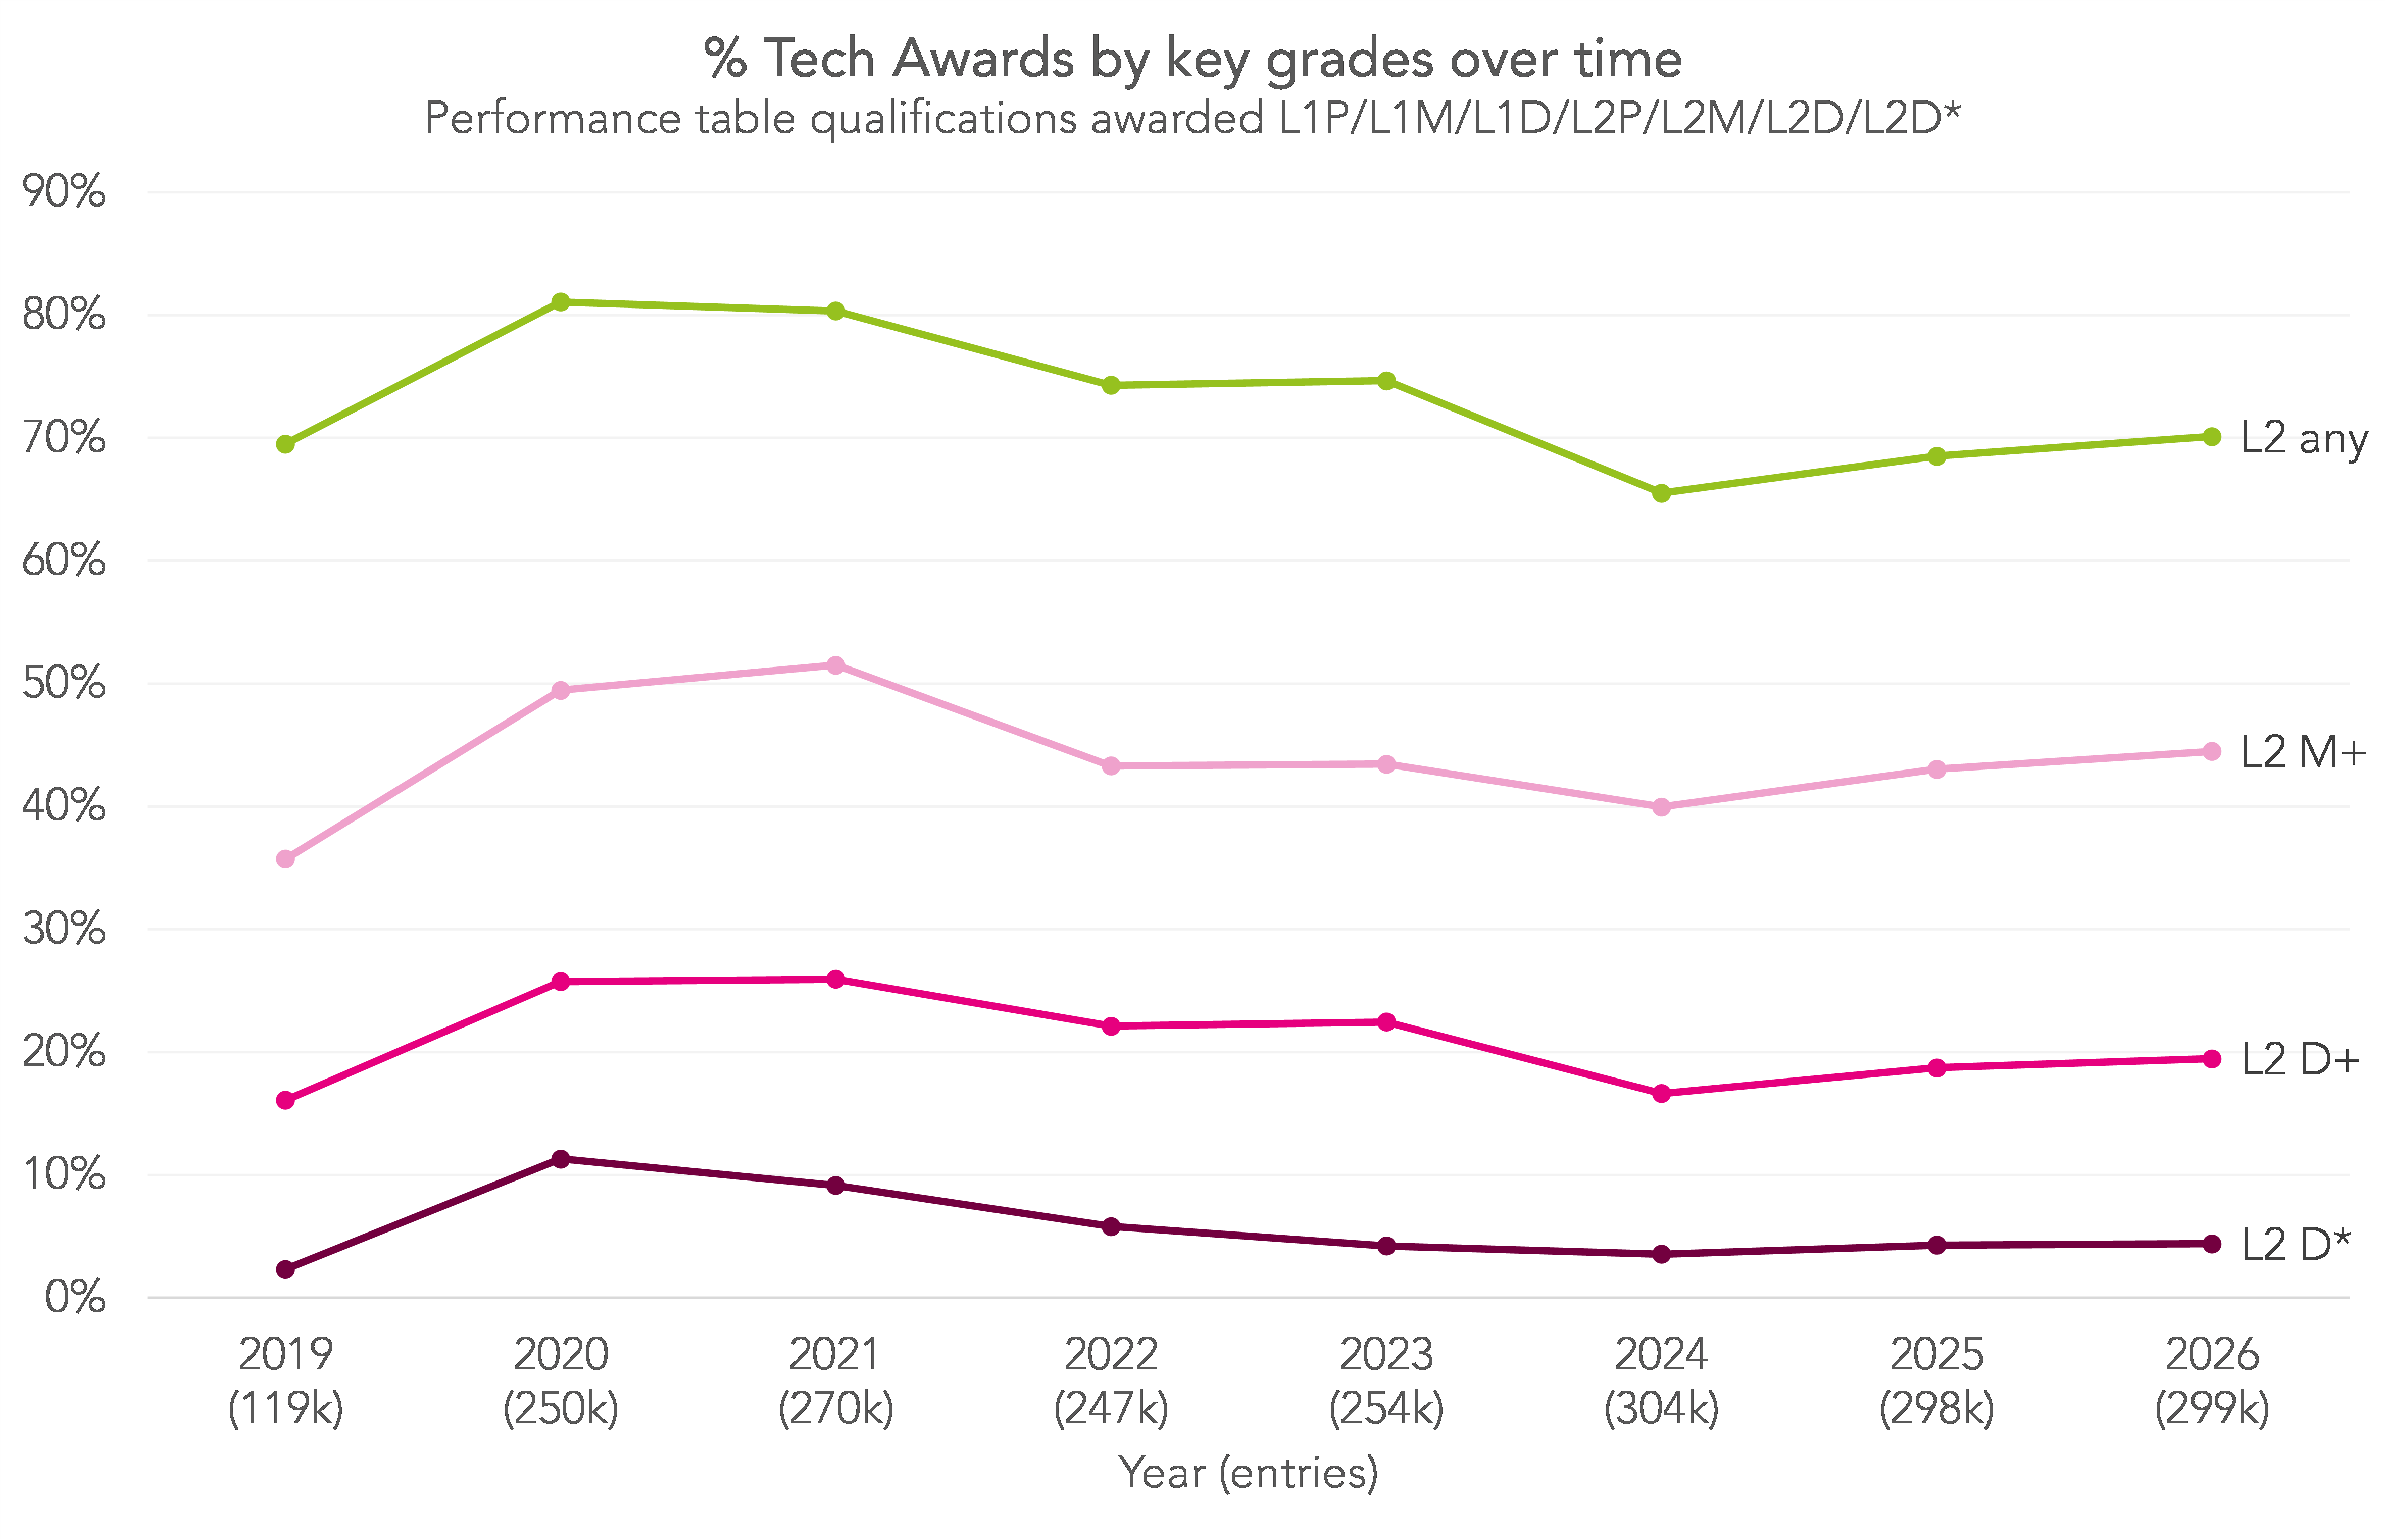
The percentage of entries awarded top grades, a Level 2 Distinction or Distinction*, is 19.5%, up from 18.7% last year. The percentage awarded a Level 2 Pass or above is also up, to 70.1% from 68.5% last year.
The most popular subject areas in terms of entries are Leisure, Travel and Tourism (83 thousand), Health, Public Services and Care (74 thousand), and Arts, Media and Publishing (59 thousand).
The regional picture is mixed
JCQ has also published data on achievements in GCSEs (all subjects) broken down by English region.
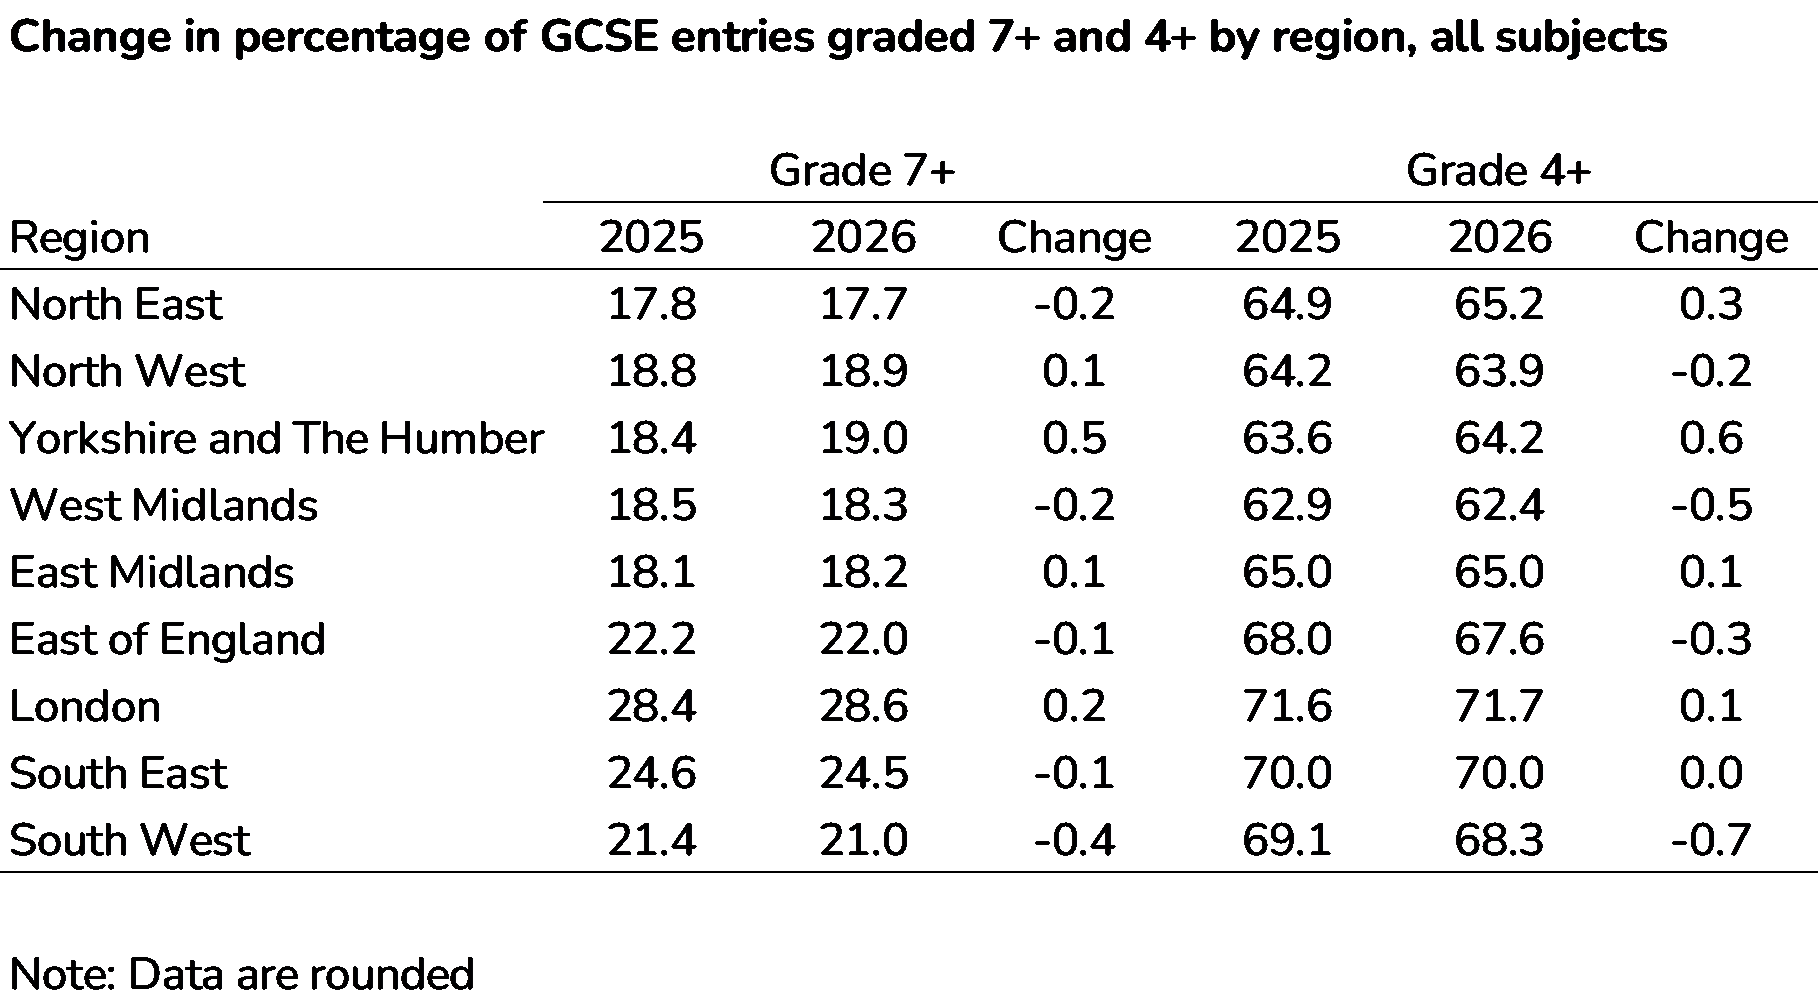
On the surface, this shows that London, the highest attaining region in recent years, has not increased its advantage over the North East or Yorkshire and the Humber at Grade 4+. However, it has increased its advantage over the West Midlands at both grade 7+ and grade 4+ and over the North West at grade 4+.
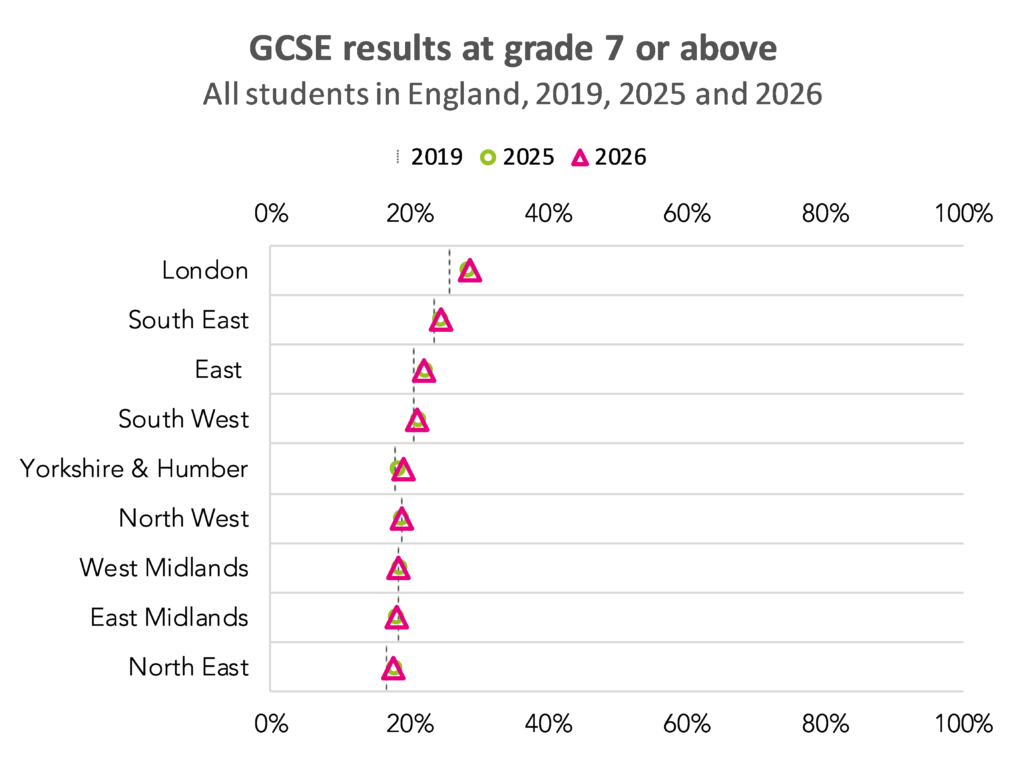
In the following chart we see how the percentage of pupils achieving 7+ has changed since pre-pandemic times (2019) in each region. London is the only region where 2026 results are perceptibly higher than 2019.
In any case, the data published today don’t show differences in the numbers of entries between regions, nor the balance of GCSEs and VTQs between regions. If we go back to data for 2025, for example, pupils in state schools in London entered 7.79 GCSEs (excluding VTQs) compared to 6.6 in the North East. The gap reduces slightly when VTQs are included (8.1 for London and 7.5 for the North East). Measures such as Attainment 8 and Progress 8 reflect both attainment and number of entries.
Better data on regional (and local) differences will be available in October when DfE publishes its provisional KS4 statistics.
Want to stay up-to-date with the latest research from FFT Education Datalab? Sign up to Datalab’s mailing list to get notifications about new blogposts, or to receive the team’s half-termly newsletter.
[1]: We do not show a 2019 figure for media studies because figures were not published separately for this subject in 2019. At this time, figures were rolled into Media / Film / TV studies.
Any achievement by month of birth data?