Attendance code B: Not absent but not present at school
It is rare for pupils to be regularly educated off-site. But there are a small number of pupils who spend more time off site than at the school at which they are registered.
It is rare for pupils to be regularly educated off-site. But there are a small number of pupils who spend more time off site than at the school at which they are registered.
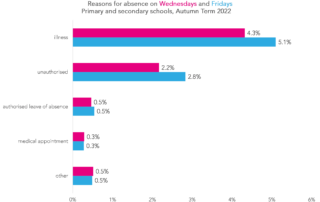
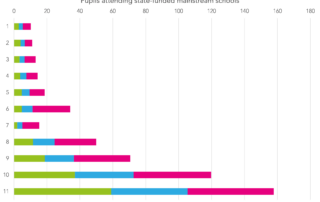
An updated picture of pupil absence by day of the week
We look at whether there was an increase in absence among disadvantaged pupils on World Book Day, Christmas Jumper Day and Children in Need Day.
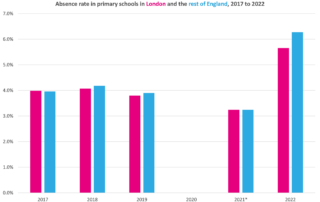
We run through some options for evaluating the impact on absence and attainment of extending free school meals to pupils in Years 3 to 6 in schools in the Capital.

Ofsted argue that inspections support school choice. But can this be true if some schools haven't been inspected for several years?

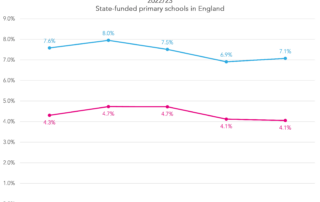
At the end of last term we saw high levels of illness-related absence. In this post, we look at absence in Spring Term so far to see whether things have improved.

Why looking at the number of spells of absence alongside rates of absence helps to identify those who are most likely to remain persistently absent
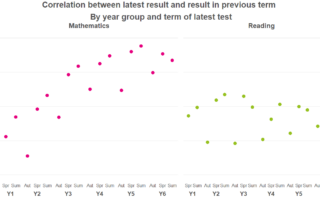
Many primary schools use termly standardised tests. We take a look at how much pupils' scores change from term to term.
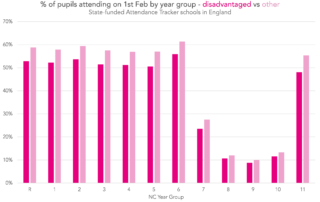
New data from Attendance Tracker looking at pupil attendance during last week's strike action