The impact of absence on Progress 8
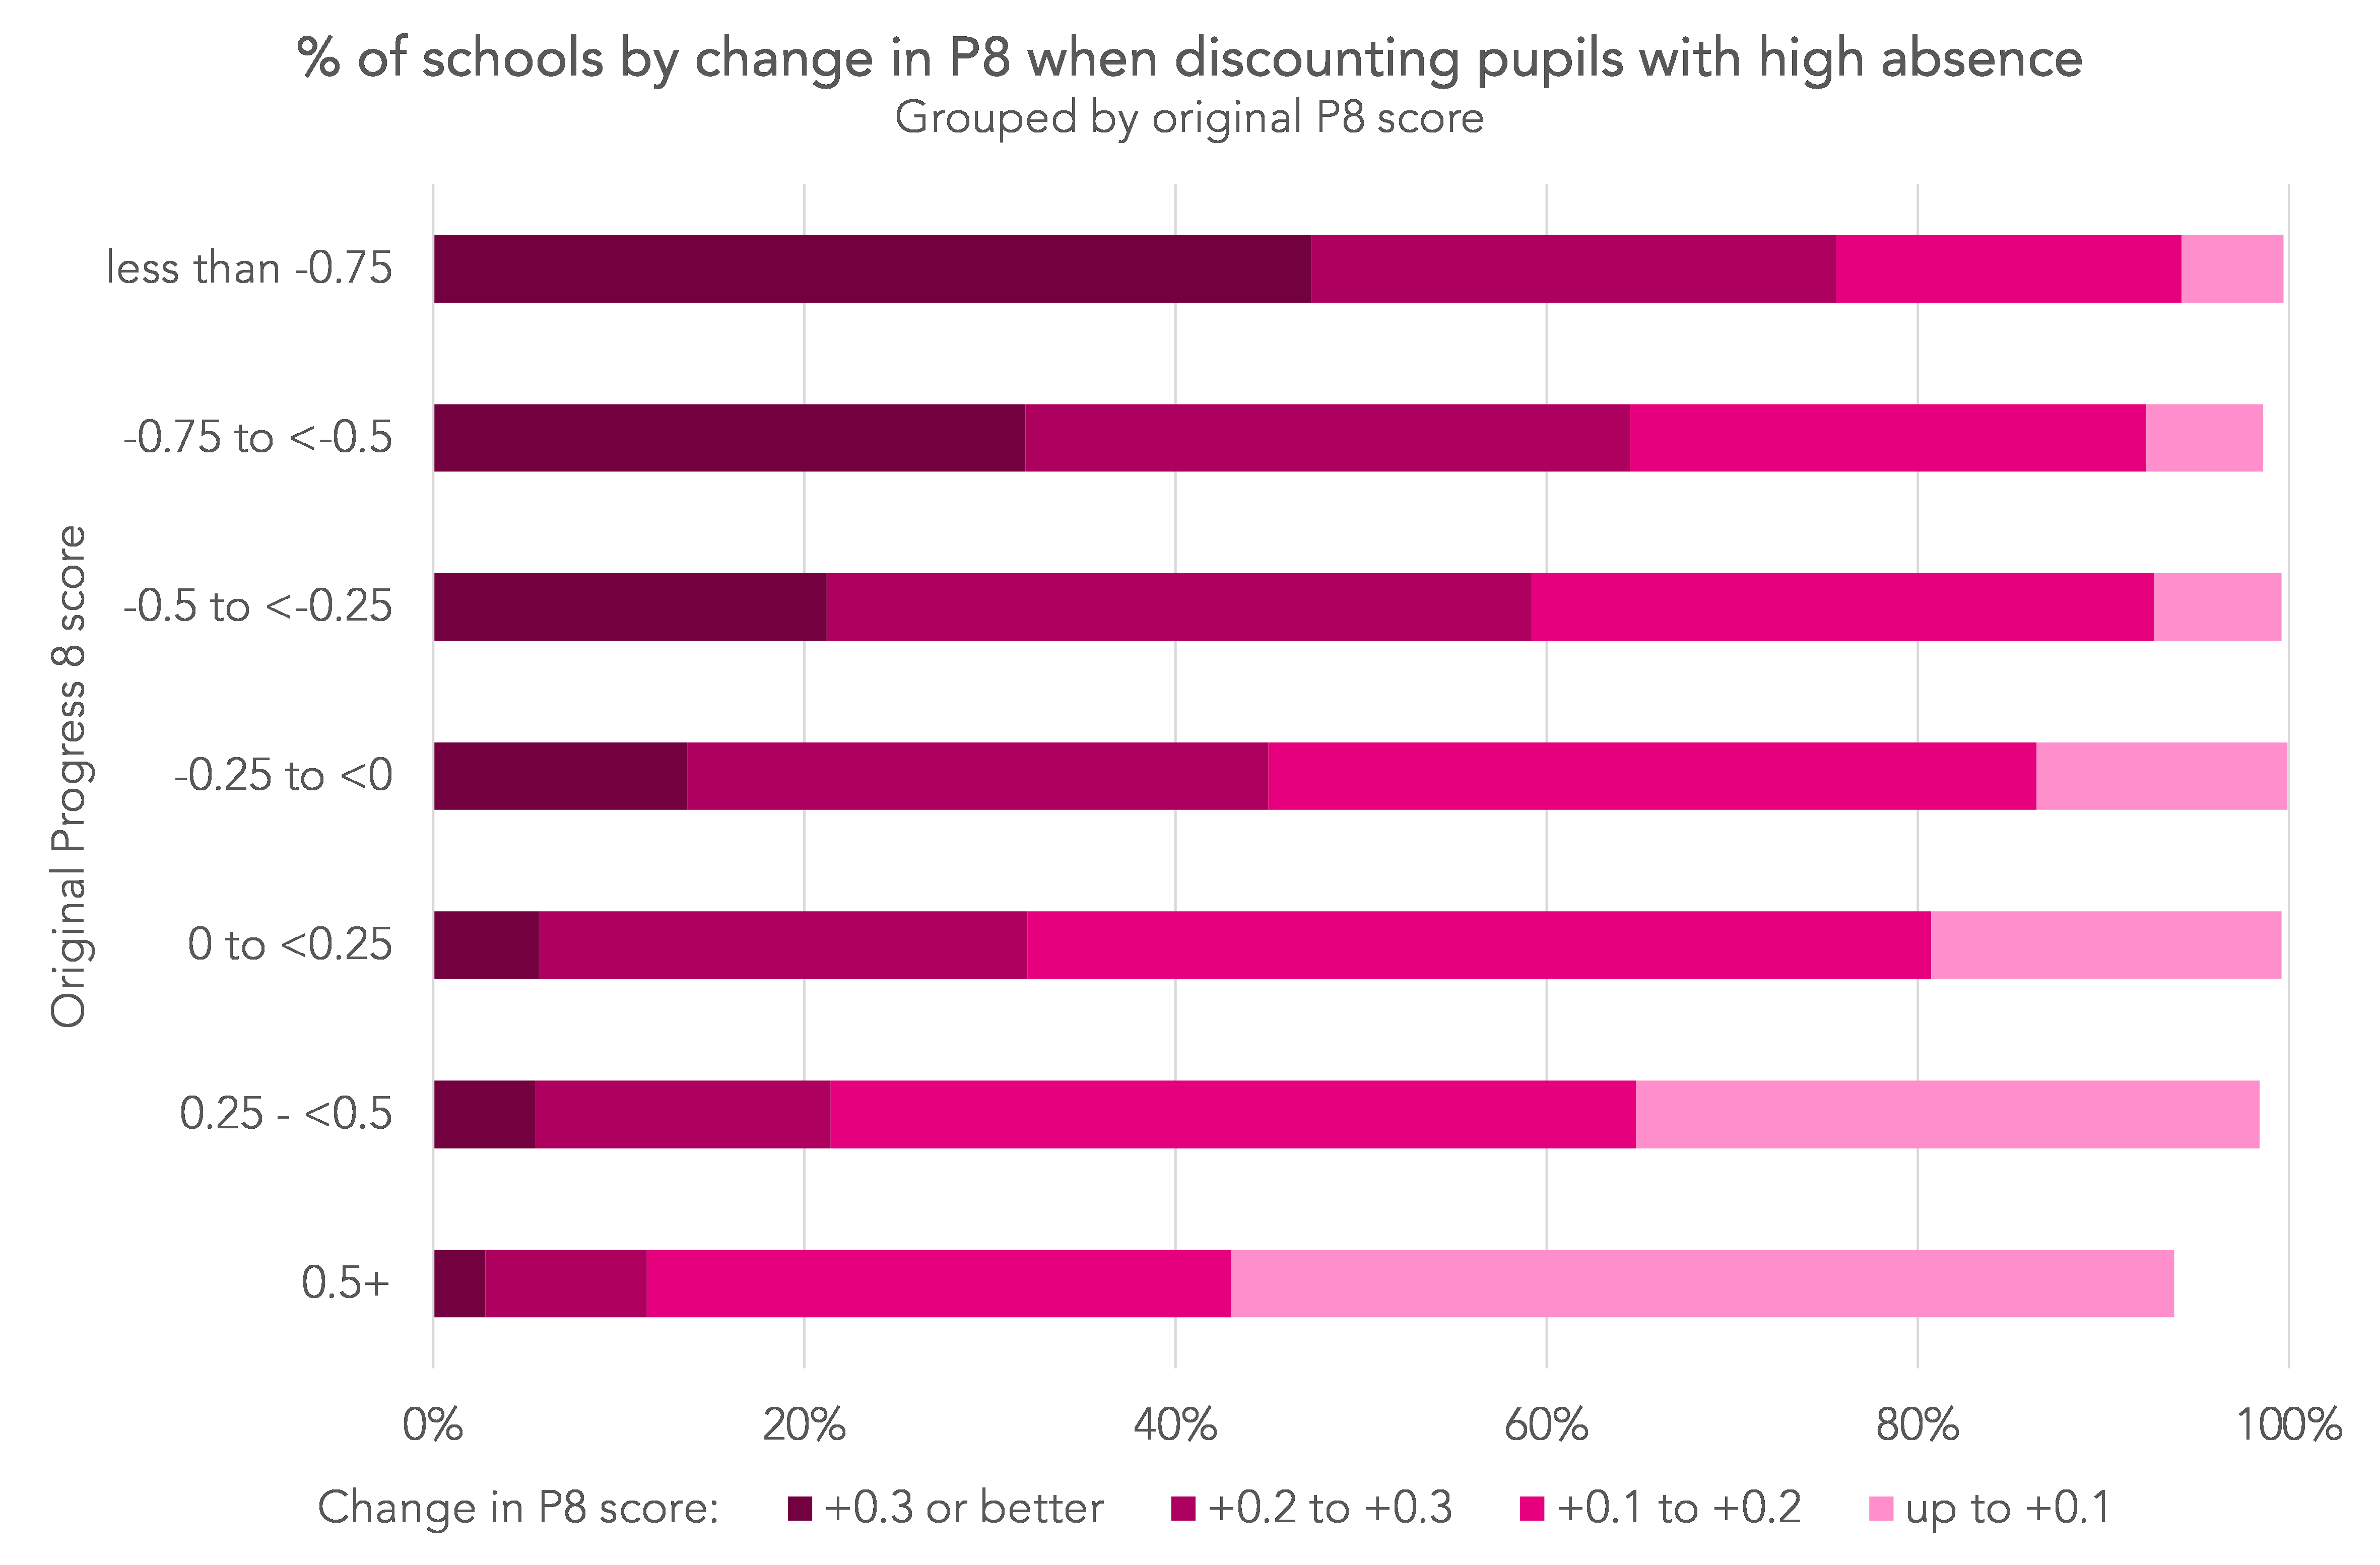
We show the correlation between pupil absence in Years 10 and 11 and Progress 8 scores and explore how this relates to the disadvantage gap
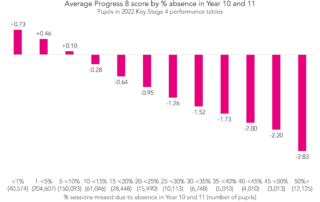
We show the correlation between pupil absence in Years 10 and 11 and Progress 8 scores and explore how this relates to the disadvantage gap

The majority of pupils in AP have been identified as having SEN and / or been referred to social services during their school career
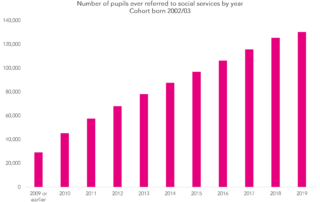
How many pupils have been referred to social services, identified as having SEN and / or attended alternative provision?

Many of the blogposts and reports that we produce here at Datalab are based on analysis of the Department for Education’s National Pupil Database (NPD). But what is it? What is the NPD? The NPD is a collection of data relating to education in England compiled by the Department for Education. The NPD is made [...]
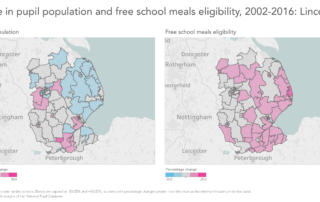
Most of the time our work involves using the National Pupil Database to examine particular aspects of the education system. However, it can also throw up interesting insights into the state of the nation more generally. Last year, we wrote about how the percentage of pupils eligible for and claiming free school meals (FSM) had [...]