Figures came out recently that showed that the proportion of children eligible for free school meals (FSM) was at its lowest level since 2001 [PDF], when pupil-level information on this was first collected nationally.
This is likely to be for a combination of reasons: an economy that has improved since the early 2010s, meaning fewer parents are out of work; tighter rules on benefit entitlement; and, at primary level, the introduction of universal infant free school meals (UIFSM) in September 2014. (Though when we considered this final point last year we concluded that it had only led to a relatively small decrease in numbers recorded as being eligible for free school meals).
But what is the funding impact of this change in demographics?
Disadvantage and school funding
Under the main funding stream for schools, local authorities can choose whether individual schools’ funding should be linked to a deprivation measure based on where a child lives, or FSM rates, or both [PDF] – but the overall amount that a local authority area receives is broadly based on the amount received historically[1].
So this post is going to focus on a distinct type of funding, where disadvantage rates are directly tied to the amount of funding a school receives: the Pupil Premium.
The Pupil Premium has been in existence since 2011, and is intended to raise the attainment of pupil groups known to be less likely to reach their full potential.
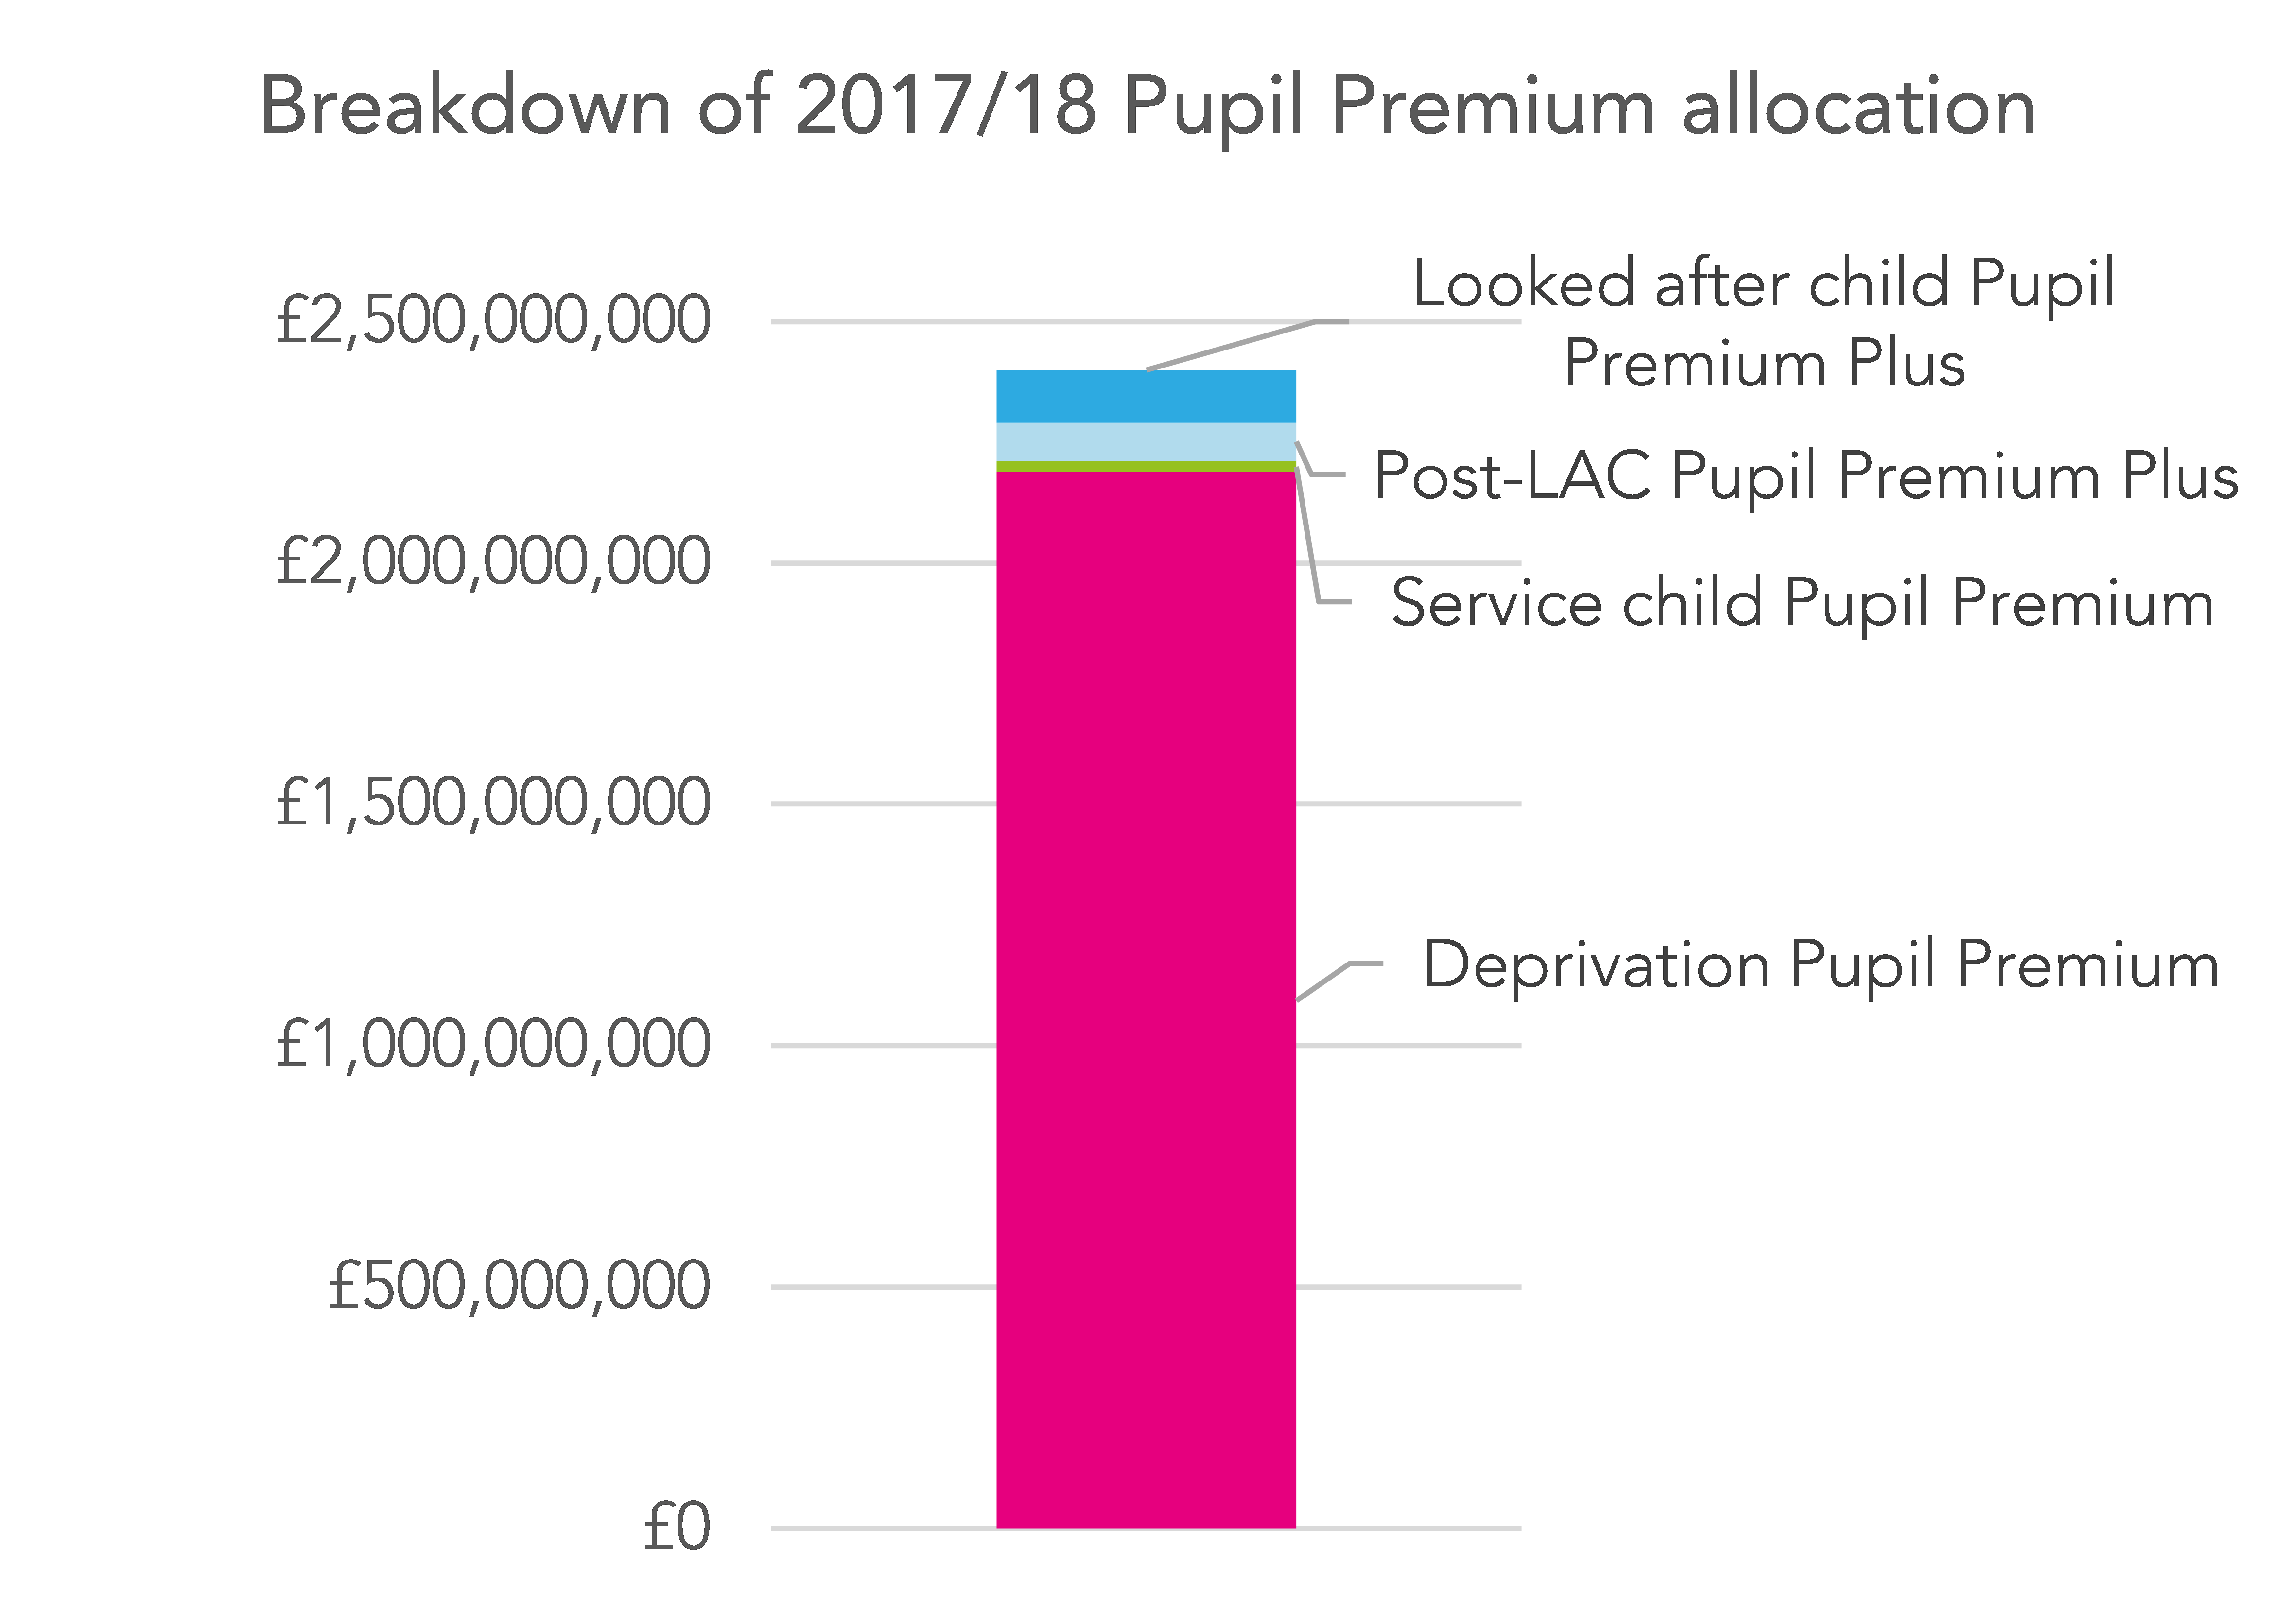
It is composed of four elements: deprivation Pupil Premium; service child Pupil Premium; looked after child Pupil Premium; and post-looked after child Pupil Premium. (The last two are sometimes referred to as the Pupil Premium Plus, but for the rest of this post these streams will all be referred to collectively simply as Pupil Premium).
The impact of falling disadvantage numbers
Deprivation Pupil Premium forms the bulk of Pupil Premium funding – £2.2bn out of £2.4bn in the year April 2017-April 2018 – and is triggered if a child has been eligible for free school meals in the last six years (often referred to as FSM6)[2].
Because under FSM6 a child only needs to have been FSM-eligible for one or more school terms in the last six years, FSM6 rates fall more slowly than FSM rates.
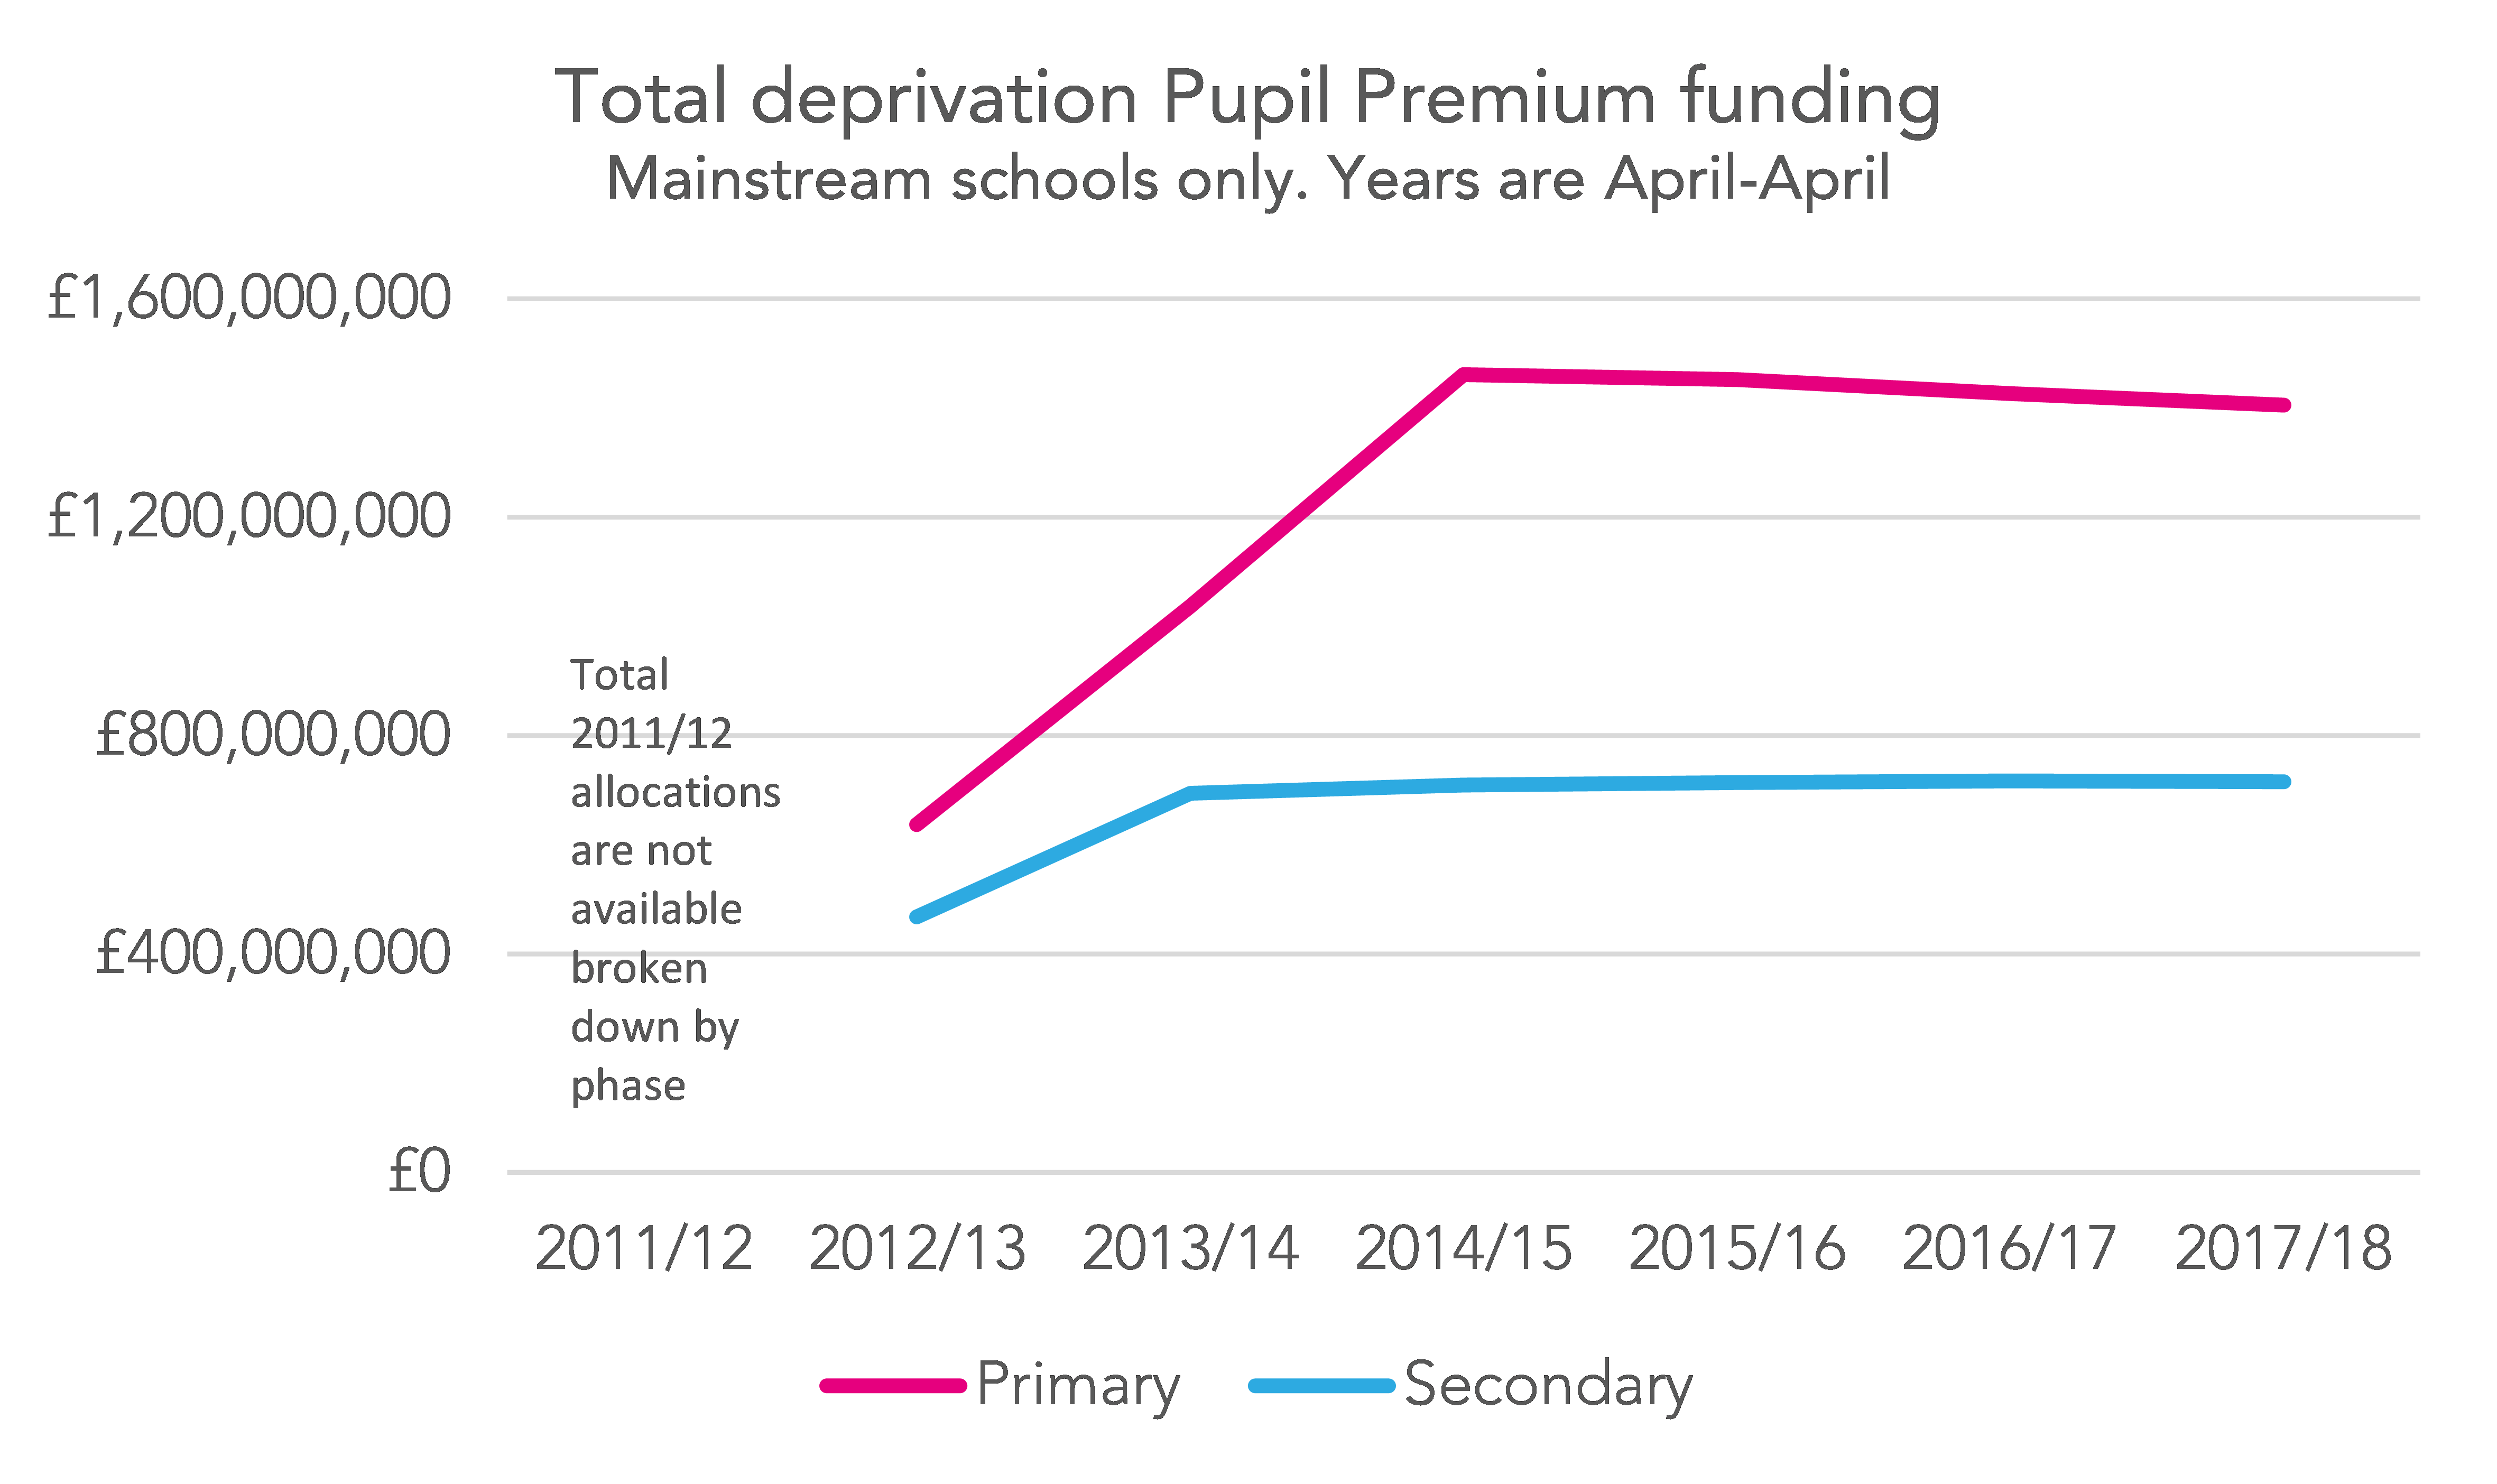
But, as FSM rates have fallen in recent years, FSM6 rates have also begun to fall: since 2013/14 at primary level, and since 2016/17 at secondary level.
(A slight side note: one reason for the greater fall at primary level is like to be the UIFSM policy. But, as well, the nature of the FSM6 measure is slightly different at primary as it is to at secondary. For a child in Year 4, for example, we’re actually talking about FSM5, as the child only has five years of records in the school system. So the FSM6 rate will follow the FSM rate more closely at primary level than at secondary.)

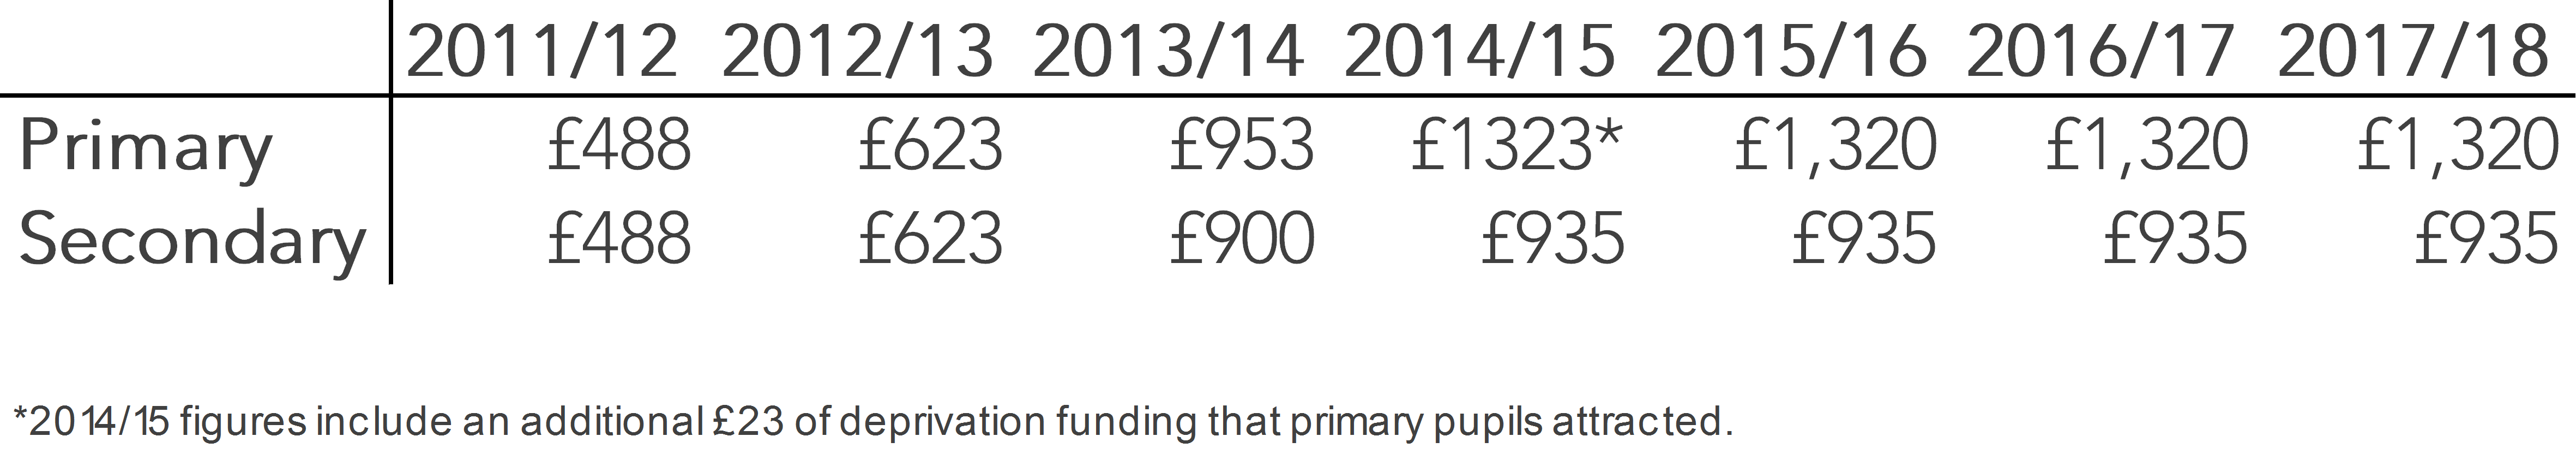
As a result, while the amount paid for each child eligible for deprivation Pupil Premium has remained the same since 2014/15, the total cash amount provided has started to go down[3].
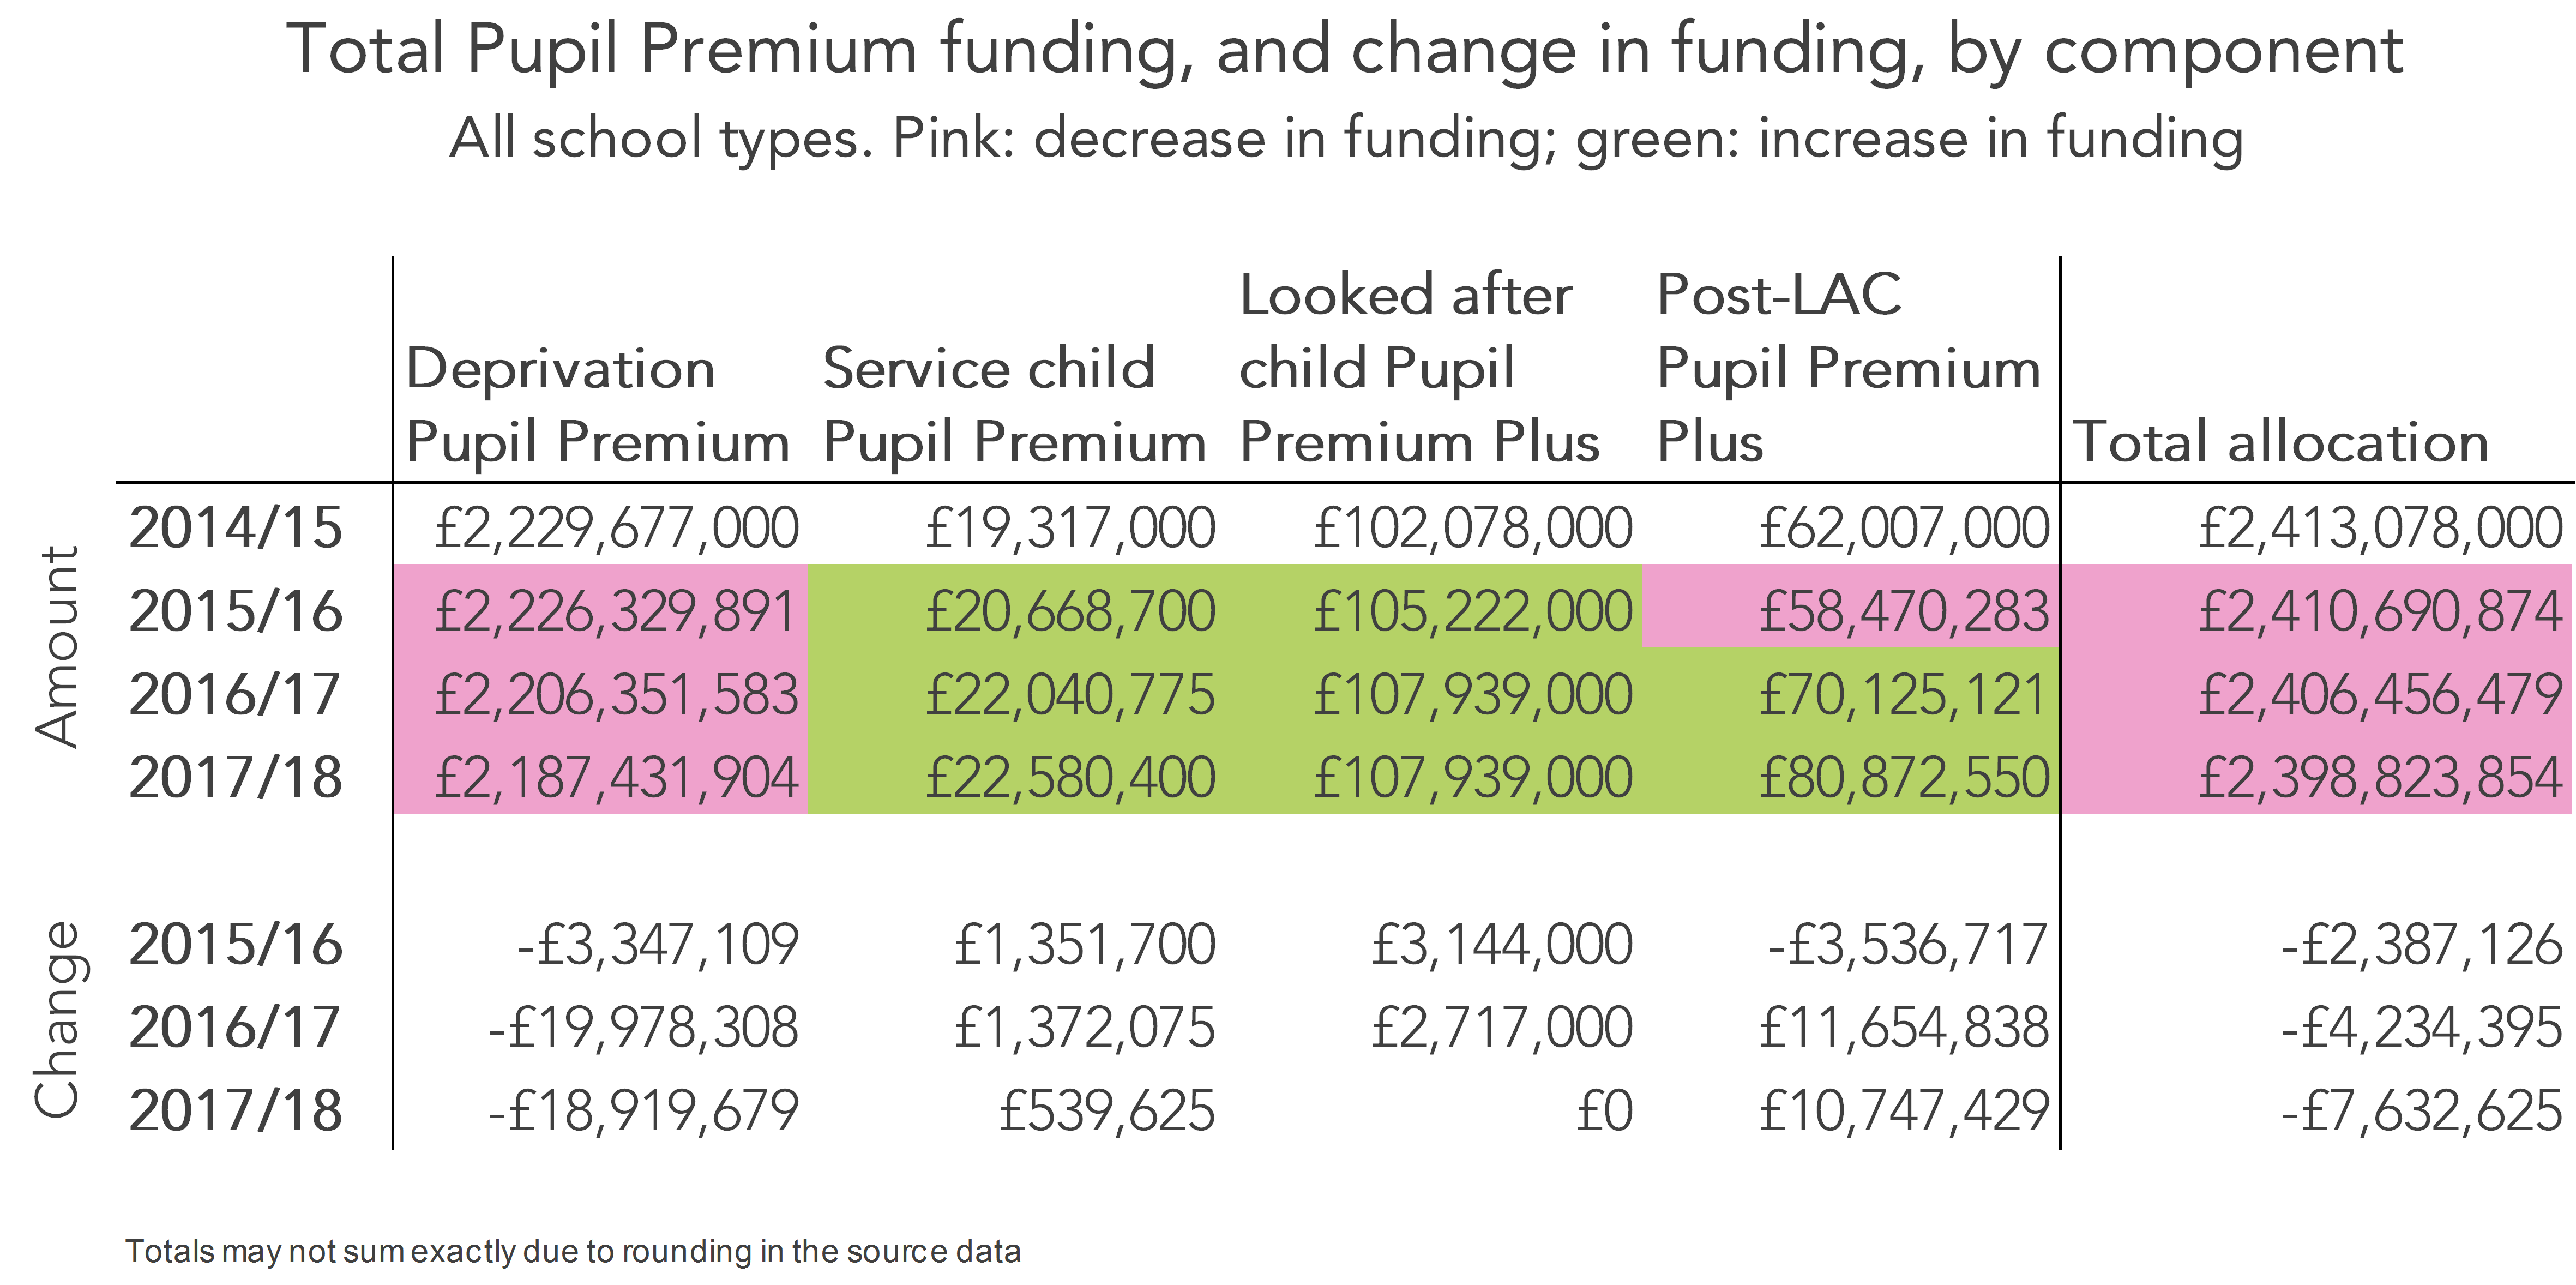
It’s worth saying, though, that overall Pupil Premium funding hasn’t gone down by quite so much as deprivation Pupil Premium has, as there has been an increase in the service child, the looked after child and – particularly – the post-looked after child components since 2014/15.
But if we move away from looking at things nationally, an interesting picture emerges.
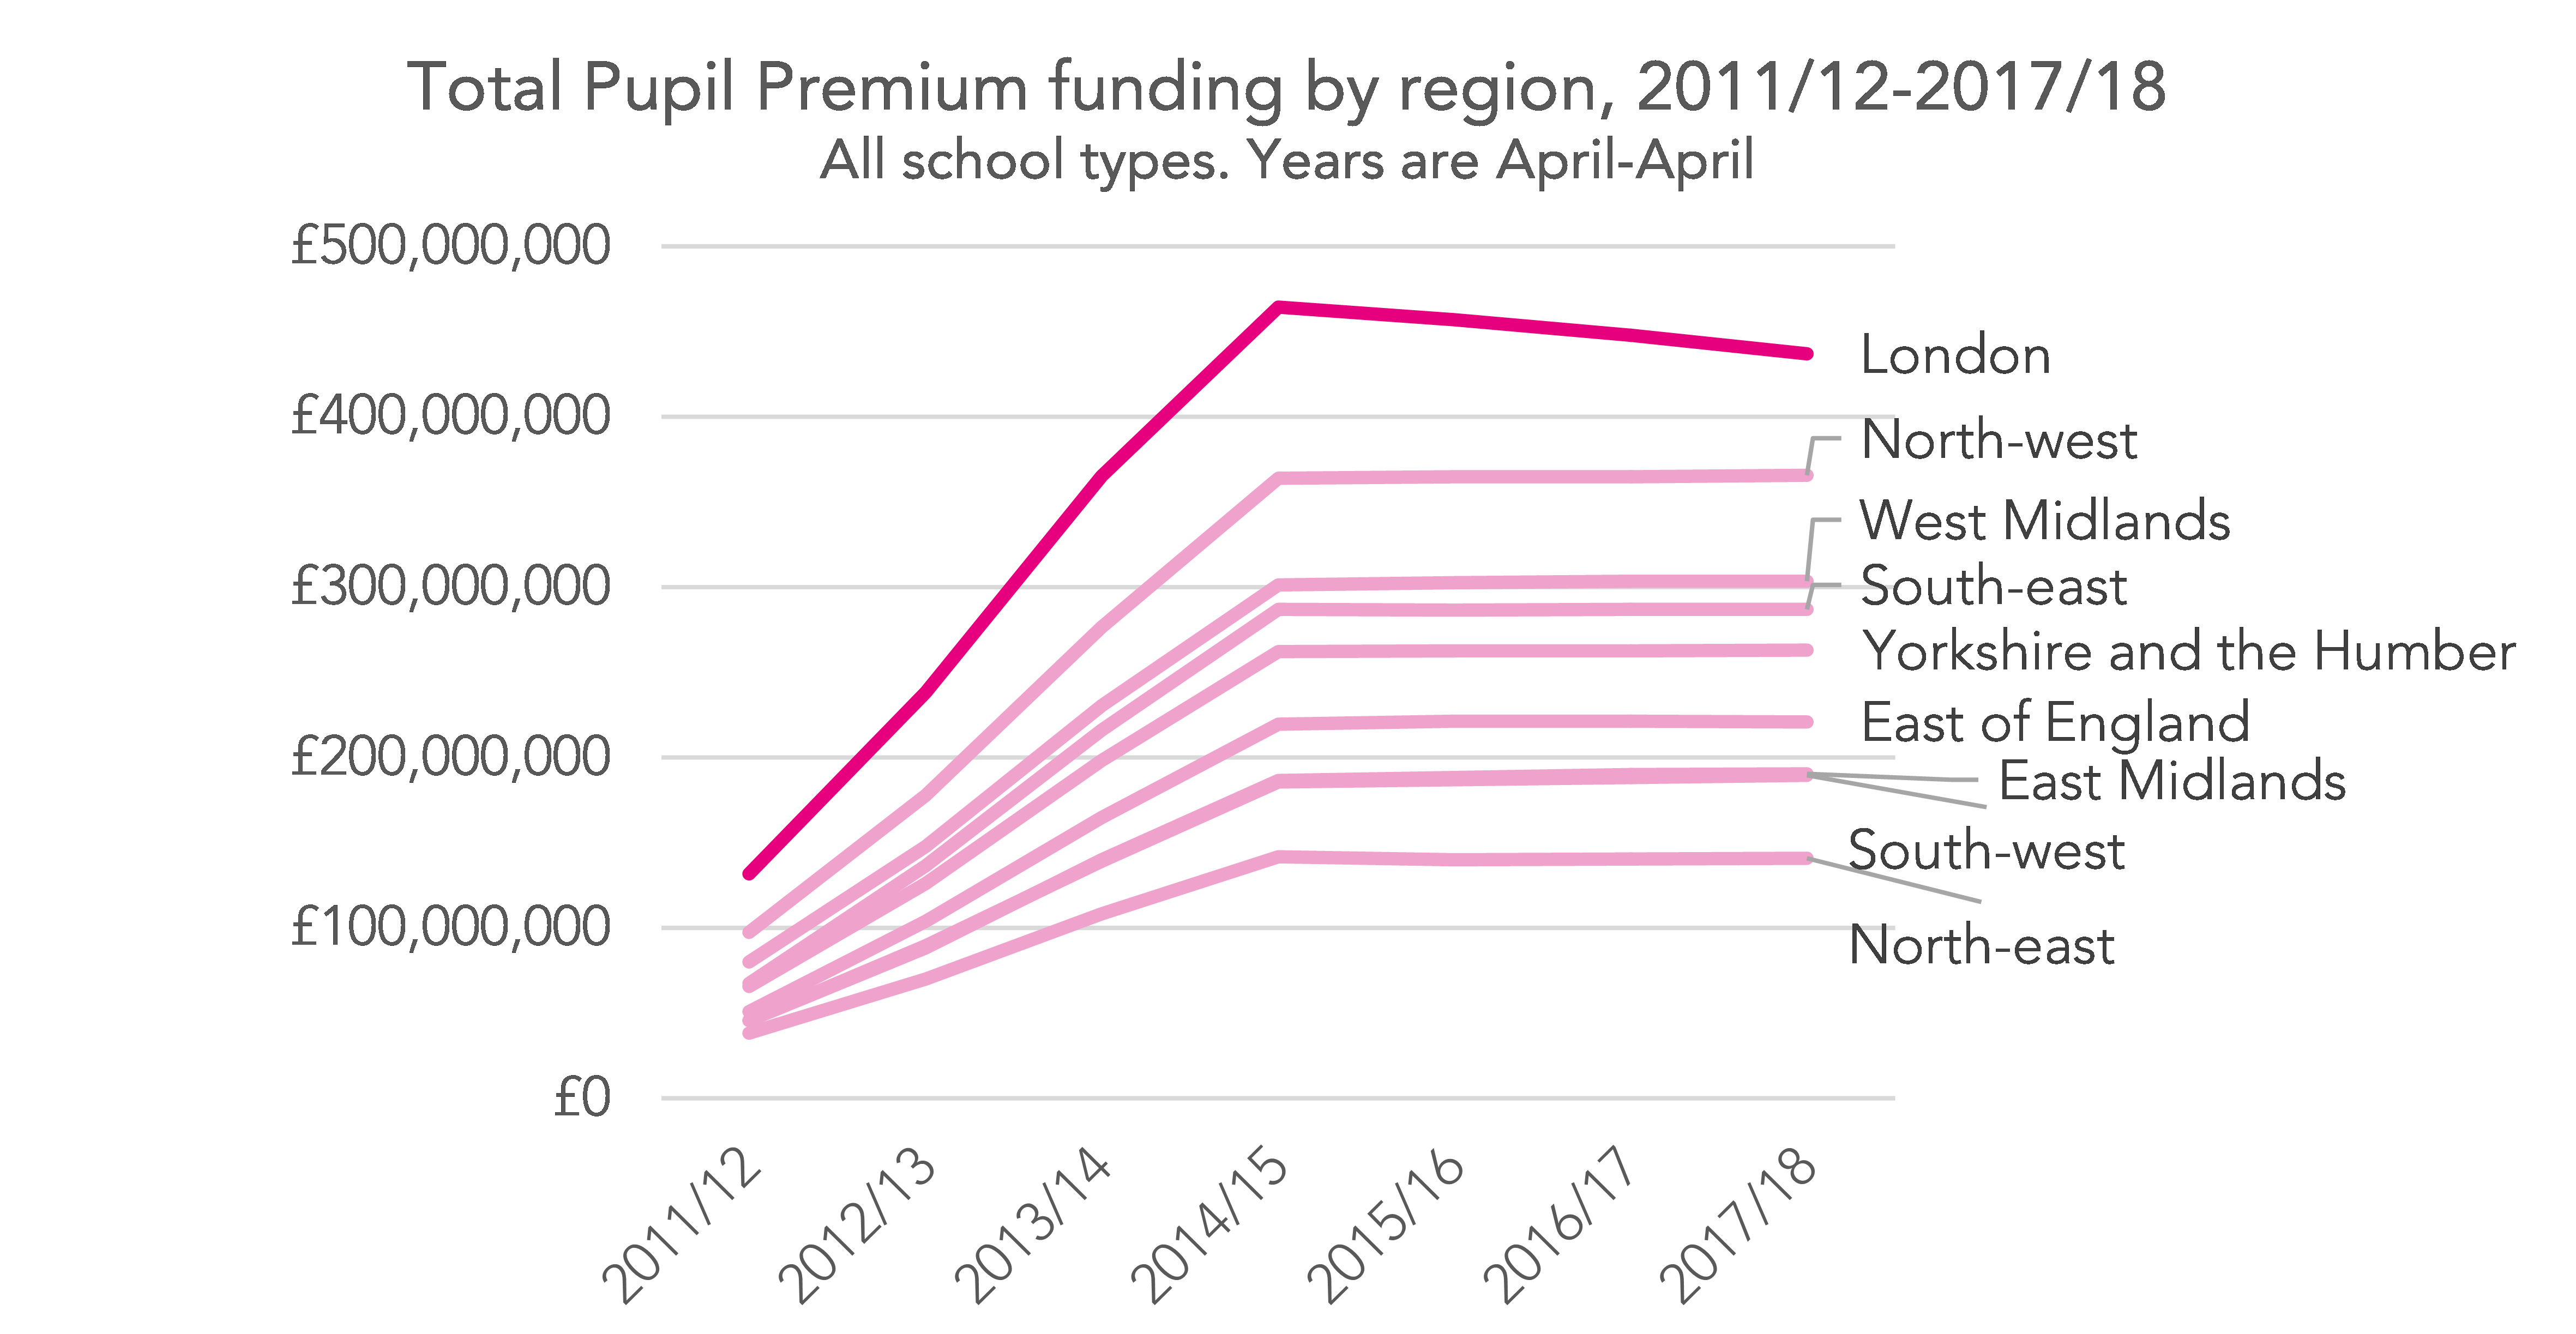
The regional breakdown
As a post we wrote last year noted, the number of disadvantaged pupils is down particularly in London. Correspondingly, total Pupil Premium funding is down 6% in London in the period since 2014/15 – from roughly £465m to £437m.
This is the funding stream operating as it was intended and, to some extent, this might not be a problem. If FSM6 is a good proxy for disadvantage, then if schools have fewer pupils whose parents have been eligible for benefits in the recent past, the rationale for the schools receiving less Pupil Premium funding is fairly clear. (This would, though, only be the case if FSM6 is doing as good a job at identifying children who need extra resources to help support them as it was previously – and that changes in benefit entitlement and the UIFSM policy are not significantly lessening this.)
But, at the end of the day, it is £27m that has gone out of the budgets of London schools in the last three years. That will have taken adjustment, as will likely further reductions in Pupil Premium funding for the capital in the coming years. If nothing else, we need to keep this in mind when considering the other financial demands being made of schools.
The same will no doubt be true of individual schools elsewhere in the country. And, even for those schools that have seen no change in the share of their children eligible for the Pupil Premium, the rate paid has not changed since 2014/15[4], meaning all schools have already experienced a real-terms cut.
Want to stay up-to-date with the latest research from Education Datalab? Sign up to our mailing list to get notifications about new blogposts, or to receive our half-termly newsletter.
1. Under the proposed national funding formula, the amount of funding which a school receives would be based on both free school meal rates, and the deprivation of children’s home areas [PDF].
2. In the first year, 2011/12, it was based on current free school meals eligibility, rather than eligibility at any point in the last six years.
3. Some caution is needed with the 2017/18 allocations figures. While they are the amounts that the Department for Education has begun paying to schools for the period starting April this year, the final amounts may change, due, for example, due to adjustments to the number of children considered to be looked after.
4. Taking into account the additional £23 in deprivation funding paid for primary pupils 2014/15. In fact, being strictly accurate there’s been a reduction from £1,323 to £1,320 in the primary deprivation rate post-2014/15.


Leave A Comment