Along with Key Stage 4 and Key Stage 5 league tables, the Department for Education has this morning published multi-academy trust league tables – the second year it has published these in full.
This analysis looks purely at the DfE’s Key Stage 4 MAT league tables, focusing on those trusts with more than five secondary schools that count in the tables[1] – 17 trusts in all.
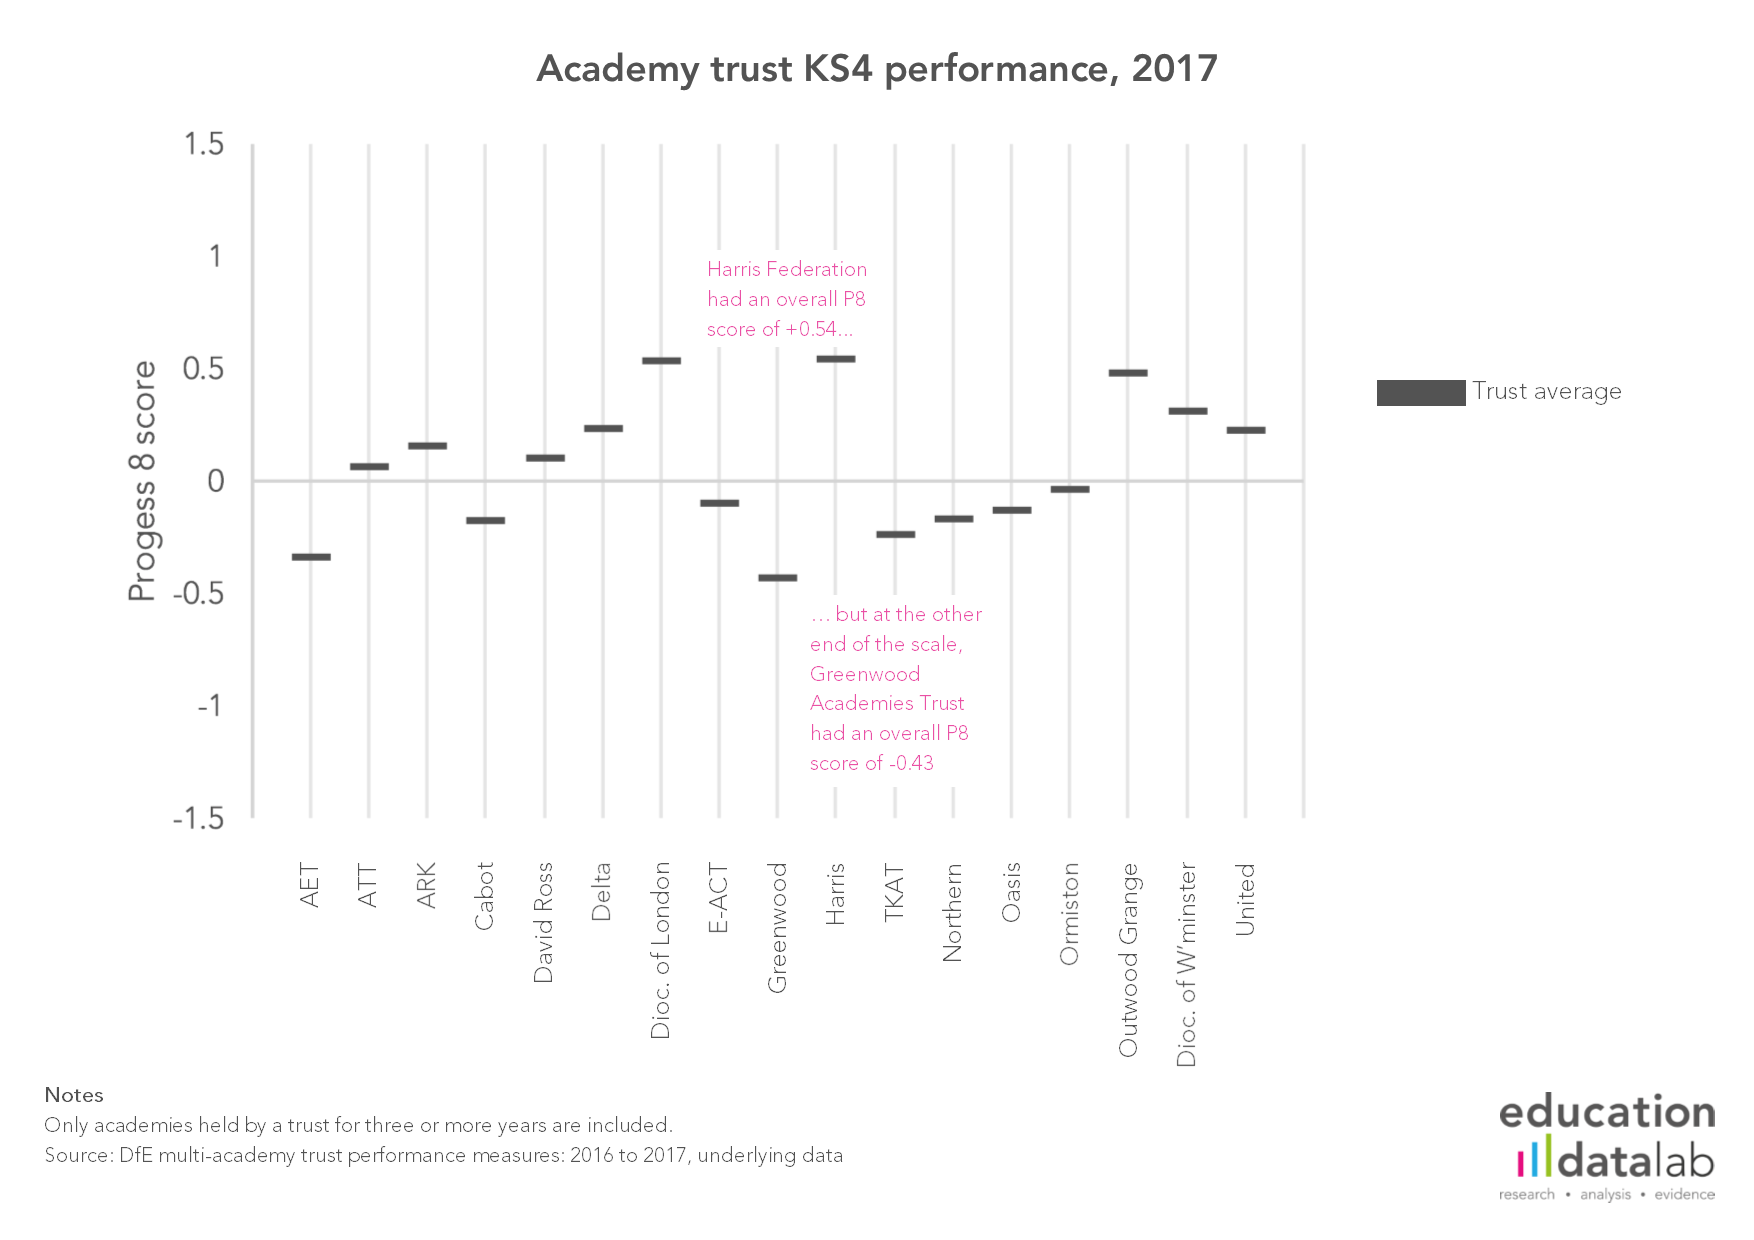
There is considerable variation in the performance of these large MATs…
Among these large MATs, average P8 scores ranged from +0.54 to -0.43 – the chart below shows the full spread.
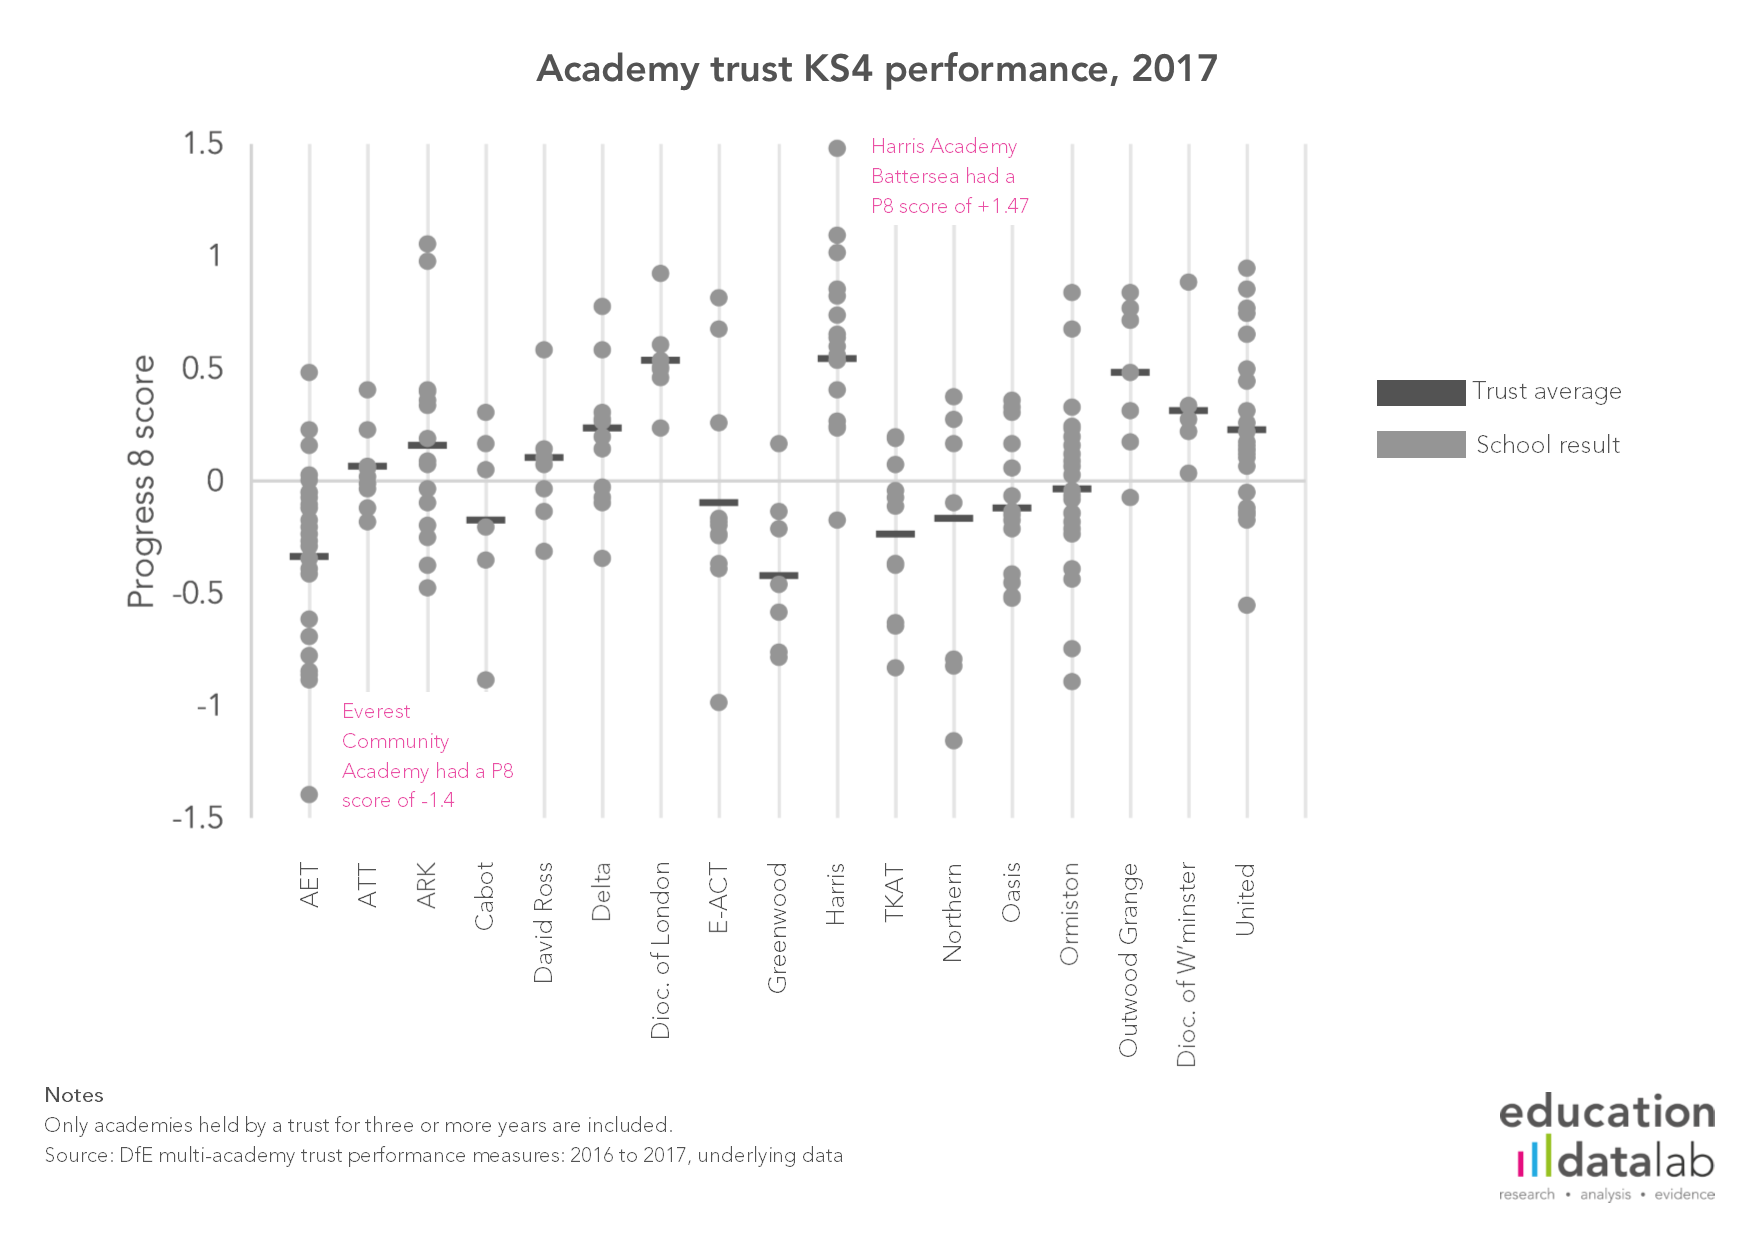
…but the variation at school-level is much greater than the variation seen at trust-level
If there’s a spread of nearly 1.0 between the average P8 scores of the trusts with the highest and the trust with the lowest results, that’s dwarfed by the spread of 2.87 between schools in these trusts (in the same way that the spread of results at a pupil-level is greater than the spread seen at a school-level).
Even within individual trusts, there tend to be fairly large spreads of results – someone like Oasis Community Learning is fairly notable for the relatively small spread of P8 scores recorded by their schools.
Among the largest academy trusts, there is no clear pattern in which types of schools recorded the highest results
In most of the largest academy trusts, the majority of schools are sponsored academies. The Progress 8 scores of converter academies that have been in their trust for at least three years are not appreciably different to sponsored academies.

Last year we noted that studio schools had lower than average P8 scores, pulling down some trusts’ results. We’ve looked at a slightly smaller group of MATs this year, none of which contain any studio schools. But looking at a broader list of MATs than the 17 looked at in the rest of this post, this remains true. As we’ve observed elsewhere today, the question of whether schools with a more vocational focus should be judged using P8 remains a live one.
A lesson on why we shouldn’t take everything at face value
Trust-level performance measures such as these are only going to become more important, with the results published in the DfE’s online comparison tool for the first time this year.
So, we need to be sure they’re telling us the right things. And we have considerable concerns over whether they do.
School league tables to a large extent only report on the attainment and progress of those who complete their secondary education at a given school. As we wrote last year, this gives schools an incentive to lose pupils who would bring their results down – something that we believe goes on in a small minority (and it’s worth emphasising that we very much think this is a minority) of cases.
We made several suggestions on what could be done to counteract this issue.
Given that MAT league tables are simply aggregations of school-level data, until this issue is resolved in the school-level league tables we should be hesitant to place too much store by KS4 MAT league tables.
Want to stay up-to-date with the latest research from Education Datalab? Sign up to our mailing list to get notifications about new blogposts, or to receive our half-termly newsletter.
1. In order to feature in the KS4 MAT league tables, a school must feature in the school KS4 league tables and have spent at least three years with the trust. In producing the tables, the DfE weights schools according to both their size and the amount of time they have spent with a trust – full details can be found here [PDF].


An interesting analysis. One point in it is this: ‘Among the largest academy trusts, there is no clear pattern in which types of schools recorded the highest results’. I wondered if there was any correlation between the P8 score of the MATs and the % of schools in the MAT with weak Ofsted grades?
Thanks, Mike. Given what we know about the relationship between P8 scores and inspection outcomes, there almost certainly! I’m afraid we can’t offer to run the analysis right now – but I’ll keep it in mind as something to look at in future.
Is there a list of release dates when updates or new analysis is completed.
Thank you
Hi Mo,
The last two years the DfE has published its MAT league tables on the same day that KS4 league tables are published in January. If you’d like to keep up with our latest analysis, including our analysis of the MAT league tables, do sign up to our mailing list.
Best,
Philip