This is part five in a series of blogposts exploring long-term disadvantage. Other posts in the series can be found here.
We looked recently at the Progress 8 scores of long-term disadvantaged pupils – those who are eligible for free school meals (FSM) for 90% or more of their time in schools – and concluded that:
- for minority ethnic long-term disadvantaged pupils, schools in London are doing much better than other regions;
- for white long-term disadvantaged pupils, differences between regions are much smaller – issues are systemic rather than geographical.
But what happens if we consider all disadvantaged pupils?
As reported in the Northern Powerhouse Partnership report discussed in the earlier blogpost, disadvantaged pupils in the north have an average Attainment 8 score 6.5 points lower than that of disadvantaged pupils in London. That’s nearly two-thirds of a grade lower for each subject at Key Stage 4.
What is the explanation for this? Pupil attainment at Key Stage 2 is a significant factor (and is, of course, accounted for when Progress 8 scores are calculated), but it is only a partial explanation.
Other relevant factors might include pupil characteristics – including ethnicity, first language, and percentage of time entitled to free school meals – and school characteristics – such as the proportion of pupils entitled to free school meals.
Analysis of data for 2015 and 2016 suggests that allowing for these factors would explain around 85% of the 6.5 point gap between the attainment of disadvantaged pupils in London and in the north[1].
Another relevant factor is the number of subjects entered that count in the Attainment 8 calculation.
In 2016, disadvantaged pupils in London averaged 9.6 entries, whereas those in the north averaged 9.4 entries (the maximum is 10, factoring in the double-counting of English and maths in Attainment 8).
The difference of 0.2 entries might look small, but it accounts for around 0.8 points difference in the Attainment 8 score – so about 12.5% of the 6.5 points gap.
Overall our analysis suggests, then, that taken together these factors can account for around 97% of the London-north gap for disadvantaged pupils, as the chart below shows.

If we look back in time we might find a different story, with London schools showing greater improvement over time (we’ll explore this in another blogpost), but this analysis would suggest that – when other factors are taken into account – differences in school effectiveness between London and the north are currently quite small. This echoes other findings, particularly those of Simon Burgess [PDF].
In a previous blogposts we explored differences between disadvantaged pupils, the percentage of time in school that they were entitled to free school meals, and their ethnicity. This analysis suggested that:
- the attainment gap for long-term disadvantaged pupils was around twice as high as that for pupils who were FSM-eligible on just one or two occasions;
- whatever the level of disadvantage, the impact was twice as high for white pupils when compared to most minority ethnic group.
This led to a categorisation of ethnicity groupings, into those where disadvantage had a lower than average impact, and those where it had a higher than average impact. Under this approach, most minority ethnic groups were classified as seeing a low impact of disadvantage.
Using this approach, among long-term disadvantaged pupils at Key Stage 4, those in the lower impact groups have Attainment 8 scores around 10 points lower than those of pupils in the same ethnicity groups who have never been FSM-eligible.
For high impact groups (predominantly white pupils), the impact of long-term disadvantage is close to 20 Attainment 8 points. (A difference of 10 points in Attainment 8 scores is broadly equivalent to pupils attaining about one grade lower in each subject.)
There are also variations related to the composition of a school’s intake. The following table shows, for Key Stage 4, the impact of long-term disadvantage:
- by region;
- by low/high impact ethnicity grouping;
- by the percentage of pupils in low impact groups that schools have in their overall cohort.
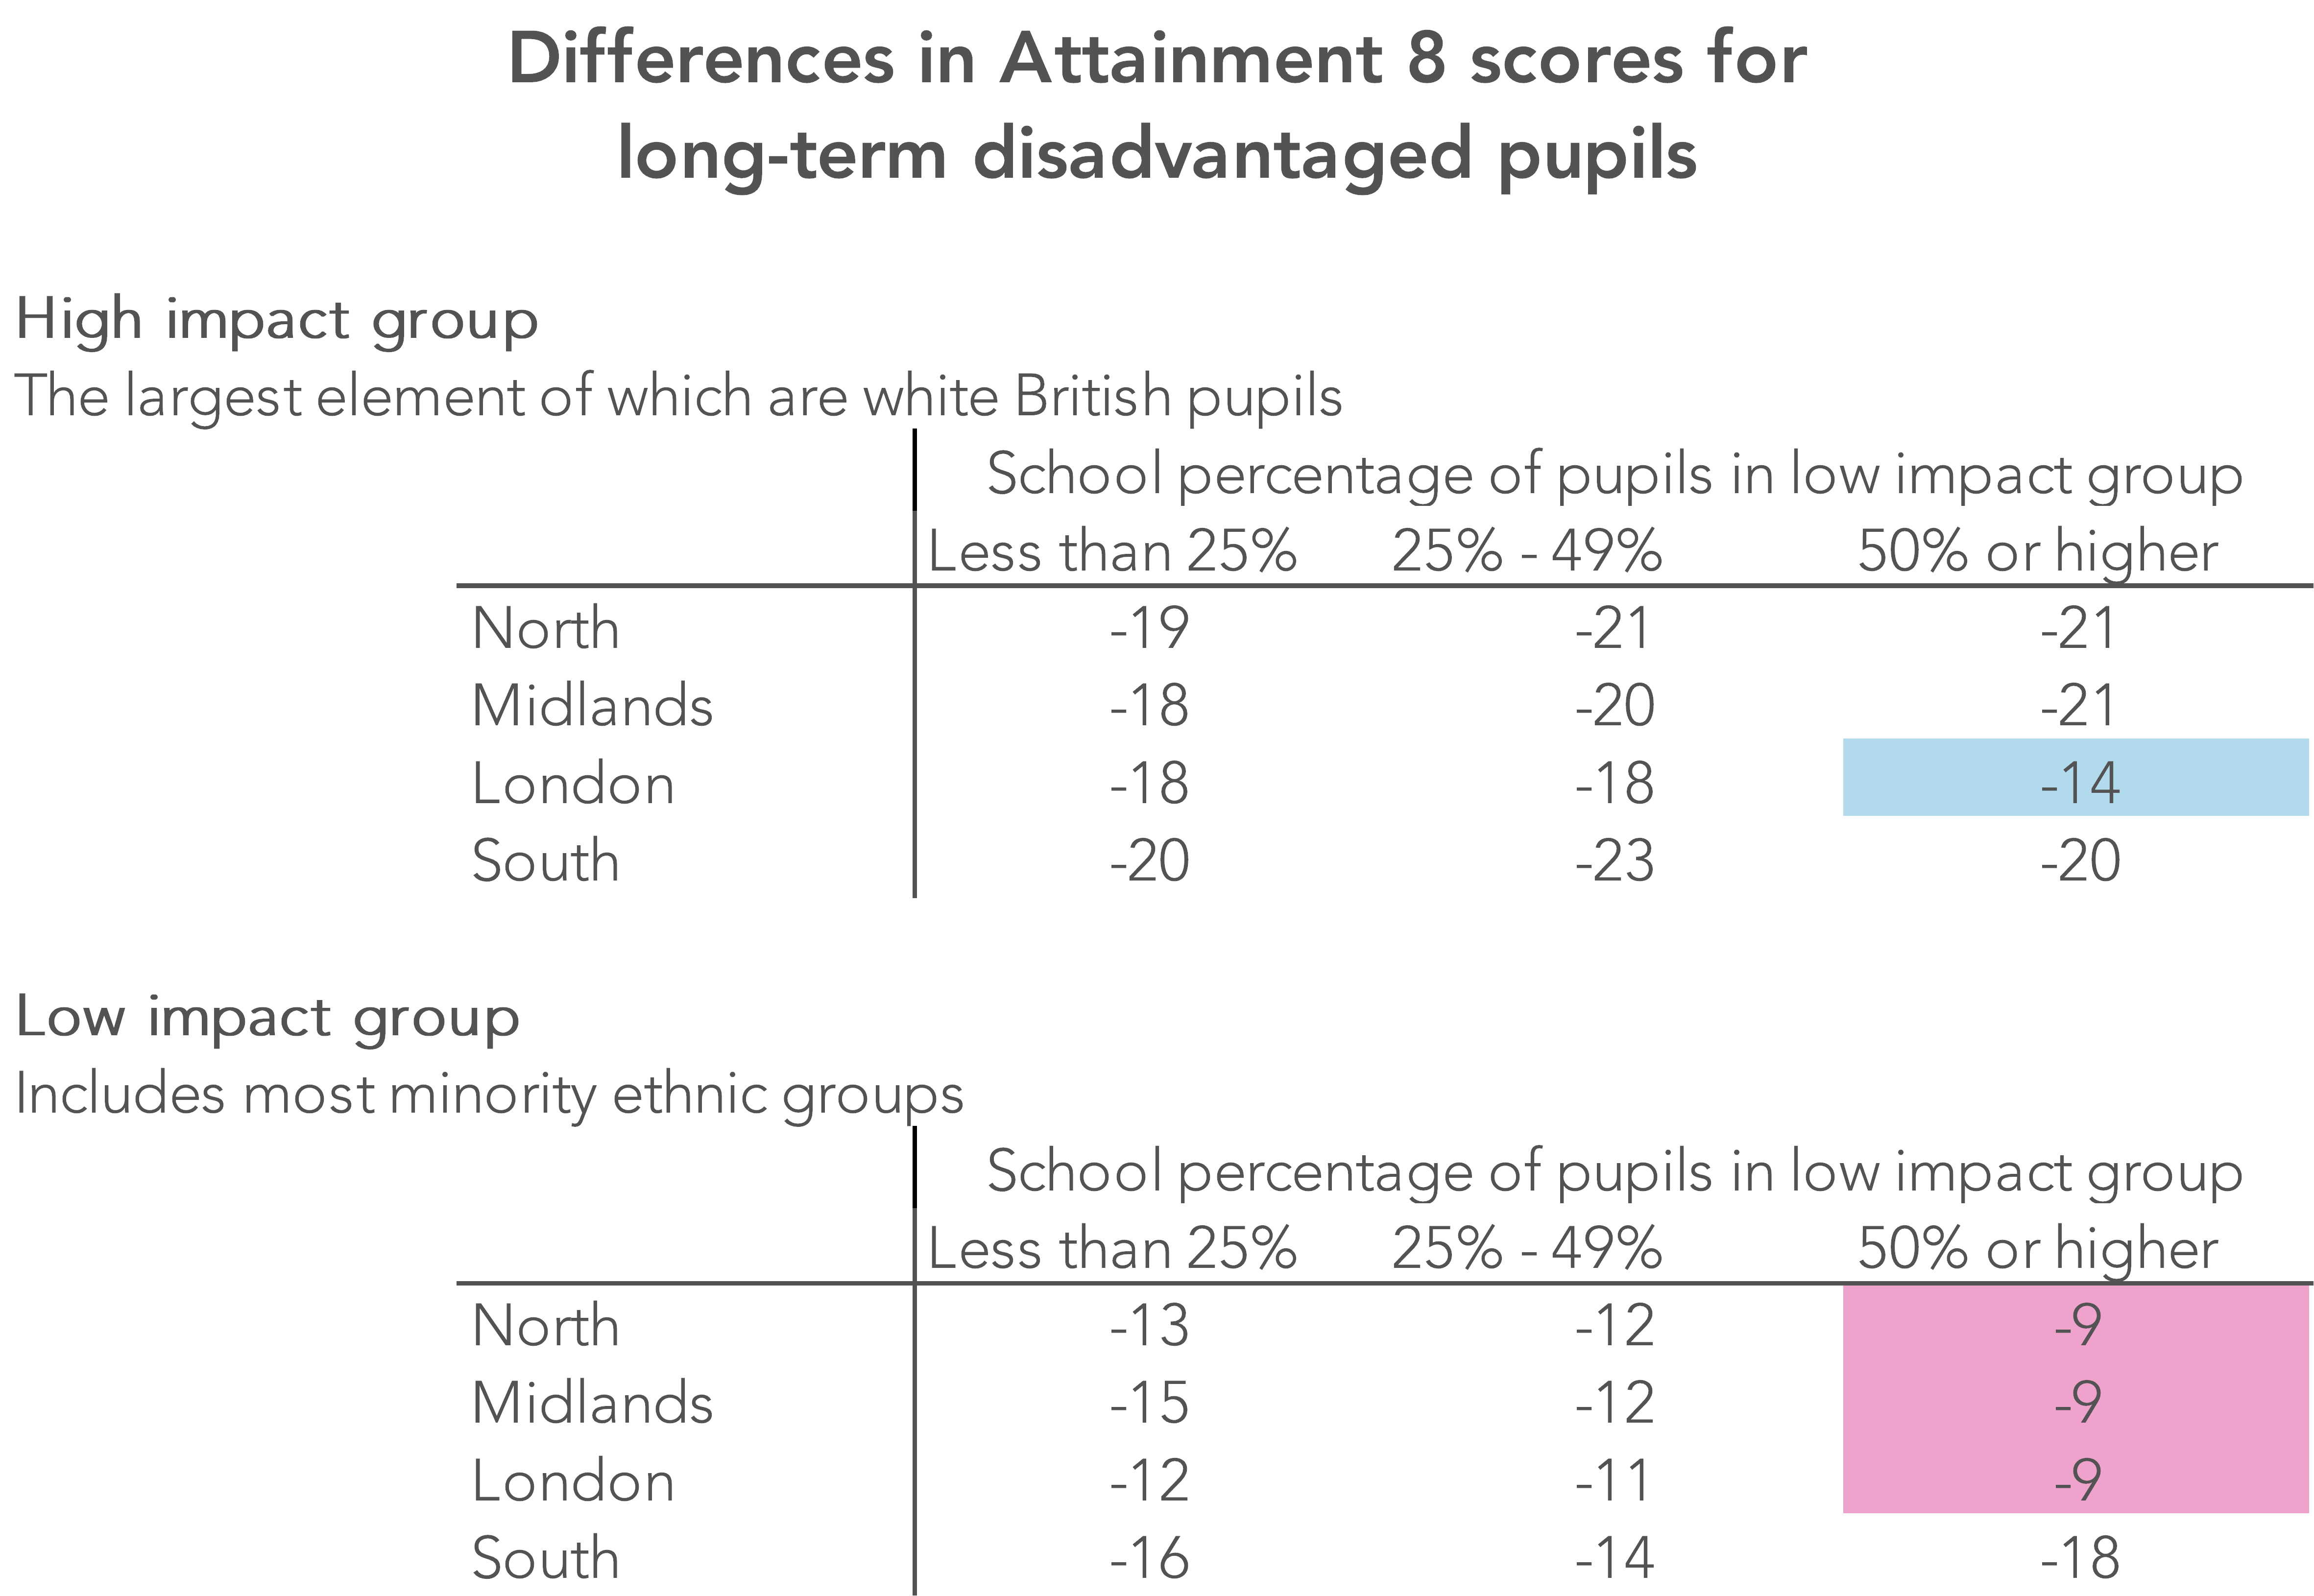
This implies that the impact of disadvantage is lowest for minority ethnic pupils in schools where they form 50% or more of the cohort (shaded pink) – with the exception of the small number of schools like this in the south.
Where the proportion of minority ethnic pupils is lower, the impact is closer to that for white pupils (or, more specifically, the high impact group). Interestingly, the impact of long-term disadvantage for white (high impact) pupils is fairly consistent with one exception – when they are in London schools and form a minority of the overall cohort (shaded blue).
Data for groups who have been disadvantaged for less time than this long-term disadvantaged group, and value added data, both show very similar patterns at Key Stage 2 and Key Stage 4.
All of this suggests that attainment gaps between London and the north are more a reflection of the areas that they serve than the effectiveness of the schools in each region.
So, does this mean that calls for the north of England to receive additional funding are not justified? Well, it rather depends on whether pupils with different characteristics are spread evenly across each region. More on this in the next blogpost.
Now read the next post in the series.
Want to stay up-to-date with the latest research from Education Datalab? Sign up to our mailing list to get notifications about new blogposts, or to receive our half-termly newsletter.
1. A note on methodology: The relative impact of Key Stage 2 attainment, pupil and school characteristics was determined by comparing outcomes from FFT’s value-added and contextual value-added methodology. Contextual value-added takes into account a wide range of pupil characteristics and school context factors.


Leave A Comment