This blogpost supports a new report available to primary schools in FFT Aspire, but may be of interest to a wider audience.
We’ve written an awful lot over the last few years about the various statistical issues affecting the value added measures that appear in primary and secondary school performance tables (league tables, as they are colloquially known).
In this blogpost we bring these issues together in one place. For those in schools which use FFT Aspire we’ve also produced reports which show what difference the various alternative measures we propose make – links to these are given below.
We see three main issues with the Key Stage 1 to Key Stage 2 value added measures published in primary school performance tables.
- They are biased against junior and middle schools.
- They take no account of context.
- There is no overall measure of value added, which might help alleviate some of the noise that exists in the separate reading, writing and mathematics measures.
- They can be subject to a high level of volatility due to small cohort sizes.
Junior and middle schools
We first wrote about systematic differences in Key Stage 1 assessments between infant/first schools and all-through primary schools here.
These differences then systematically affect the Key Stage 1 to Key Stage 2 value added scores of junior and middle schools. On average, these tend to be lower than for all-through primary schools.
The recent announcement on a reception baseline measure seems to suggest that the Department for Education are abandoning measuring value added for junior schools from 2027. In the long-term, a non-statutory test taken in Year 3 in junior schools and a sample of primary schools may be the only viable method of measuring value added for junior schools.
But in the short term there are two things that can be done.
The first is to calculate a measure of value added using the Early Years Foundation Stage Profile (EYFSP) as a baseline. The second is to calculate Key Stage 1 to Key Stage 2 value added separately for junior/middle schools and all-through primary schools.
FFT Aspire users
If you are a primary school using FFT Aspire, log in to the site, go to the downloads menu in the top right-hand corner (↓) and choose ‘FFT special reports’.
Not an FFT Aspire user?
Neither of these measures on its own is ideal.
Using EYFSP as a baseline means that junior/middle schools would have ‘accountability without responsibility’ for the years prior to pupils joining them. The measure could, however, be reported in Ofsted’s Inspection Dashboard Summary Report for both the infant/first and the junior/middle school.
Calculating KS1-KS2 value added separately for junior/middle schools would make the implicit assumption that, on average, value added was identical in junior/middle schools compared to all-through primary schools. Perhaps this is not wide of the mark, as we suggest here.
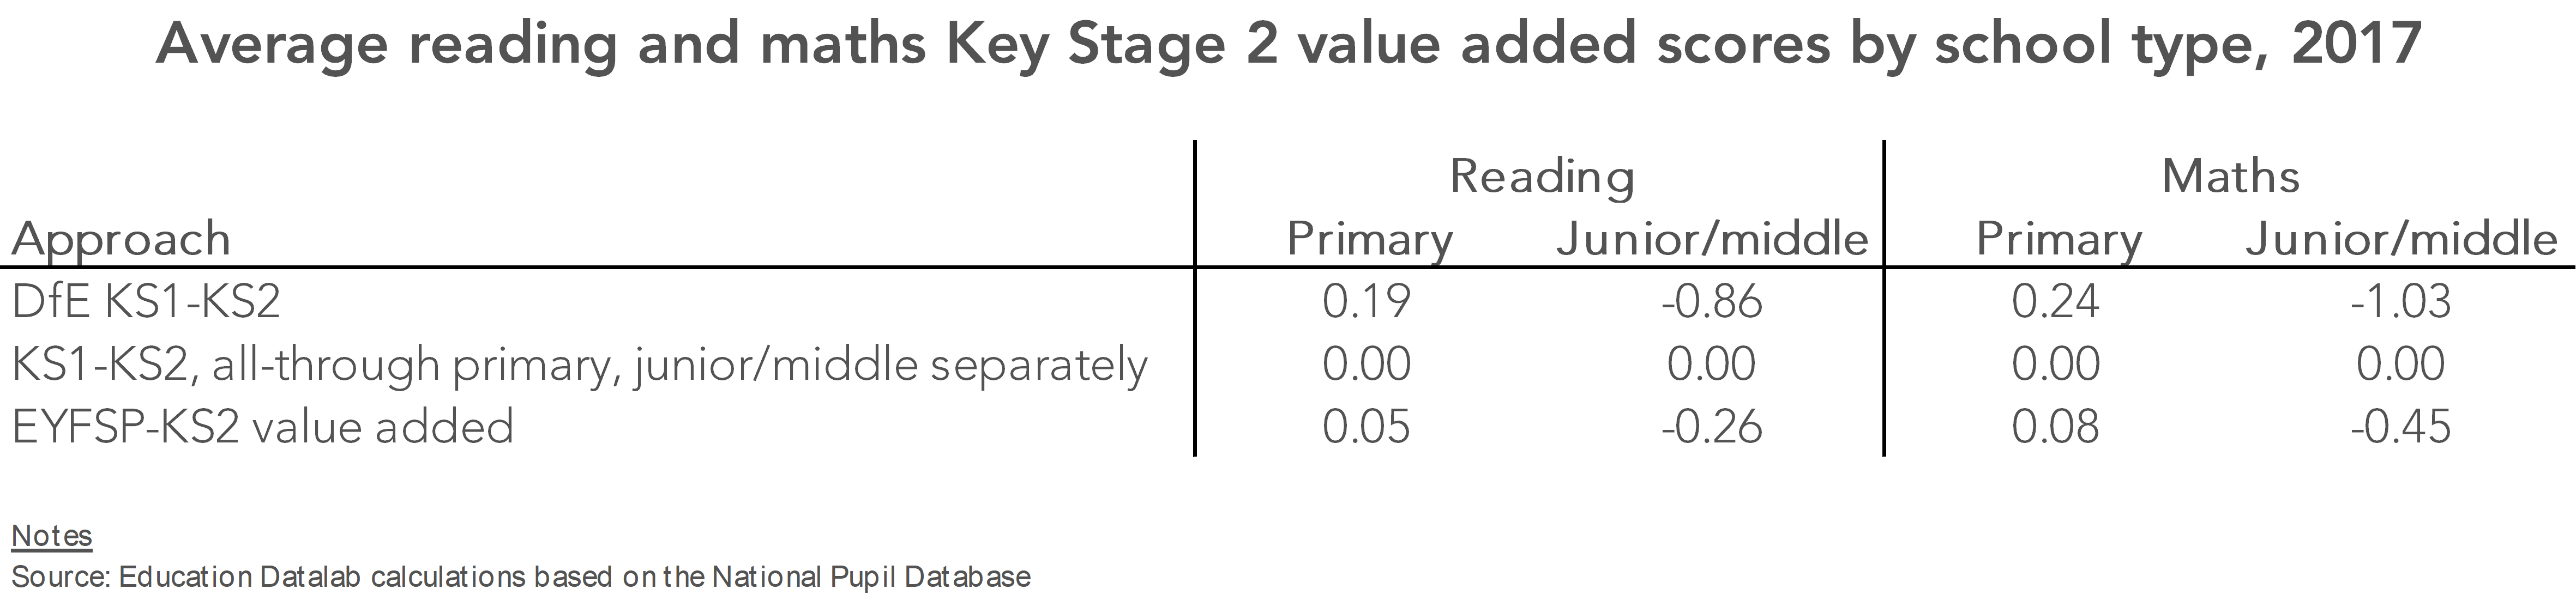
In the table below, we show the impact of three KS2 value added measures on junior/middle schools as a whole. The measures are:
- Department for Education KS1-KS2 value added;
- KS1-KS2 value added using the DfE methodology, but calculated separately for junior/middle schools and all-through primary schools);
- EYFSP-KS2 value added.
The bias in favour of all-through primary schools is much reduced by using EYFSP as a baseline. By definition it is eliminated completely by calculating value added separately for both types of school. Clearly, the impact will vary for individual schools.
Overall measure
We have also argued in favour of creating an overall measure of value added, based on test scores in grammar, punctuation and spelling; reading; and maths, particularly for defining floor standards (if they are necessary). This would help alleviate some of the noise in the separate scores currently published for reading, writing and maths.
Context
None of these measures takes account of contextual factors known to have an impact on pupil attainment above and beyond prior attainment. These include disadvantage (including long-term disadvantage), month of birth, pupil mobility, ethnicity and more.
For that reason, we recommend looking at contextual value added (CVA) indicators alongside value added measures. In the chart below, we compare value added and CVA measures (based on our overall measure of attainment) for schools in 2017. The measures are strongly correlated (r=0.92), but for some schools there are large changes, with around 300 changing by at least two scaled score points.

Volatility
Finally, measures of primary school performance (and especially value added measures) tend to be based on relatively small cohorts and so exhibit year-on-year volatility. In 2018 we will have three years’ worth of data from the new Key Stage 2 tests and so three-year averages could be produced. This would help address the volatility that exists.
Conclusions
As we’ve often said, value added measures do not provide an index of school effectiveness that ranks schools from best to worst. They are just descriptive statistics about attainment that take account of pupils’ prior attainment.
Unfortunately, they are sometimes interpreted as measures of school effectiveness, which can undermine their usefulness as descriptive statistics.
For that reason, we suggest inspecting value added scores alongside supplementary measures that deal with the issues known to bias them. And we will keep on trying to identify where bias may be affecting the measures.
Now, see the impact of these factors in your school in the new report available in FFT Aspire. To download a copy, log in to FFT Aspire, go to the downloads menu in the top right-hand corner (↓) and choose ‘FFT special reports’.
Want to stay up-to-date with the latest research from FFT Education Datalab? Sign up to Datalab’s mailing list to get notifications about new blogposts, or to receive the team’s half-termly newsletter.


Please can you tell me how the EYFSP – KS2 VA is calculated? On our special report it looks good from KS1-KS2 and really not so good from EYFSP – KS2 and I’m wondering what’s making such a big difference.
Thanks
Hi Cassie. Sorry for the delay in responding. The EYFSP>KS2 methodology is similar to the DfE KS1-KS2 VA methodology. Pupils are banded into prior attainment groups based on their total EYFSP score. If, for example, pupils tended to achieve lower KS1 results than pupils with similar EYFSP attainment nationally then EYFSP>KS1 VA would be below average. If they then tended to achieve KS2 results that were in line with pupils with similar KS1 attainment nationally then KS1>KS2 VA would be above average but EYFSP>KS2 VA might still be below average. Hope this answers it but feel free to email us if not.
Hi Dave
Would it be possible to have a copy of the Banded Prior Attainment Groups (EYFSP)?
Unfortunately FFT Support Team dont have this.
cheers