As well as analysing the picture of moves by secondary school-age pupils in England we have tested what the effect would be of the policy solution that we propose – reweighting league tables in proportion to the amount of time that pupils have spent on-roll at particular establishments.
In short, rather than all pupils who finish secondary schooling at a particular establishment counting equally, as happens currently in school league tables, reweighting involves weighting some pupils more heavily than others.
For instance, the results of a pupil who had been on-roll for each of the 15 terms that make up secondary education receive a greater weight than those of a pupil who had only spent six terms at the school – and pupils would still count to some extent even where they were no longer on the roll of a particular school. Full details of how our reweighting approach works can be found here.
Why are we focusing on MATs?
We are focusing on MATs for a number of reasons. More than two-thirds of mainstream secondary schools are now academies, with increasing numbers part of MATs. Full MAT league tables were published by the Department for Education for the first time last year, and the number of trusts that will fall within their scope will increase in the coming years. It is therefore worth us considering at this stage whether we think they take the right approach, and are based on data that measures the things we want them to measure.
As well as doing this at school-level, it’s possible to do it at multi-academy trust (MAT)-level, following the methodology that the Department for Education uses in producing MAT league tables.
In January we noted that the MAT league tables showed considerable variation in the Progress 8 scores achieved by the trusts that featured – but cautioned that they should not necessarily be taken at face value.
That’s because, as simple aggregations of school-level data, they repeat one of the weaknesses of the DfE’s school-level league tables – that, broadly speaking, only pupils who remain on-roll in January of Year 11 count in the figures.
So what is the impact of reweighting MAT league tables?
Flattening out
The chart below shows the impact of reweighting for the 62 trusts that featured in the MAT league tables in 2017, with trusts ordered by their MAT league table Progress 8 (P8) score
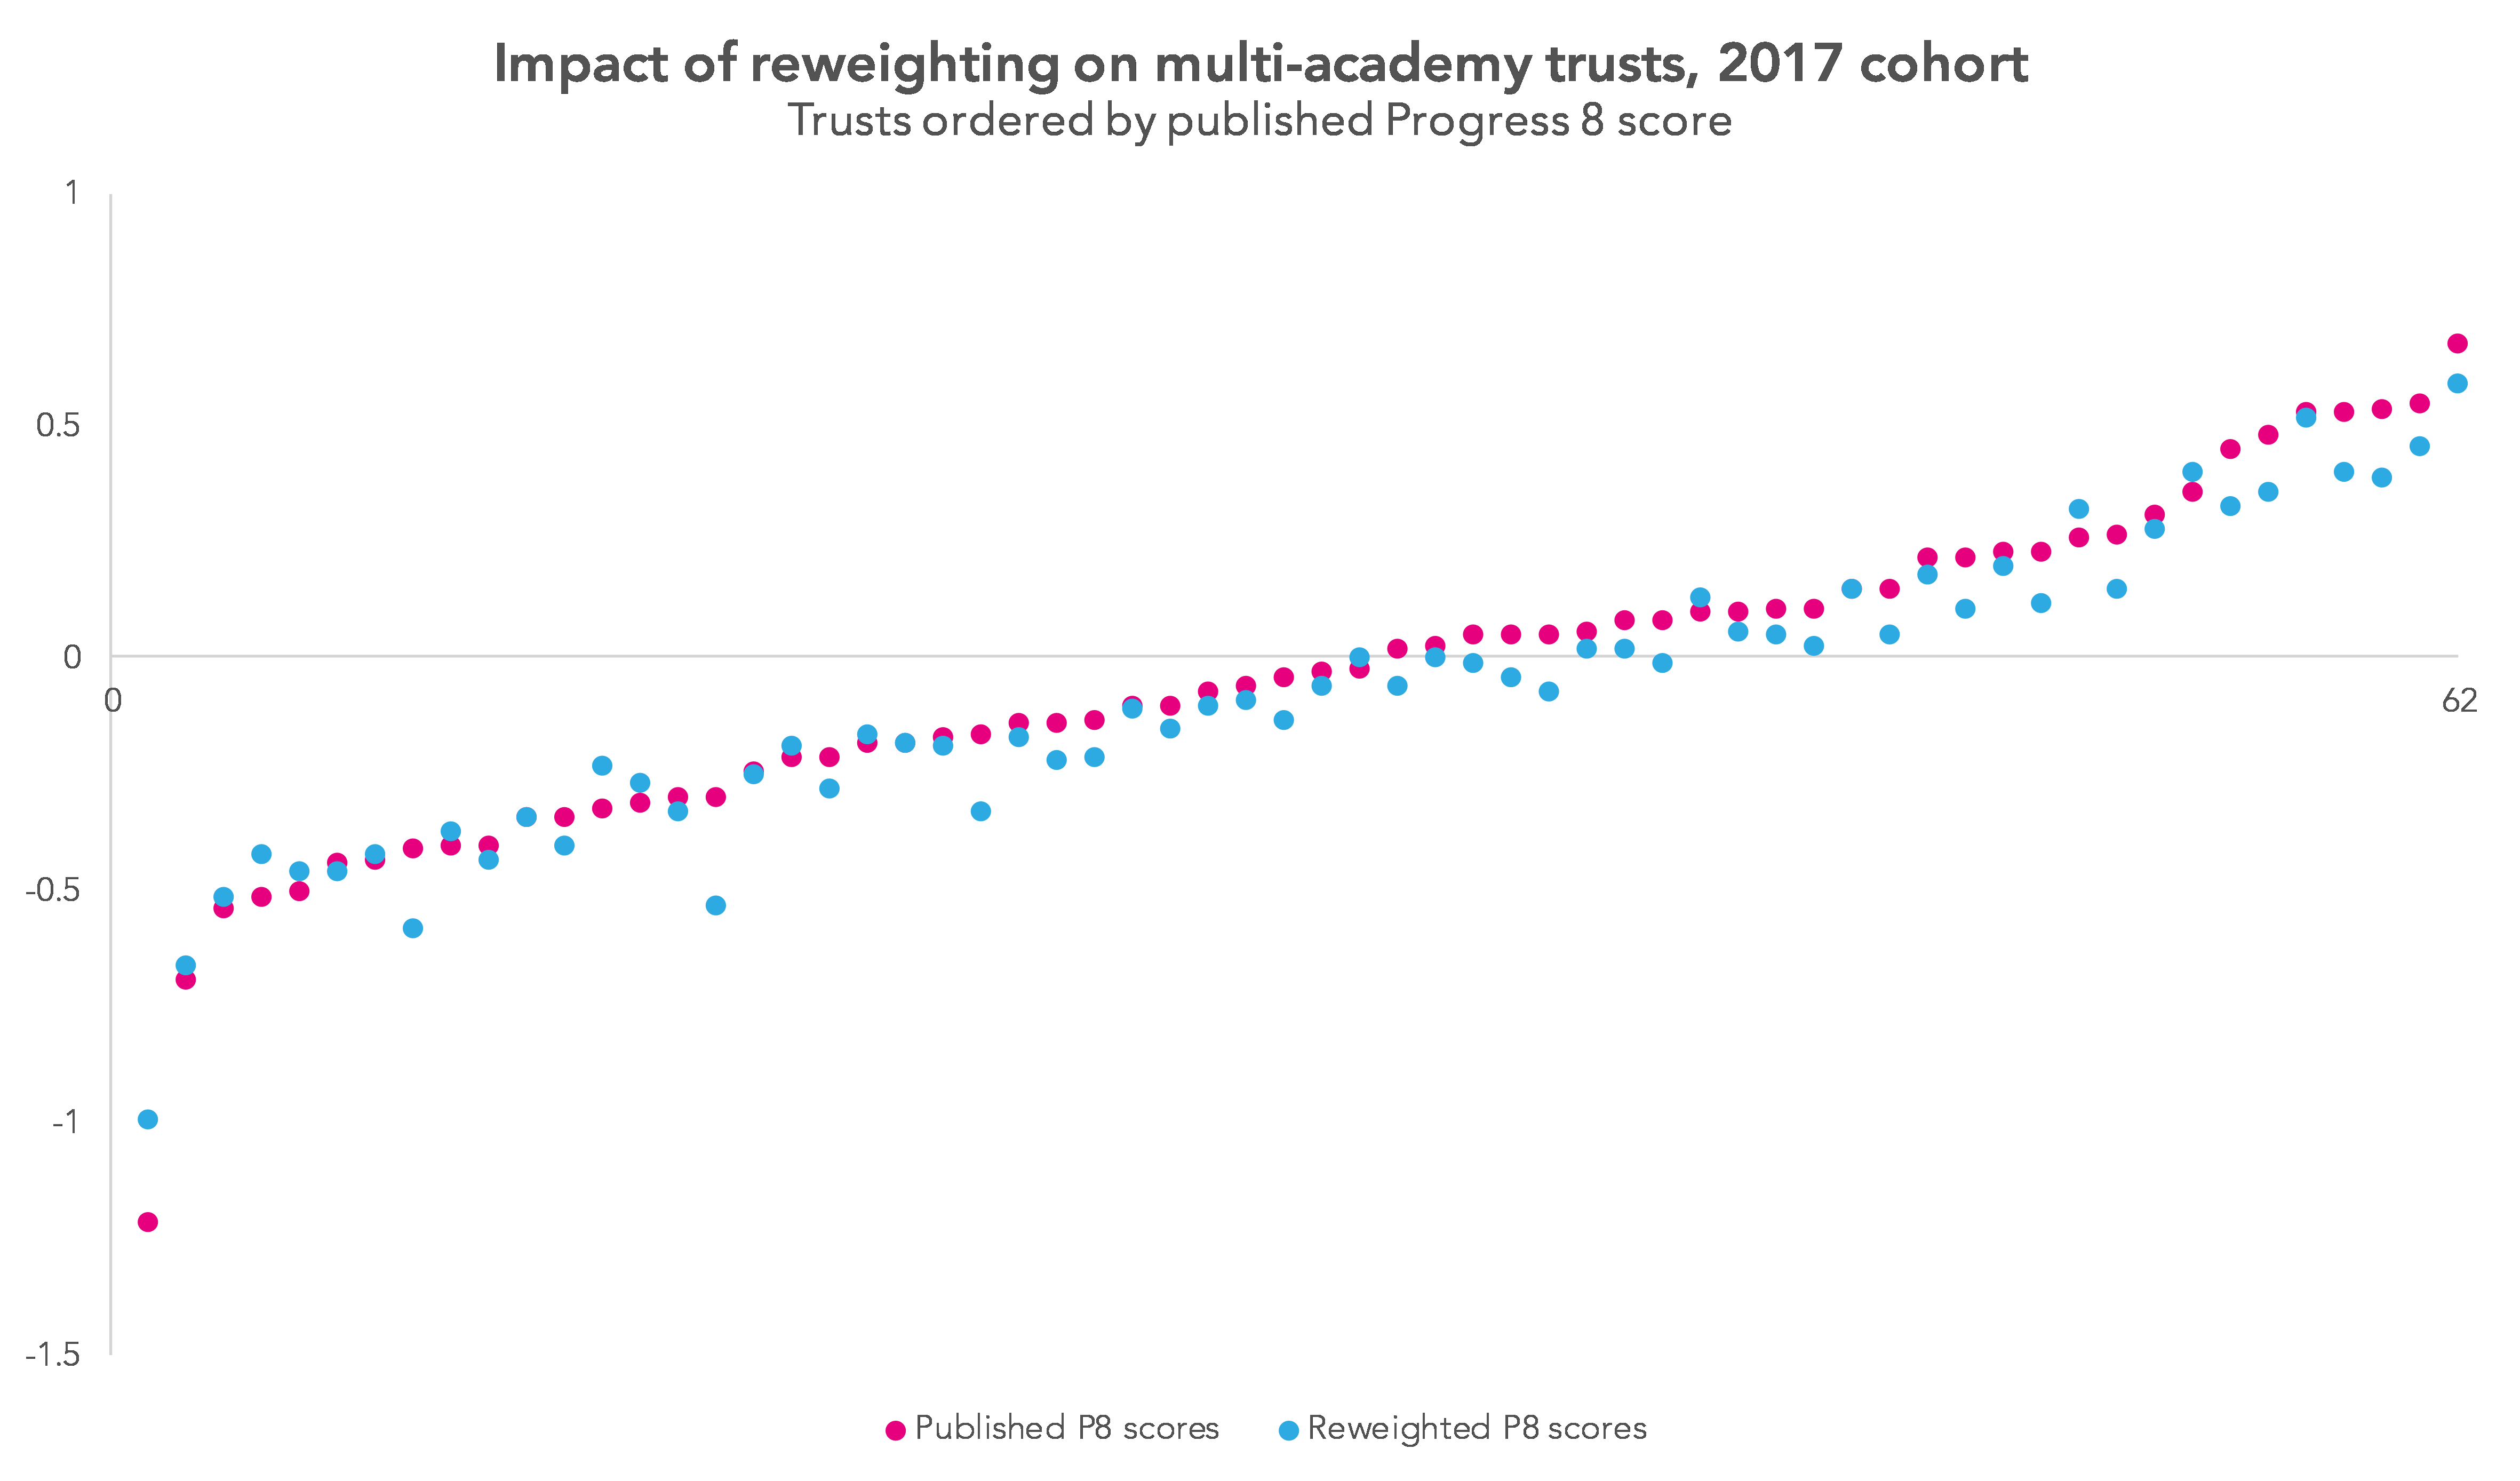
The overall impact of reweighting is to flatten out the range of MAT P8 scores to some degree.
There would not be huge changes in the rank ordering of trusts, but, in general, the gap in P8 scores between trusts with the very highest scores and those towards the middle of the pack would decrease.
In total, 15 trusts would see a positive impact, three would see no change, and the remaining 44 would see a negative impact. In many cases, the impact is very small, but in individual cases they are as large as +0.22 and -0.23.
A simple average of these trust-level figures shows a mean impact of -0.04 on Progress 8 scores.
Leavers
There are likely to be a number of factors that explain the impact observed.
Firstly, several of these trusts are London-based, and inner London is the region where the greatest impact of reweighting results is seen.
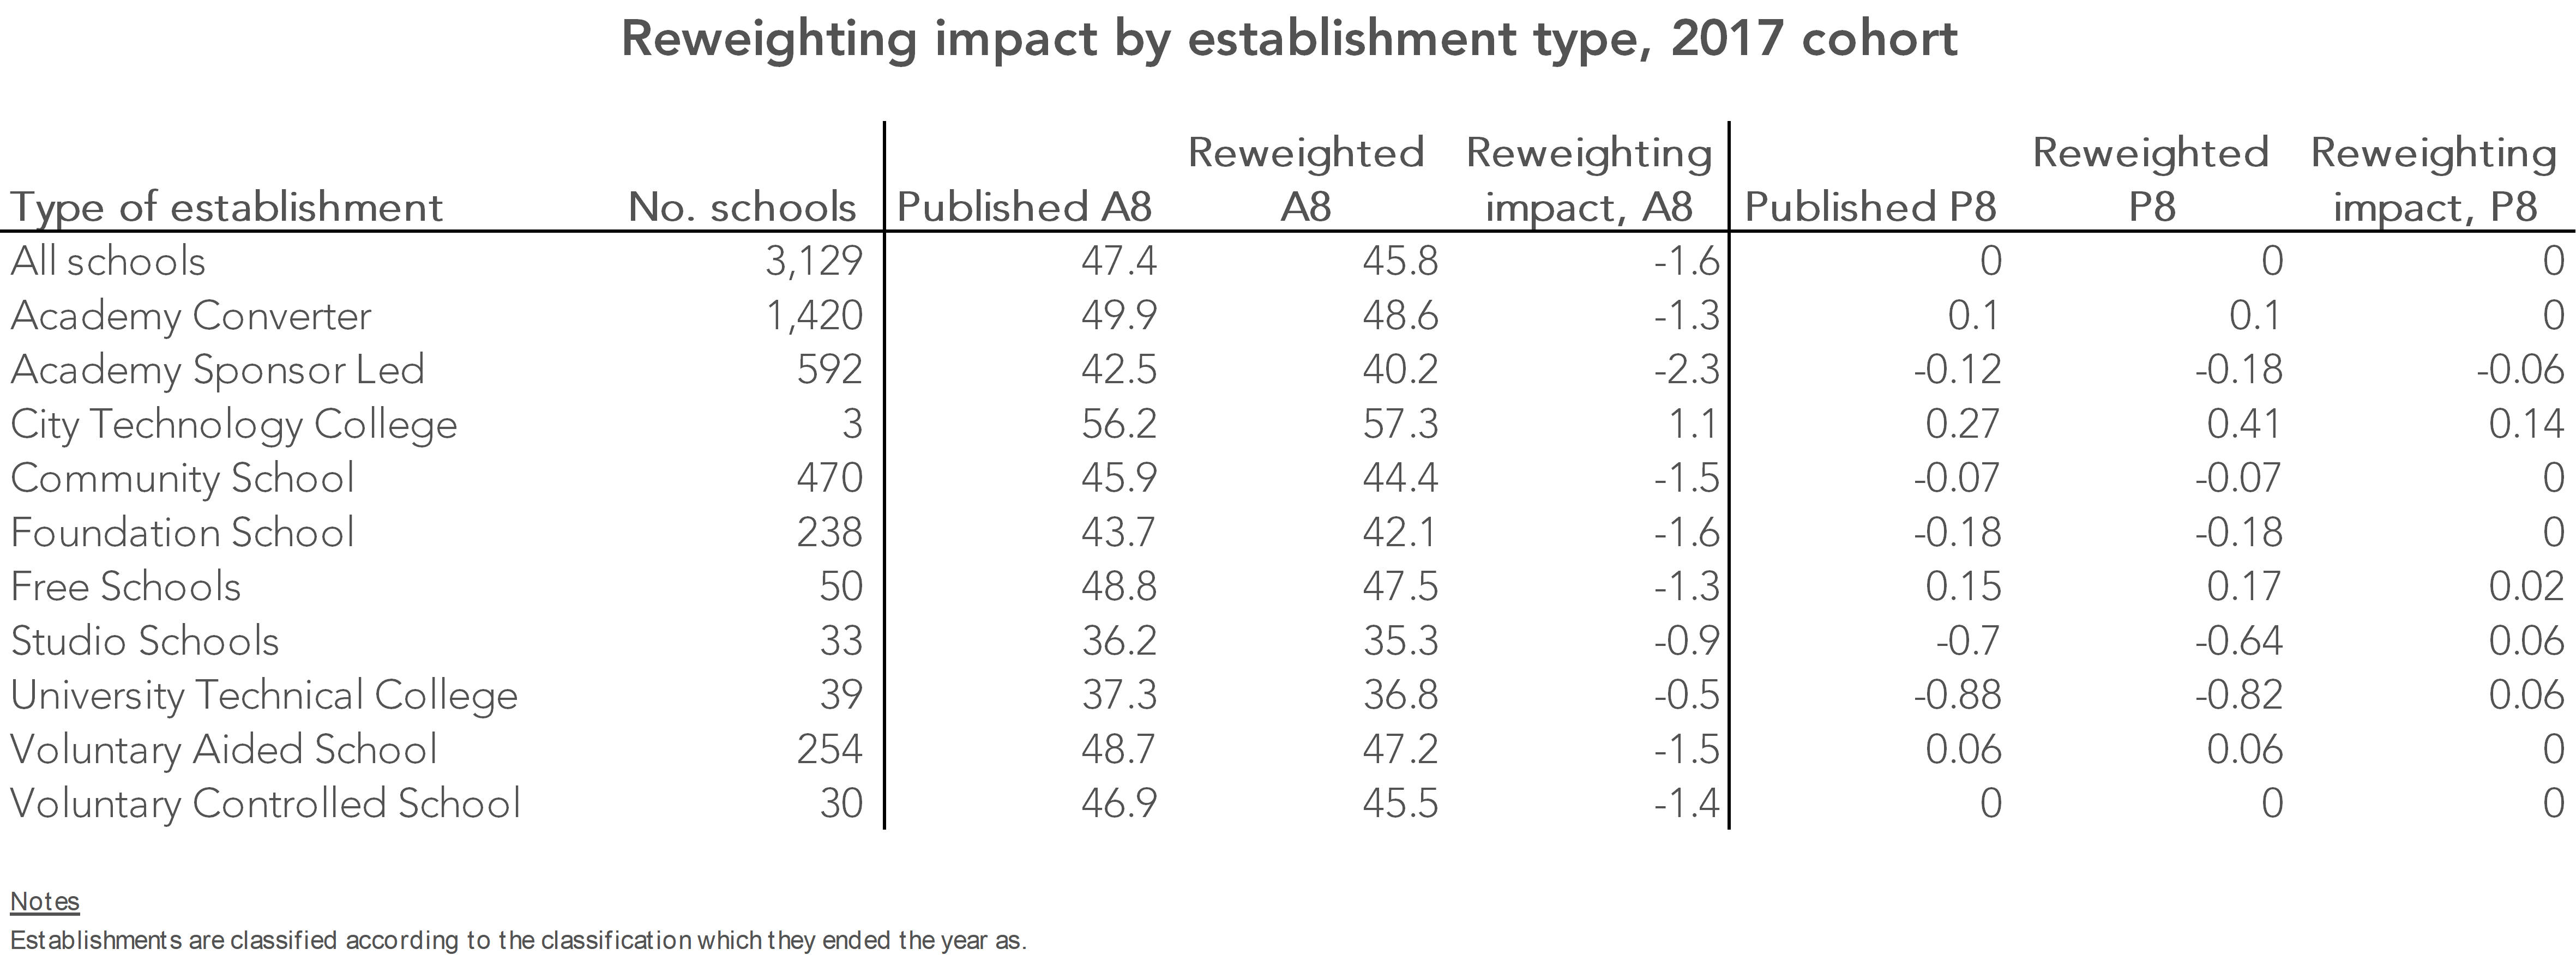
Secondly, the schools that feature in these trusts are predominantly sponsored academies. As the table below shows, looking across all schools in our Who’s Left analysis, as a group, sponsored academies would see a negative impact of a move to a reweighted approach.
The size of the reweighting impact is not directly related to the number of pupils who leave.
The chart below shows the impact of reweighting versus the number of pupils who finish secondary school at the schools counting in the MAT league tables. (It’s worth saying that this doesn’t include pupils who leave to another school that is part of the same MAT but which doesn’t count in the MAT league tables, on account of having joined the MAT recently.)
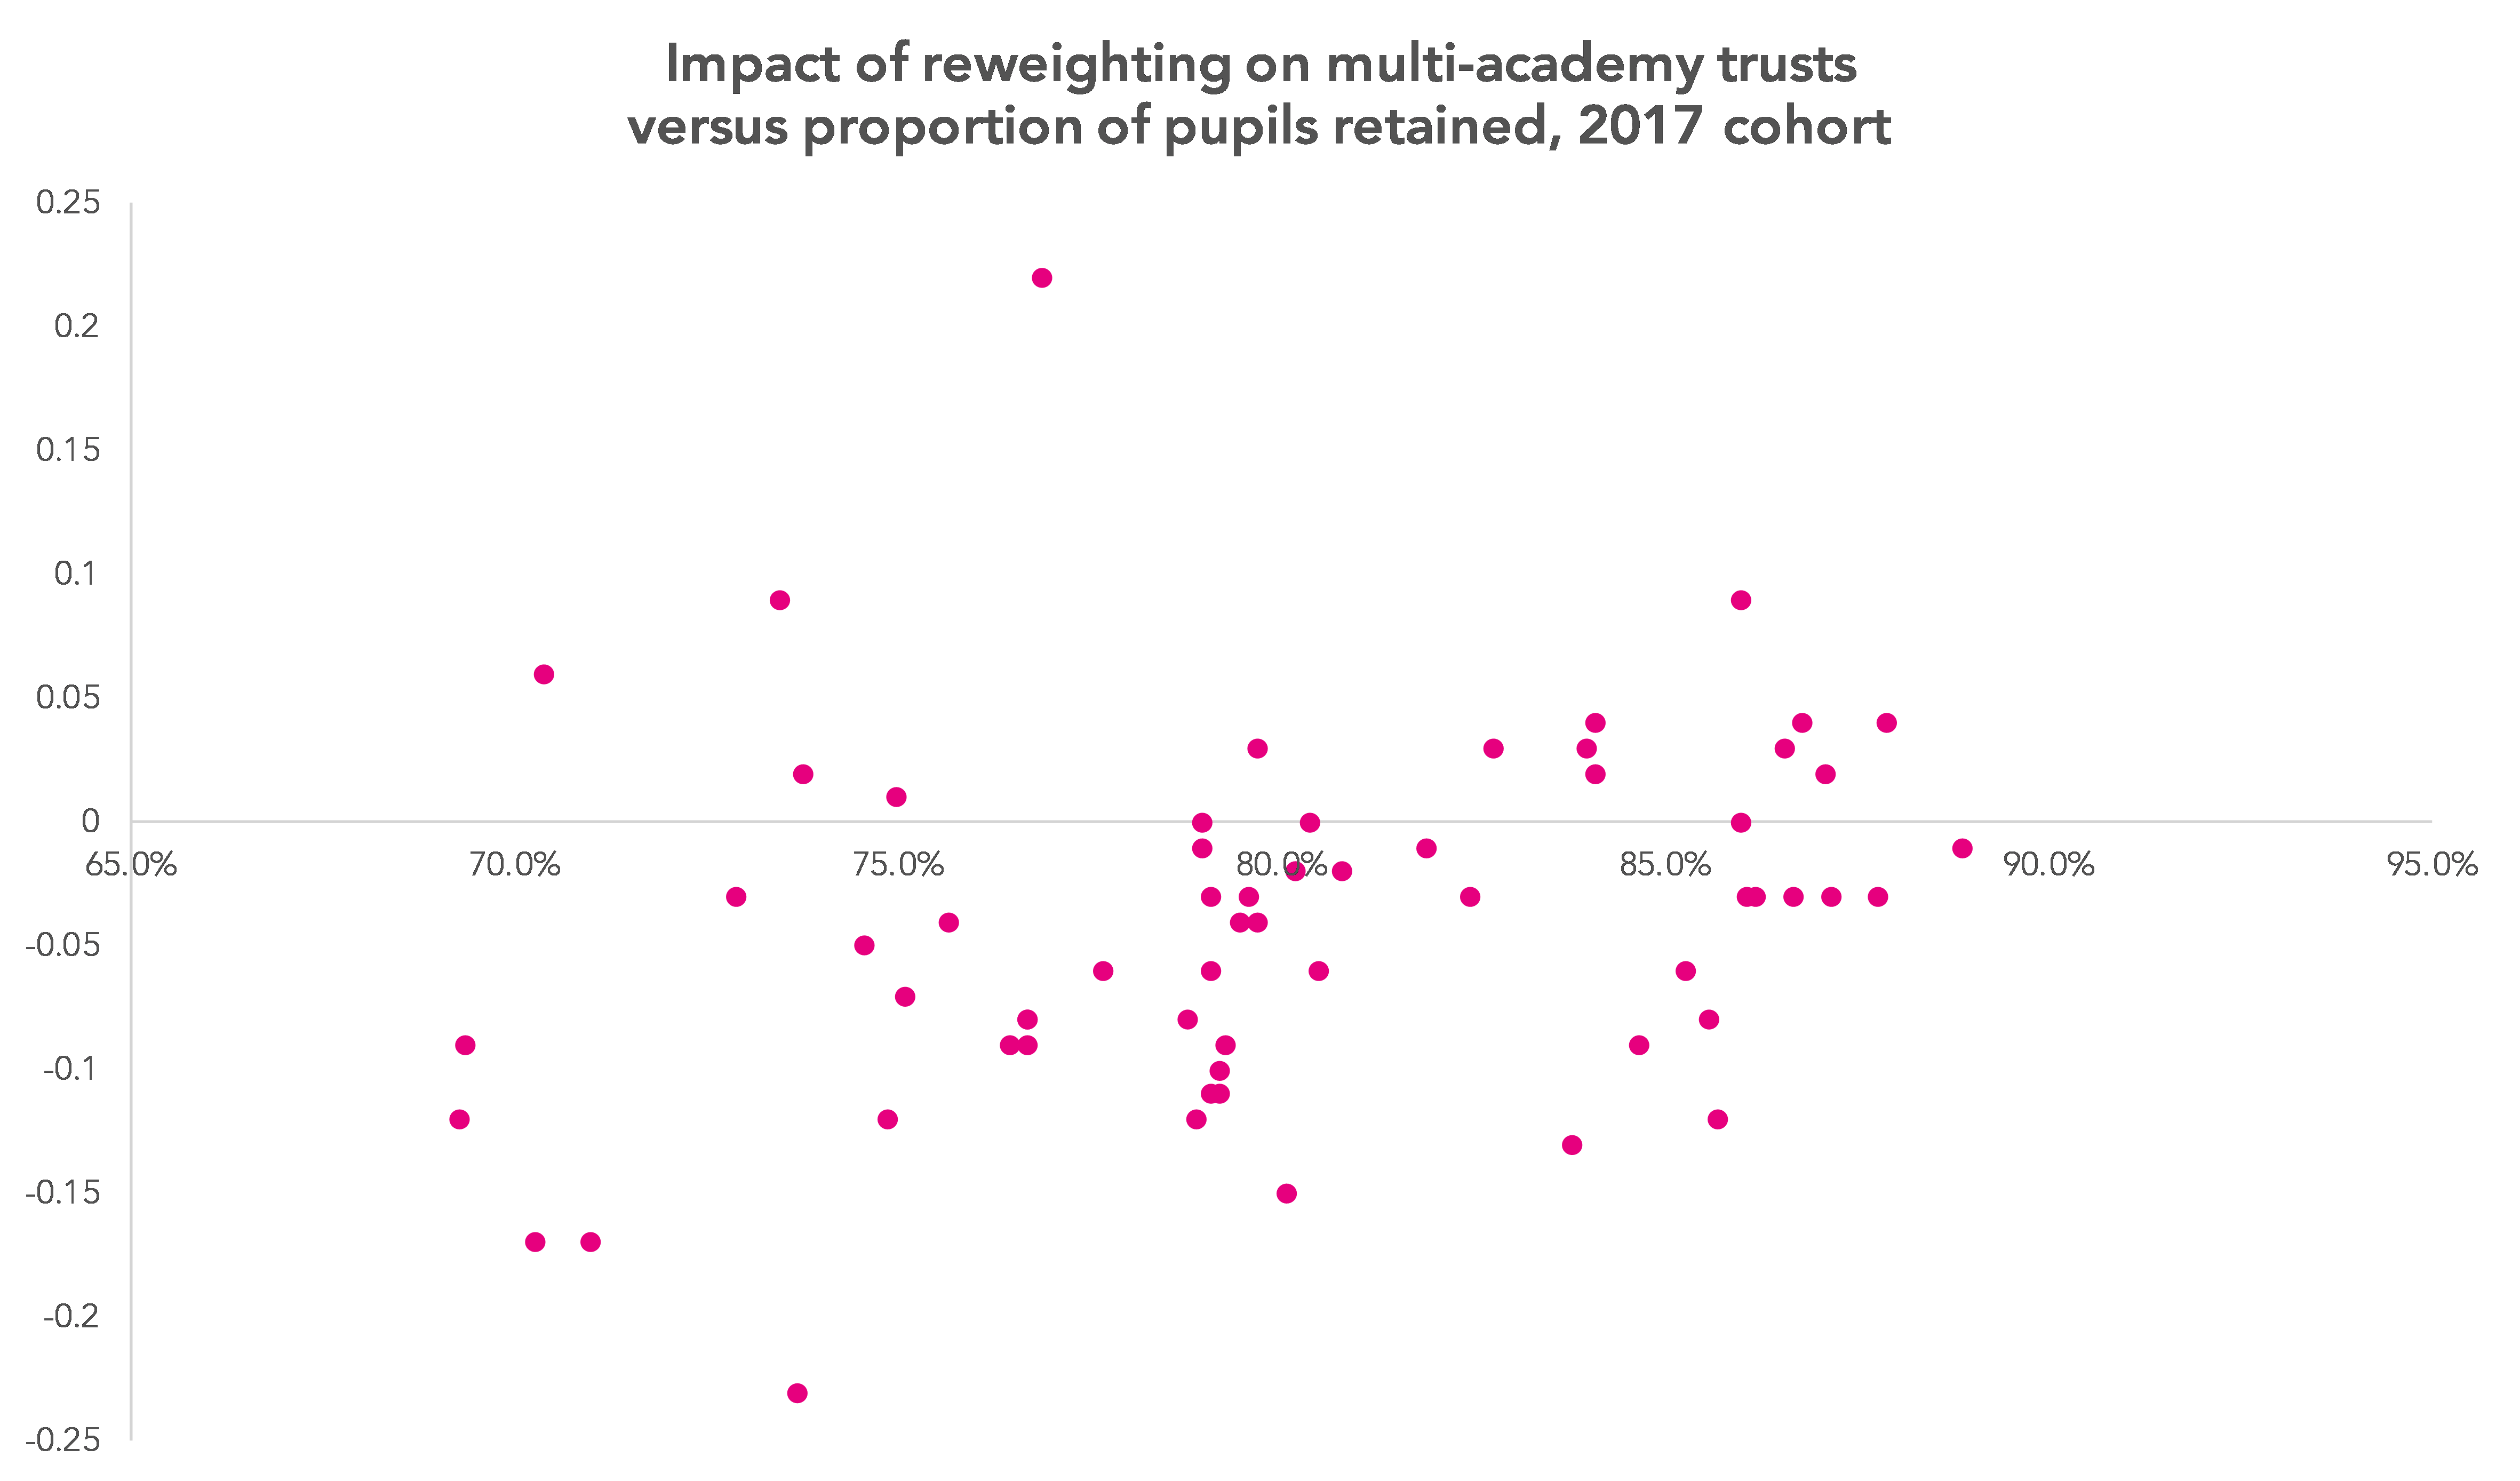
And there’s a similar picture when just the number of pupils who leave these MAT schools and leave the state system entirely is considered.
This shows that it is not simply the number of pupils who leave that determines the reweighting impact – it is down to a combination of the number of pupils who leave, at what point those pupils leave, and what those pupils go on to attain (and what their prior attainment was), as well as the number and characteristics of pupils who have joined schools within the trust.
To be clear, this is not saying that trusts where there is a large impact of reweighting are engaging in off-rolling. As we have stated elsewhere, from data alone we do not think it is possible to reach that conclusion.
But, if as seems likely, MAT league tables are going to assume ever-greater importance, as a field we should ask whether the comparison they make is a meaningful one, and whether we think they send the right messages in terms of the importance of inclusion, and of establishments admitting pupils in need of a school place.
An alternative method of reweighting
In this first set of reweighted figures, pupils are included even if they are not recorded as having taken any GCSEs or equivalent qualifications. If a pupil is not recorded as having taken any exams, they are given an A8 score of 0. Pupils are also included if they took some exams but their results did not count towards any establishment.
In some cases, this will include pupils who have left the system entirely, for example through emigration, rather than just those who remain in the system but did not take any exams.
To show the effect of taking out of the analysis pupils who are not recorded as having taken any GCSEs or equivalent qualifications, or, if they did, whose results did not count towards any establishment, we have produced a second set of reweighted figures that excludes these pupils.
As the chart below shows, in most cases this reweighting (labelled as reweighted P8 scores, version two) gives a value somewhere between the published P8 value for the trust and the value given in our first version of reweighting.

If a reweighting approach were to be adopted, there would need to be an extension of a mechanism currently in place, to allow schools to request amendments to their results in cases where a child had left England permanently, or died, at any point between Year 7 and Year 11.
In the absence of this, the true impact of reweighting, ignoring pupils who were legitimately no longer part of the cohort, is likely to fall somewhere between those resulting from the two reweighting approaches described above.
Full data, giving the impact of both reweighting calculations, is given in the table below, with details of the methodology used available here. MATs that wish to gain a better understanding of their own data are encouraged to contact the team.
Reweighting impact by multi-academy trust, 2017 cohort
| Chain name | No. schools | Published P8 | Reweighted P8, version one | Change (reweighted P8 v1 - published P8) | Reweighted P8, version two | Change (reweighted P8 v2 - published P8) |
|---|---|---|---|---|---|---|
| Academies Enterprise Trust (AET) | 29 | -0.34 | -0.34 | 0 | -0.34 | 0 |
| Academy Transformation Trust (ATT) | 9 | 0.06 | 0.02 | -0.04 | 0.04 | -0.02 |
| Aldridge Education | 5 | -0.44 | -0.46 | -0.02 | -0.48 | -0.04 |
| ARK Schools | 15 | 0.15 | 0.05 | -0.1 | 0.1 | -0.05 |
| Aspirations Academies Trust (AAT) | 4 | 0.05 | -0.04 | -0.09 | -0.01 | -0.06 |
| Bourne Education Trust | 3 | 0.08 | 0.02 | -0.06 | 0.05 | -0.03 |
| Bright Futures Educational Trust | 3 | 0.08 | -0.01 | -0.09 | 0 | -0.08 |
| Brook Learning Trust | 3 | -0.21 | -0.19 | 0.02 | -0.18 | 0.03 |
| Brooke Weston Trust | 5 | -0.1 | -0.11 | -0.01 | -0.1 | 0 |
| Cabot Learning Federation | 7 | -0.18 | -0.18 | 0 | -0.19 | -0.01 |
| Cambridge Meridian Academies Trust (CMAT) | 3 | 0.22 | 0.18 | -0.04 | 0.21 | -0.01 |
| CfBT Education Trust | 5 | -0.07 | -0.1 | -0.03 | -0.11 | -0.04 |
| Creative Education Trust | 5 | 0.05 | -0.01 | -0.06 | 0 | -0.05 |
| David Meller | 4 | -0.32 | -0.23 | 0.09 | -0.24 | 0.08 |
| David Ross Education Trust (DRET) | 8 | 0.1 | 0.06 | -0.04 | 0.07 | -0.03 |
| Delta Academies Trust (Delta) | 12 | 0.23 | 0.12 | -0.11 | 0.12 | -0.11 |
| Diocese of London | 7 | 0.53 | 0.4 | -0.13 | 0.44 | -0.09 |
| Diocese of Oxford | 3 | 0.05 | -0.07 | -0.12 | -0.03 | -0.08 |
| Diverse Academies Trust | 5 | 0.1 | 0.13 | 0.03 | 0.12 | 0.02 |
| Dixons Academy Trust | 3 | 0.53 | 0.52 | -0.01 | 0.55 | 0.02 |
| E-ACT | 11 | -0.1 | -0.15 | -0.05 | -0.15 | -0.05 |
| Eastern Multi-Academy Trust | 3 | -0.5 | -0.46 | 0.04 | -0.45 | 0.05 |
| Emmanuel Schools Foundation | 3 | -0.31 | -0.27 | 0.04 | -0.3 | 0.01 |
| Fylde Coast Teaching School Ltd | 3 | -0.41 | -0.58 | -0.17 | -0.56 | -0.15 |
| Grace Foundation | 3 | -0.16 | -0.33 | -0.17 | -0.31 | -0.15 |
| Greenwood Academies Trust | 8 | -0.43 | -0.42 | 0.01 | -0.41 | 0.02 |
| Haberdashers Askes' Federation Trust | 3 | -0.14 | -0.22 | -0.08 | -0.2 | -0.06 |
| Harris Federation | 17 | 0.54 | 0.39 | -0.15 | 0.42 | -0.12 |
| Hart Schools Trust | 3 | -1.21 | -0.99 | 0.22 | -0.96 | 0.25 |
| Inspiration Trust | 3 | 0.55 | 0.46 | -0.09 | 0.48 | -0.07 |
| Kemnal Academy Trust, The (TKAT) | 13 | -0.24 | -0.25 | -0.01 | -0.23 | 0.01 |
| Kent Catholic Schools Partnership (KCSP) | 3 | 0.36 | 0.4 | 0.04 | 0.4 | 0.04 |
| Landau Forte Charitable Trust | 3 | -0.02 | 0 | 0.02 | 0.02 | 0.04 |
| Learning Schools Trust | 3 | -0.4 | -0.43 | -0.03 | -0.39 | 0.01 |
| Leigh Academies Trust | 5 | -0.3 | -0.33 | -0.03 | -0.32 | -0.02 |
| Mercers Company, The | 4 | -0.06 | -0.09 | -0.03 | -0.07 | -0.01 |
| Northern Education Trust | 7 | -0.17 | -0.19 | -0.02 | -0.2 | -0.03 |
| Northern Schools Trust | 3 | -0.3 | -0.53 | -0.23 | -0.42 | -0.12 |
| Oasis Community Learning | 14 | -0.13 | -0.21 | -0.08 | -0.19 | -0.06 |
| Ormiston Academies Trust | 25 | -0.04 | -0.13 | -0.09 | -0.1 | -0.06 |
| Outwood Grange Academies Trust | 9 | 0.48 | 0.36 | -0.12 | 0.37 | -0.11 |
| Rosedale Hewens Academy Trust | 4 | 0.26 | 0.32 | 0.06 | 0.4 | 0.14 |
| Stoke-on-Trent College | 4 | -0.21 | -0.28 | -0.07 | -0.3 | -0.09 |
| Swale Academies Trust | 3 | -0.03 | -0.06 | -0.03 | -0.03 | 0 |
| Tapton School Academy trust | 3 | 0.03 | 0 | -0.03 | 0.03 | 0 |
| The Co-operative Group | 3 | 0.02 | -0.06 | -0.08 | -0.04 | -0.06 |
| The Dean Trust | 3 | -0.14 | -0.17 | -0.03 | -0.16 | -0.02 |
| The Diocese of Westminster Academy Trust | 6 | 0.31 | 0.28 | -0.03 | 0.3 | -0.01 |
| The Education Fellowship Trust | 4 | -0.18 | -0.16 | 0.02 | -0.16 | 0.02 |
| The Midland Academies Trust | 3 | -0.69 | -0.66 | 0.03 | -0.63 | 0.06 |
| The Priory Federation of Academies Trust | 4 | 0.23 | 0.2 | -0.03 | 0.19 | -0.04 |
| The Redhill Academy Trust | 3 | 0.27 | 0.15 | -0.12 | 0.17 | -0.1 |
| The Seckford Foundation Free Schools Trust | 3 | 0.45 | 0.33 | -0.12 | 0.37 | -0.08 |
| The Skinners' Company | 3 | 0.11 | 0.05 | -0.06 | 0.09 | -0.02 |
| The Thinking Schools Academy Trust | 3 | 0.68 | 0.59 | -0.09 | 0.62 | -0.06 |
| Transforming Education in Norfolk (the TEN Group) | 5 | -0.34 | -0.4 | -0.06 | -0.35 | -0.01 |
| Tudor Grange Academies Trust | 3 | 0.15 | 0.15 | 0 | 0.14 | -0.01 |
| UCAT | 4 | -0.51 | -0.42 | 0.09 | -0.41 | 0.1 |
| United Learning | 26 | 0.22 | 0.11 | -0.11 | 0.14 | -0.08 |
| Wakefield City Academies Trust | 5 | -0.54 | -0.51 | 0.03 | -0.53 | 0.01 |
| White Rose Trust | 3 | 0.11 | 0.03 | -0.08 | 0.02 | -0.09 |
| Woodard Academies Trust | 5 | -0.4 | -0.37 | 0.03 | -0.37 | 0.03 |
Now read the next post in the Who’s Left 2018 series.
Want to stay up-to-date with the latest research from FFT Education Datalab? Sign up to Datalab’s mailing list to get notifications about new blogposts, or to receive the team’s half-termly newsletter.


Leave A Comment