We’ve recently looked at pupils who took GNVQs and applied science qualifications such as BTECs at Key Stage 4, as part of a project looking at long-term outcomes.
Both posts found that pupils who took these qualifications tended to have (superficially) higher attainment at Key Stage 4, but then had similar subsequent outcomes to those who did not.
The conclusion was that these qualifications were over-valued in school performance tables (league tables, as they are commonly known).
In this blogpost, I’m going to turn my attention to post-16 education and look at Level 3 BTECs – including the Level 3 National Diploma (equivalent to three A-Levels) and the Level 3 National Certificate (equivalent to two A-levels).
There was considerable growth in BTEC take-up from the mid-2000s, as shown in this report from the Social Market Foundation (figure 3) [PDF].
I wrote about the equivalence of BTECs and A-Levels last year, concluding that the former were over-valued in terms of the point scores historically used by both the Department for Education and UCAS.
Comparing like with like
We’re going to compare the outcomes of students who took exclusively or almost exclusively BTEC qualifications with those of students who took exclusively or almost exclusively A-Levels, focusing on the cohort who were aged 16 at the start of the 2009/10 academic year.[1]
At 16, students have a far wider range of options open to them than they do at 14. They have to find a suitable school or college, as well as find suitable courses. In most of England, schools have sixth forms, but in some areas, all or almost all sixth form provision is in colleges (sixth form colleges and general further education colleges) [PDF].
Consequently, students have different sets of options open to them at 16, both in terms of institutions and courses. This makes the comparison of A-Level and BTEC extremely tricky – we’ll come back to this later.
Out of the total cohort of around 560,000 students, there were 48,000 taking exclusively or almost exclusively BTEC qualifications (those taking BTECs equivalent to two or more A-Levels) and 206,000 taking exclusively or almost exclusively A-Levels (those taking two or more A-Levels).[2]
The two groups are not particularly comparable in terms of their characteristics and attainment at Key Stages 2, 3 and 4. But we can run a statistical matching procedure to balance the two groups in terms of their characteristics and prior attainment so that we are comparing like with like as much as possible.[3] Doing so produces a match for 38,000 of the 48,000 BTEC students.
Subsequent outcomes
In considering long-term outcomes, I’ll look at the following measures:
- Achievement of NQF Level 3 (two A-Levels or equivalent) by age 19. Source: National Pupil Database post-16 achievement data
- Average points per entry in Level 3 qualifications entered by age 19. Source: National Pupil Database post-16 achievement data
- Higher education participation at NQF level 6 (an honours degree or equivalent) by age 22. Source: Higher Education Statistics Agency student record
- Higher education achievement at NQF level 6 (an honours degree or equivalent) by age 22. Source: Higher Education Statistics Agency student record
- Higher education participation at NQF level 6 (an honours degree or equivalent) or higher in 2015/16 (age 22). Source: Higher Education Statistics Agency student record
- Employed for at least 180 days in 2015/16 (age 22). Source: matched HMRC employment (P45) data
- Earnings at age 22. Source: matched HMRC earnings (P14) data
There are some limitations, however. None of the data sources captures emigration or death. The HMRC data excludes those who are self-employed.
Some young people drop out the various data sources used. I therefore calculate an attrition indicator, measuring the proportion of individuals not observed in any source after age 22.
I also report the percentage for whom we have earnings data in 2015/16. When earnings are reported, we only include those for whom we have earnings data.
The results
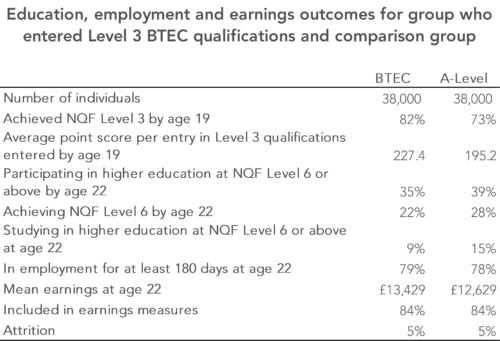
The table below shows the long-term outcomes for the A-Level and the BTEC groups.
It’s fair to say that the results are mixed.
First things first: the BTEC group appears to have much stronger attainment by age 19.
The average point score per entry (APSE) achieved by the BTEC group in Level 3 qualifications taken by age 19 was over 30 points higher than that of the A-Level group. In broad terms, the APSE of the BTEC group was equivalent to midway between grade C and grade B at A-Level, whereas the APSE of the A-Level group was midway between grade D and grade C.
Pupils in the BTEC group were also more likely to have achieved NQF Level 3 by age 19, which tends to suggest that they were more likely to complete their courses than their peers in the A-Level group.
The BTEC group were slightly more likely to be in employment in 2015/16 and were earning £800 per year more on average.
However, they were also less likely to have participated in higher education or to have achieved a degree.
In fact, by dividing the higher education achievement rate by the participation rate you can infer a completion rate. This was 64% among the BTEC group and 72% among the A-Level group. The relatively low higher education completion rate for BTEC students was picked up in this report by the Higher Education Policy Institute [PDF].
The lower employment and earnings outcomes of the A-Level group are only partially explained by a higher proportion still being in higher education in 2015/16. Restricting the analysis to those who were not in higher education reduces the earnings advantage from £800 to £374.
So, given what we earlier observed about the point scores available for BTECs compared to those for A-Levels, were BTECs over-valued in performance tables all those years ago? Undoubtedly yes. BTECs included in this year’s performance tables have been reformed and the early signs are that average point scores are a lot lower [PDF].
Would students have been better off taking A-Levels? That’s a harder one to answer.
In trying to compare like with like I’ve made a tacit assumption that the choice of taking A-Levels or BTECs was effectively random for the students included in this analysis.
This was probably not true. Other factors may have influenced their choice. For example, the A-Level group may well have been more likely to have had higher education in mind when choosing their post-16 study programme.
One option for checking the robustness of these results is to make use of the geographical variation in options available to students – comparing the A-Level group in areas where there are lower BTEC take-up rates with the BTEC group in areas with lower A-Level take-up rates. But doing so does not make any substantive change to the findings.
Want to stay up-to-date with the latest research from FFT Education Datalab? Follow us on Twitter to get all of our research as it comes out.
The support of the Economic and Social Research Council is gratefully acknowledged.
1. This analysis is based on students who completed Key Stage 4 in a state-funded mainstream school, excluding selective schools.
2. Unlike in the previous blogposts in this series, for this analysis we know which courses students started doing in Year 12. This is preferable to relying on qualifications entered in Year 13 as historically there has been considerable drop-out from post-16 Level 3 courses – particularly students not continuing to Year 13 having taken AS-levels at the end of Year 12. This is possible using post-16 learning aims data in the school census for those in schools and the individualised learner record for those in colleges.
3. Nearest neighbour matching without replacement is used. Pupils are matched exactly on region, Year 11 free school meals eligibility and whether they reached the end of Key Stage 4 in a school with a sixth form (or not). They are then matched by propensity score matching on the other characteristics and prior attainment. A caliper of 0.05 standard deviations is used to ensure close matches
A table comparing the two groups, pre- and post-matching can be found here [PDF].


Leave A Comment