School performance tables, and high stakes accountability more generally, incentivise secondary schools to maximise the Attainment 8 scores of their pupils.
If this is achieved by improving teaching and learning then the incentives are working as intended. Having said that, the approach to maintaining standards over time known as comparable outcomes means there are limits on the extent to which results can improve from one year to the next.
However, as we have written previously, there are also incentives to enter pupils for qualifications that are perceived to be higher scoring than others. We’ve written about the equivalence of technical awards and GCSEs, the most notable example being the European Computer Driving Licence (ECDL) which is no longer counted in performance tables.
Even amongst GCSEs there isn’t comparability between subjects as we wrote here some time ago. French, German and Spanish tended to be graded more severely than other subjects, for example.
We’ve not looked at the comparability of different qualifications and subjects for a while, so let’s do so using end of Key Stage 4 data for 2018.
Fair comparison
I’m going to compare pupils’ results in each subject to their English language and maths average point score (APS), taking the two scores (using zero if a pupil did not enter) and averaging them. English and maths are used because almost everyone enters both subjects.[1]
Next, taking each pupil’s results that count towards the performance tables we can look at the difference between the points awarded in each subject and their English and maths APS – before working out the average difference for each subject.
The chart below shows technical awards with at least 5,000 state school entrants in 2018. Numbers of entrants are shown in brackets.

On the whole, pupils tend to score more points in BTEC qualifications than they do in GCSE English and maths. For most BTECs, the difference is one point on average, the equivalent of a grade at GCSE. In health and social care, it is a grade and a half.
However, some technical awards are scored more severely than English and maths. These include the Edexcel certificate in digital applications (CiDA) and the LIBF Level 2 Certificate in Financial Education (CeFE).
There is also variation among GCSEs. The chart below shows subjects with at least 20,000 entrants in 2018. Again, I’m comparing the scores in each subject to those in English and maths.
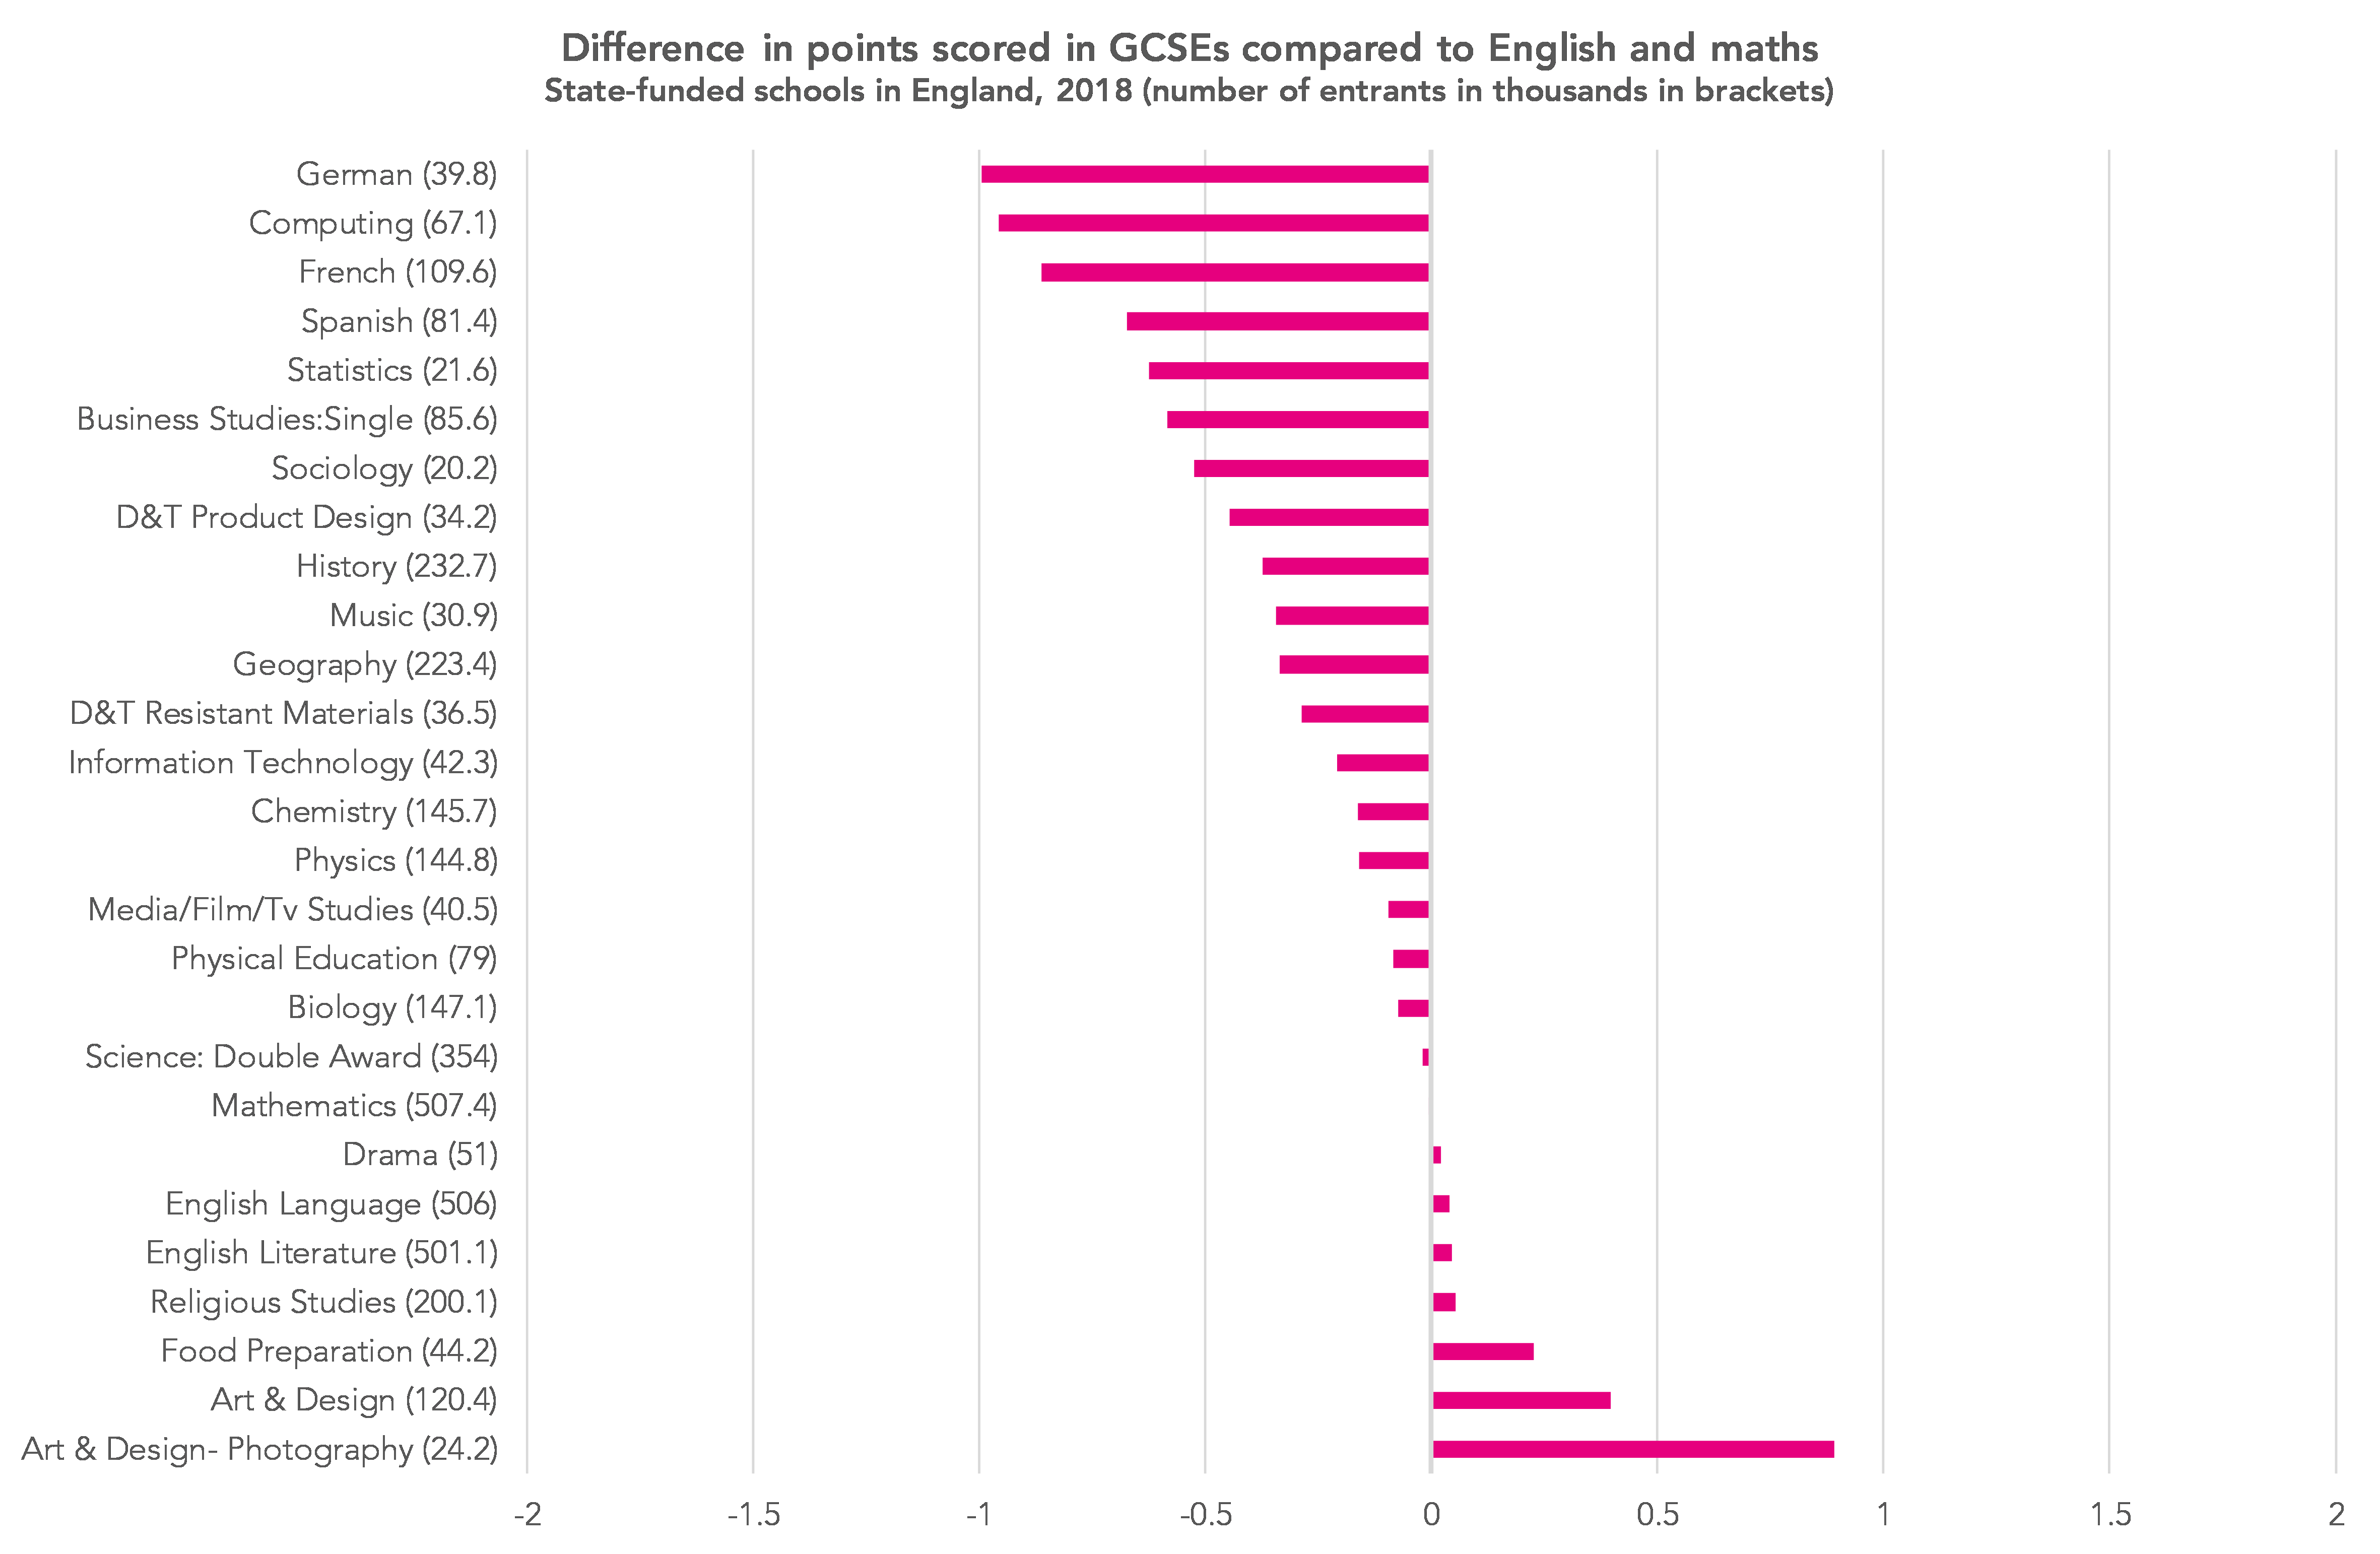
The rank order is very similar to that shown in the first table of the 2016 blogpost on GCSE inter-subject comparability.
Art and design (photography) leads the way. On average, pupils achieve 0.9 more points in this subject than in English and maths.
At the lower end, we again find French, German, Spanish and computing. Pupils even tend to achieve lower outcomes in geography and history than in English and maths, by over a third of a grade.
There is a dilemma here. On the one hand, many would argue that there should be qualifications that pupils who might struggle with academic qualifications can succeed in. On the other hand, others would argue that this creates a perverse incentive to enter other pupils for higher scoring qualifications that may not be in their best interests.
One way to square this circle might be to change the points awarded and bring them more in line with English and maths. We have previously proposed a method of recalculating Attainment 8 (and therefore Progress 8). We plan to update that work shortly.
Want to stay up-to-date with the latest research from FFT Education Datalab? Sign up to Datalab’s mailing list to get notifications about new blogposts, or to receive the team’s half-termly newsletter.
1. For all but a handful of pupils who took AS-Levels early, these scores will be based on GCSEs


Dr Jerrim and Dr Shure did a similar analysis for PISA scores against GCSE and BTEC. The correlation with GCSE grades was good but BTEC top grades were well below expected PISA grades.
https://assets.publishing.service.gov.uk/government/uploads/system/uploads/attachment_data/file/661245/PISA_2015_Further_Analysis_Report_FINAL.pdf
I would love a similar study here in Wales where it looks as though Welsh first language has been systematically given higher grades at GCSE than English language.
Hi David
Does this analysis ignore the impact of talent in art and design in particular? As one piece of anecdotal evidence we had a student educated in hospital for most of KS4. They gained an A* in Art a 4 in English Language and a 4 in Maths. They went on to gain an A in the only A level they took in Art.
Secondly, the issue with the vocational subjects only has an impact on the school’s score. FE, Universities and employers see a BTEC differently to GCSEs, therefore it is the perverse incentives of accountability tables that cause any kind of issue, not to the future of the student.
Kind regards
Hi Liam. Certainly agree with the 2nd point (think it’s what I was trying to say in the conclusion). The 1st point is fair. What we don’t know is what the grade distribution for art and design would look like if everyone took it. Perhaps it would end up more in line with English and maths if they did.
In their report on inter subject comparability at A level Ofqual rejected the idea of severe grading. They instead suggested that pupils might be less motivated in those MFL subjects or that teaching might not be as good. The principle of comparable outcomes means, though, that legacy grading trends are maintained over time, presumably despite changes in the ability profile of the cohort sitting the MFL exams (as the cohort has become smaller, it perhaps has become on average more able?). It would certainly seem to make sense that students would be less motivated in those subjects which they are less likely to pursue at A level – and given the very low conversion rates from MEL GCSE to A level, this does make some sense. And it suggests the way to address this grading imbalance in MFL over time is to improve motivation, teaching and conversion rather than just change grading.
These stats are very interesting in terms of some other subjects which are shown to be severely graded – including history. Severe grading is often blamed for the demise of MFL – if not severe grading, people blame the dominance of STEM. The ongoing popularity of history, though, severely challenges both of these hypotheses.
Hi Tom. Thanks for responding. It’s certainly plausible. Perhaps grading has declined in history as more pupils have been obliged to take it (rather than choosing to take it) to fill their Attainment 8 buckets? The issues around MFL grading have been kicking around for some time. For instance, this report form QCA back in 2008 (https://dera.ioe.ac.uk//9398/) suggests that standards were maintained as entry rates declined once MFL stopped being compulsory within the National Curriculum in 2004. The question I’ve not found an answer to is whether there has ever been consistency of grading between subjects, i.e. was there ever a time when grades awarded in MFL and maths were more in line with each other? Even in English and maths (which almost everyone enters), there isn’t comparability of grading across the prior attainment distribution and it appears that this has been the case for many years (https://ffteducationdatalab.org.uk/2016/09/why-do-pupils-with-lower-prior-attainment-do-better-in-english-than-maths-at-gcse/).
Hello David,
A really interesting article. Do you have the data from the graphs as a table?
Thanks
Thanks Paul. Sure- send us an email to educationdatalab@fft.org.uk
Dear David,
Fascinating read. As a Computer Science teacher, it would be amazing to have the drill down by the three major exam boards. AQA , OCR, and Edexcel. Is that a possibility?
Hi Jerome. Thanks very much. There are only negligible differences between the three organisations. In other words, grades tend to be lower in computer science than in other subjects but this is consistent across all the awarding organisations.