In the first of this pair of blogposts we looked at the progress made by pupils from Foundation Stage to Key Stage 4 and also at progress in the interim stages of Key Stage 1 and Key Stage 2.
We found that for pupils in the (mainly white British) group most affected by disadvantage, progress from Foundation Stage to KS1 and progress from KS2 to KS4 were the biggest contributors to total progress between ages five and 16, at least when looked at in terms of impact per Key Stage year.
Looking at pupils with long-term disadvantage who are in this group most affected by disadvantage we found that attainment at Foundation Stage accounted for around one-third of the total gap in attainment between this group and the national average at KS4.
In this blogpost, we’ll explore whether there are regional differences, and whether things have changed over time.
What happens if we look at different regions within England?
Let’s start by looking at value added scores for each region – as with the previous post, looking at pupils who completed KS4 in 2018 and who have data at all previous stages (Foundation Stage, KS1 and KS2). As before, value added scores are based on attainment in reading and mathematics (KS1, KS2) and English and mathematics (KS4).
The chart below shows these value added scores for each region. We have normalised the value added scores (putting them on a common scale, with a mean of zero and a standard deviation of 1) in order to facilitate comparison between different Key Stage combinations.
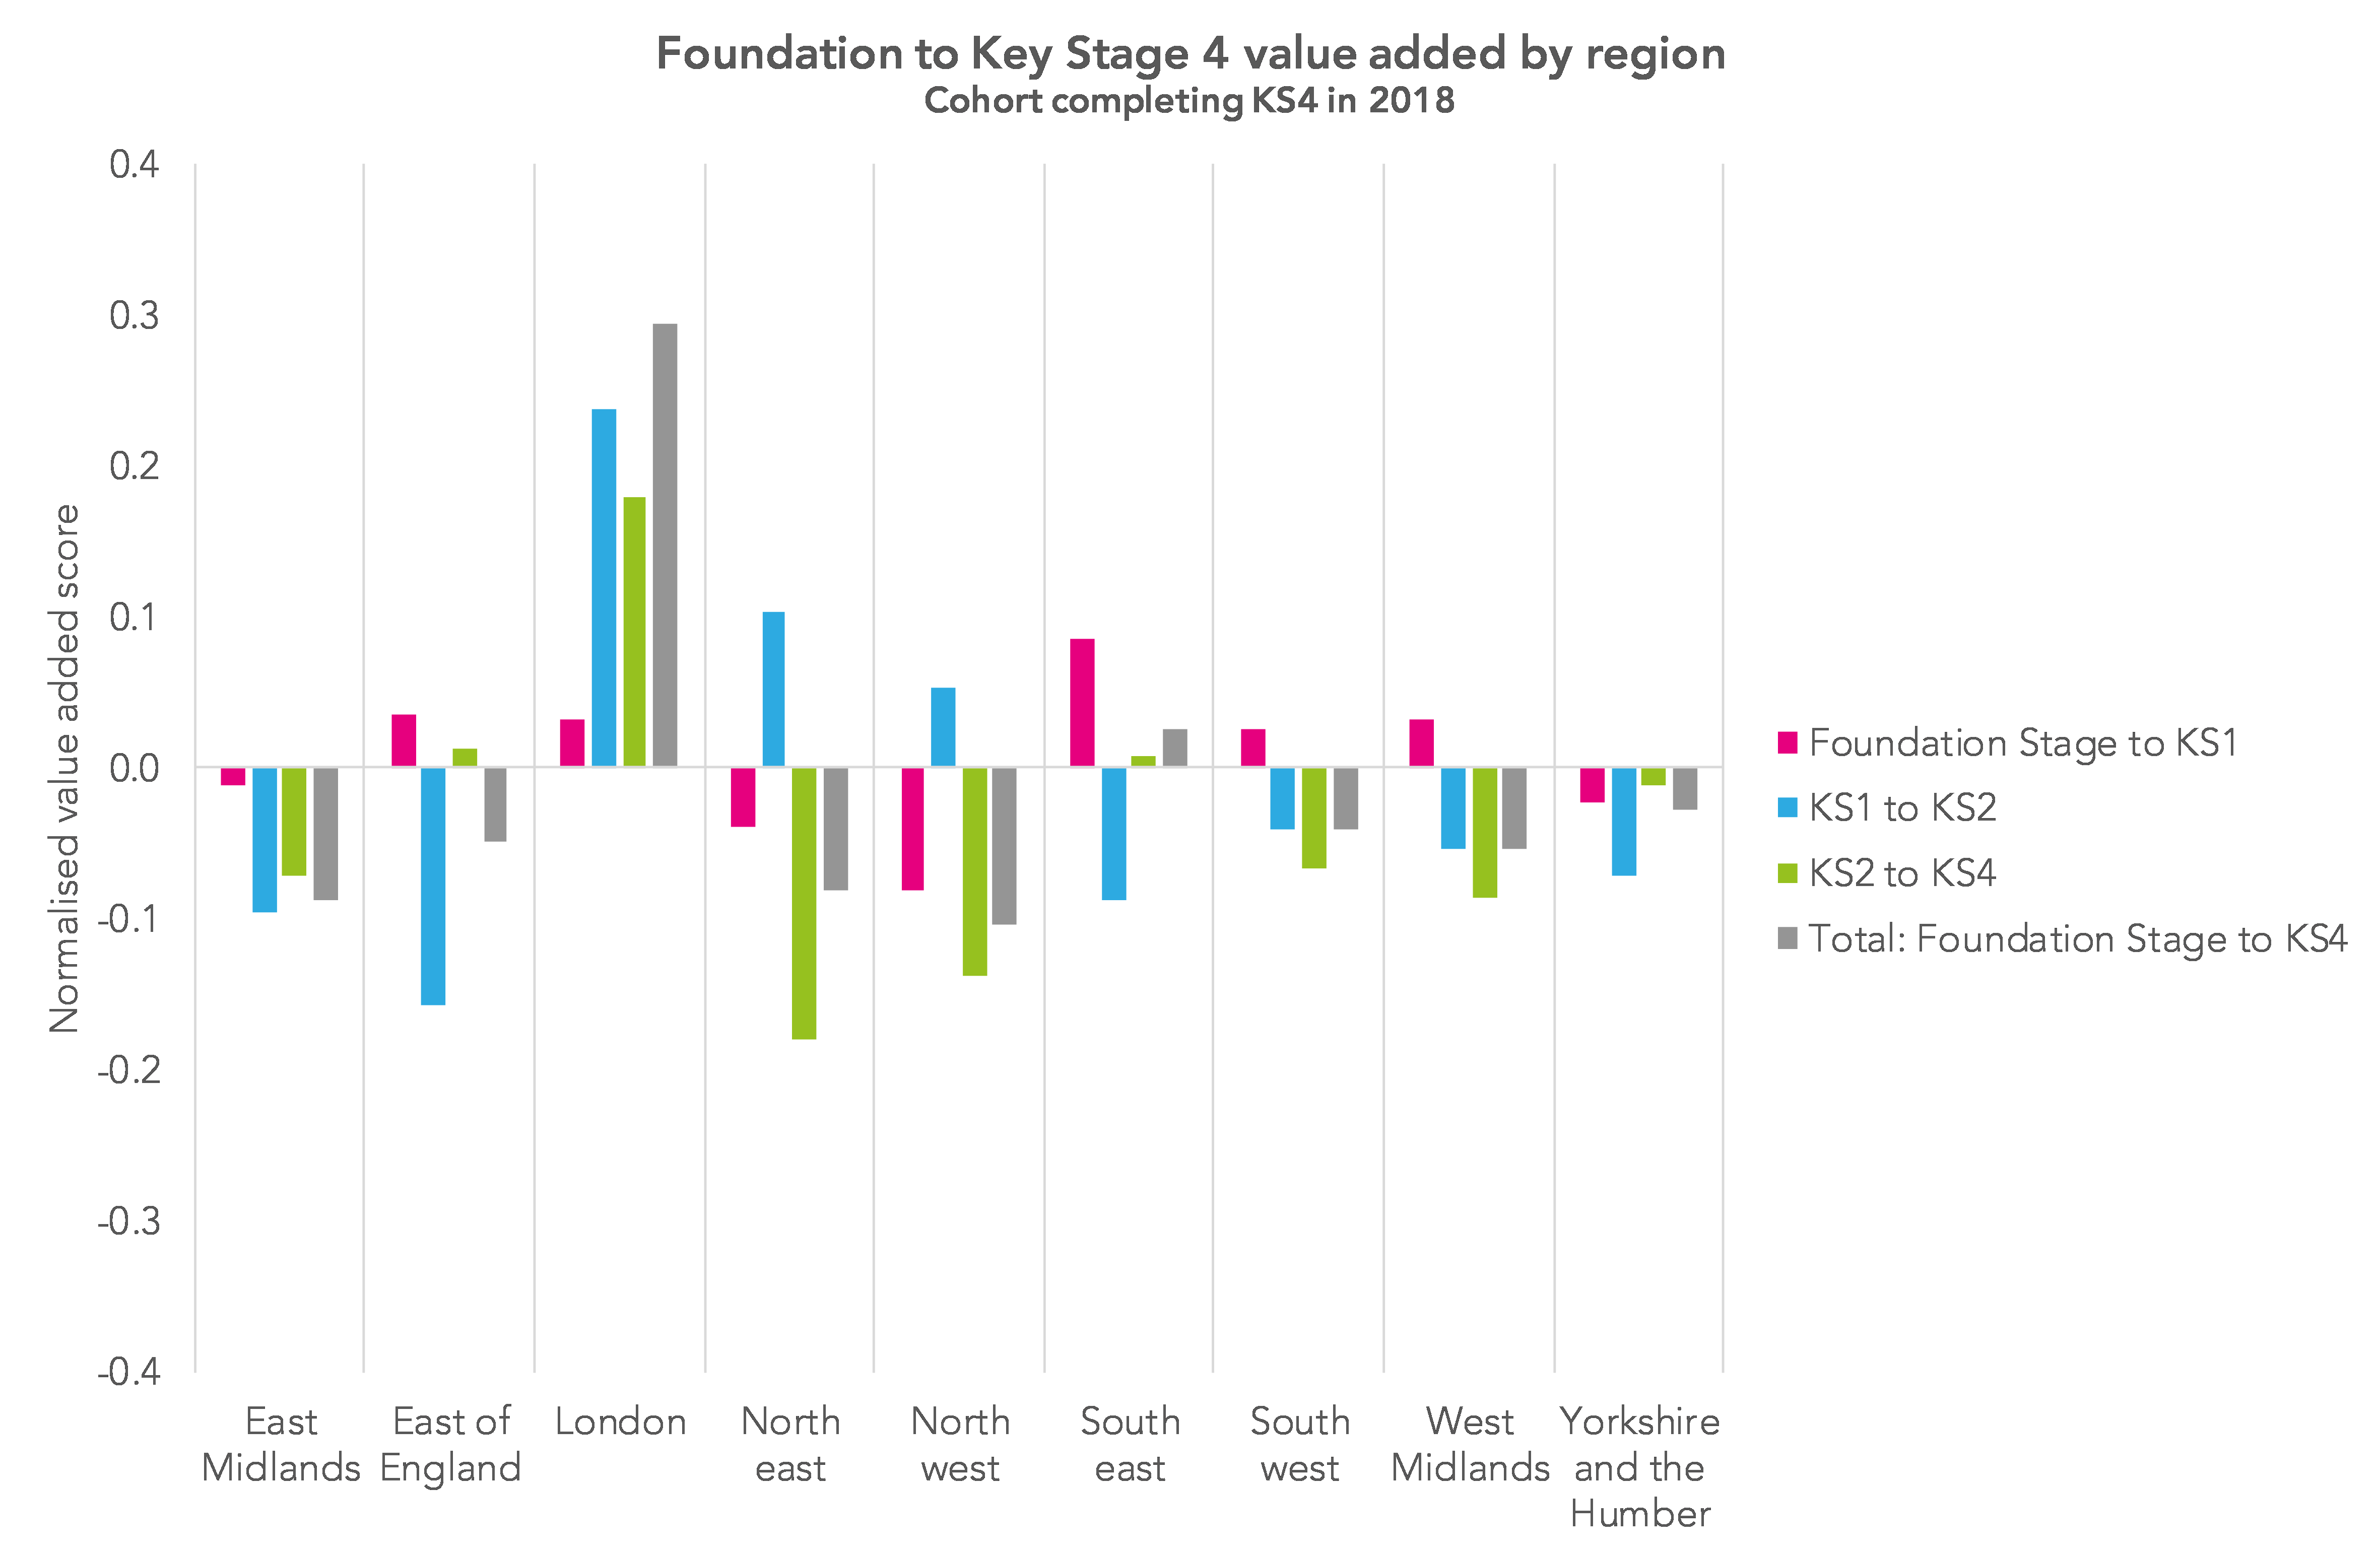
Apart from Foundation Stage to KS1, value added for London is much higher than for other regions. Other studies (including some of our own) have shown that a significant part of the London effect can be accounted for by pupil characteristics.
Another interesting pattern is for the north east (which we’ve also looked at previously) and, to a lesser extent, the north west, where value added is higher for KS1 to KS2 but lower for KS2 to KS4 when compared to other regions (excluding London).
Have things changed for younger pupils?
The analysis above is based on pupils who reached the end of KS4 in 2018. This means that their value added for Foundation Stage to KS1 is based on pupils who were at the end of Foundation Stage in 2007 and KS1 in 2009.
The tables below show, for different Key Stages, how value added scores have varied over the last 10 years and the change over this period (calculated as the difference between the average of the first three years and the last three years). Value added scores greater than +0.1 are highlighted blue; value added scores below -0.1 are highlighted pink.
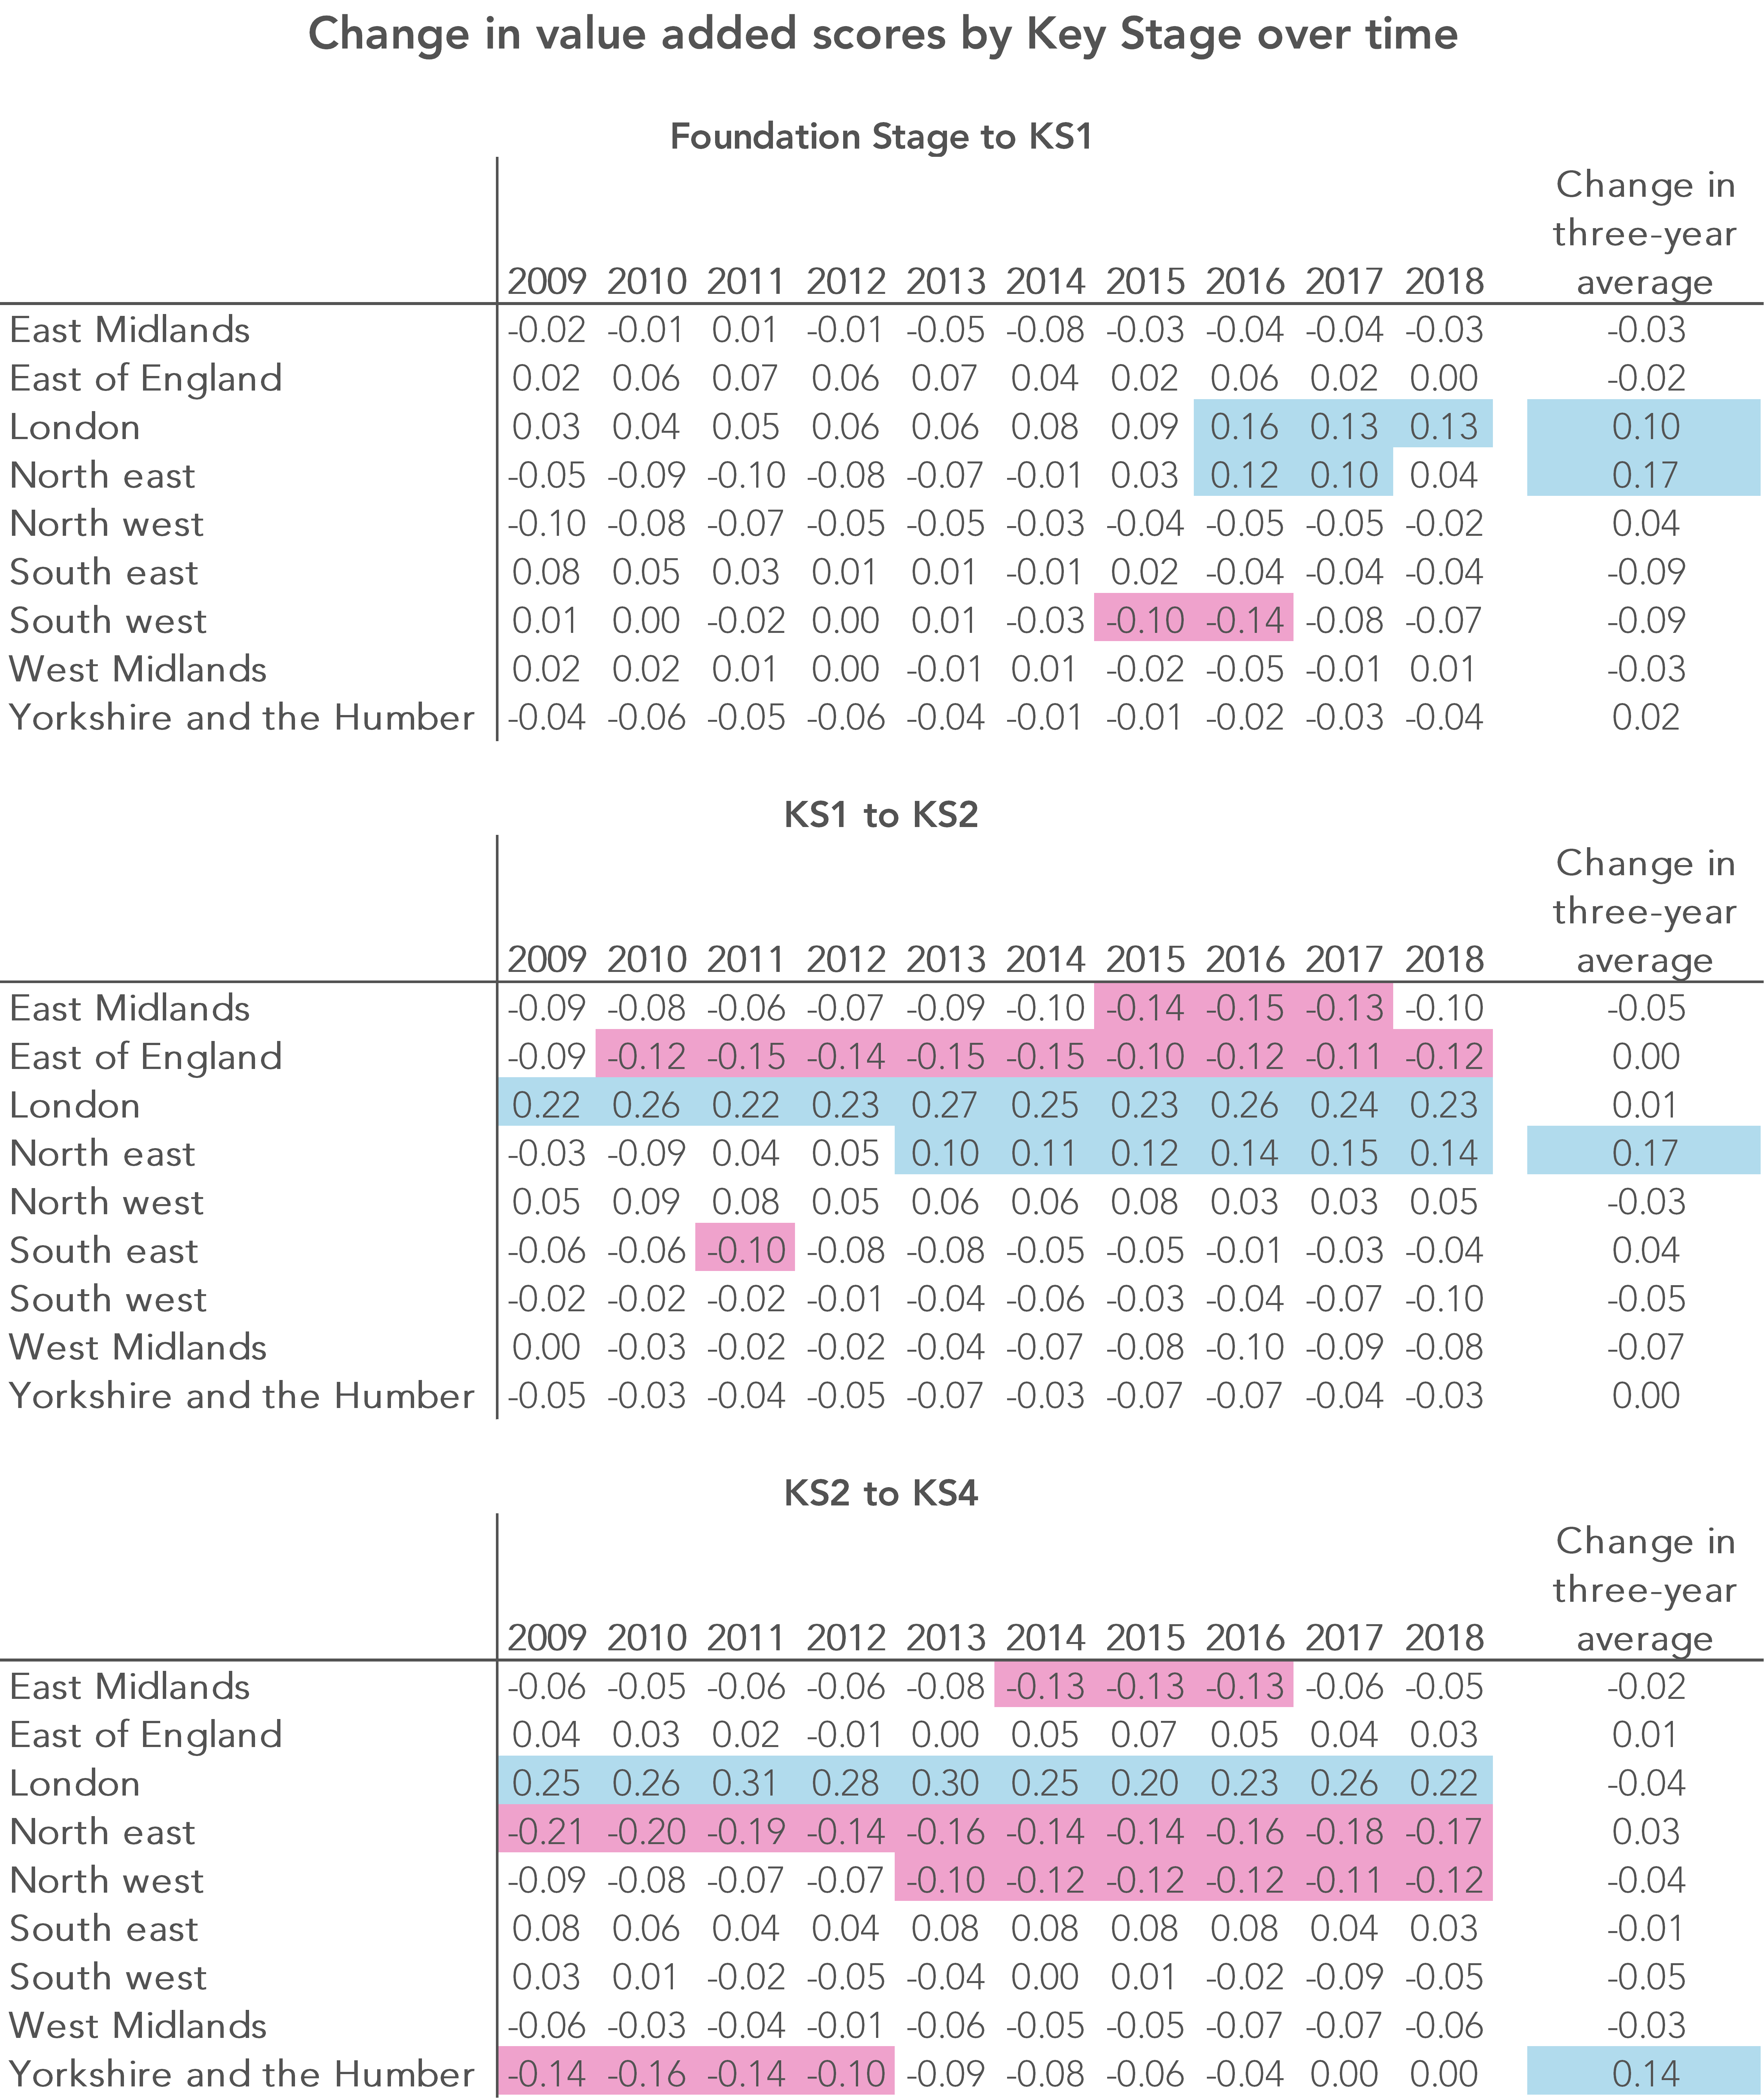
For most regions, value added scores have been fairly stable over the last ten years. Areas where there has been a substantial change are London and the north east at KS1; the north east at KS2 and Yorkshire and the Humber at KS4.
How have things changed for the long-term disadvantaged?
The above analysis does not take account of differences between regions in the characteristics of their pupils and schools, other than prior attainment.
But we know, from other studies, that pupils from most minority ethnic groups make above average progress, as do pupils with English as an additional language. Progress also varies according to the percentage of time in school that pupils have been eligible for free school meals – but that this itself varies by ethnicity.
So, let’s look at regional differences for pupils who, at national level, make the lowest progress. This group comprises pupils who are long-term disadvantaged – known to be FSM-eligible for 80% or more of their time in schools – and are in a high impact group, for whom disadvantage has the greatest impact (mostly white British pupils).
The chart below shows value added averaged over the last three years (2016 to 2018) for high impact, long-term disadvantaged pupils. As expected, value added scores for this group are much lower than those seen earlier for all pupils across all regions.
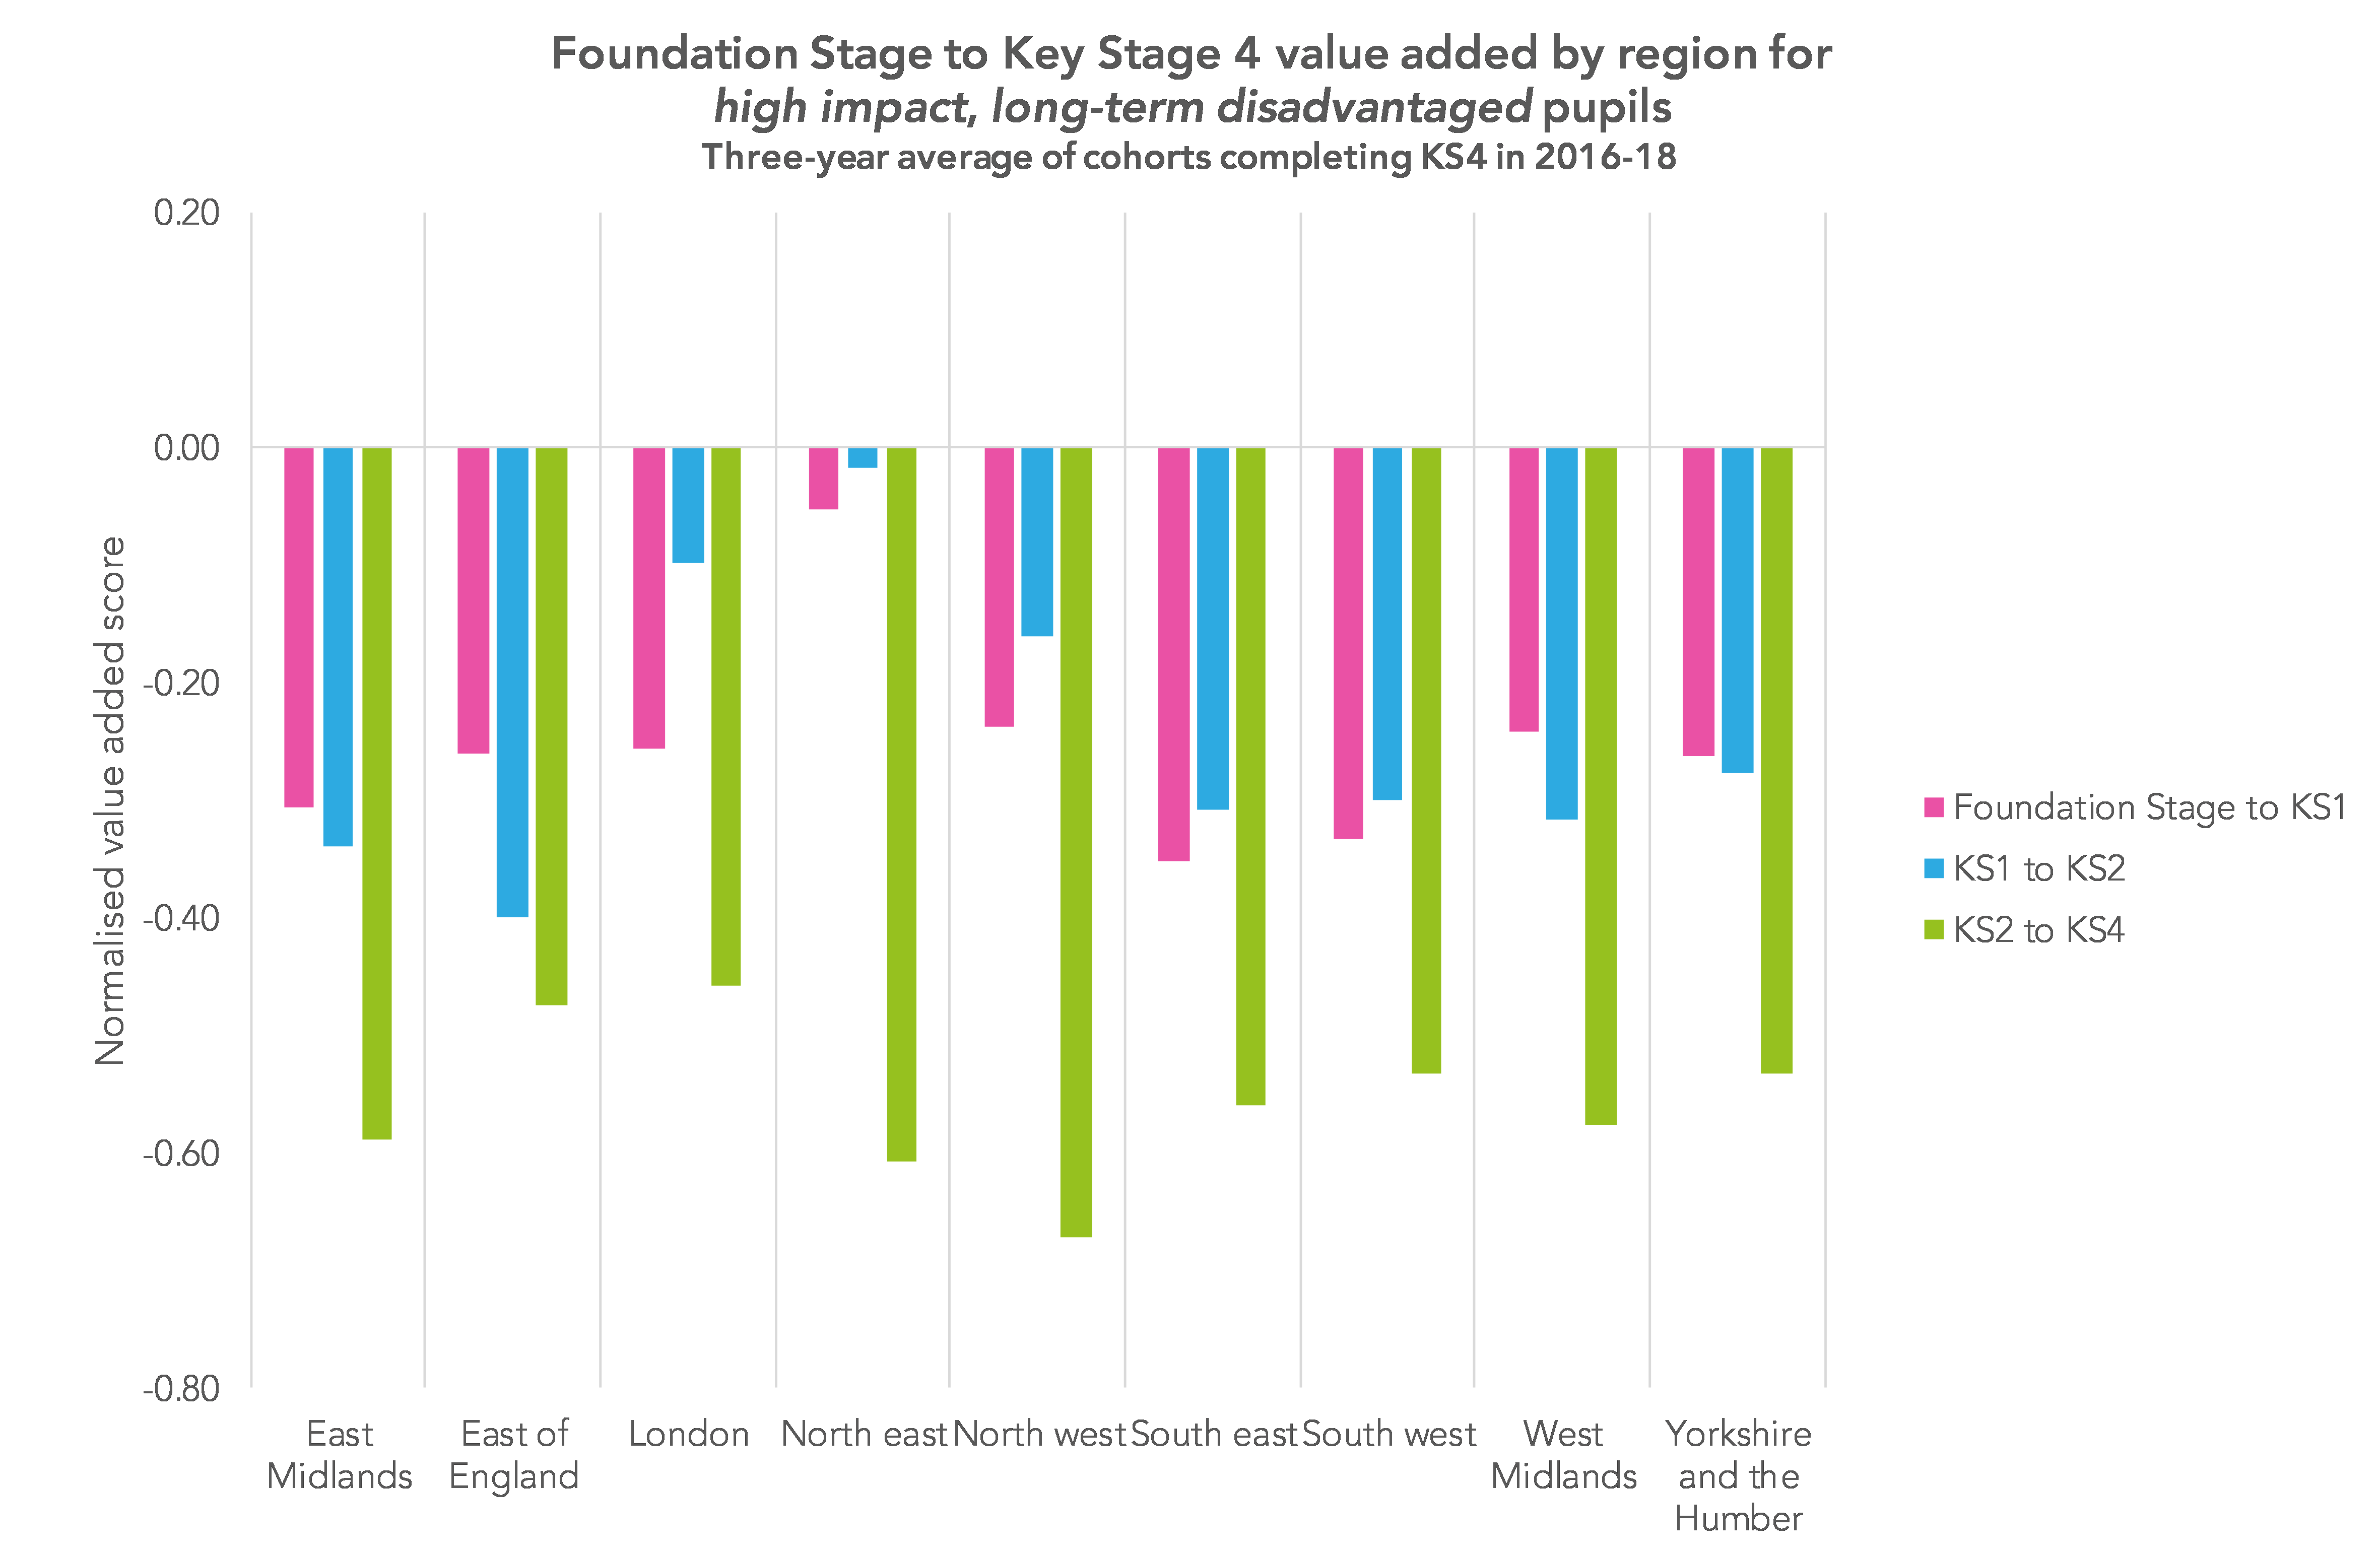
As before, value added for London at KS2 and the north east at KS1 and KS2 is better than for other regions – with the north east now having the best value added score at both KS1 and KS2. At KS4 London is slightly better than other regions but the differences are much smaller than those seen earlier.
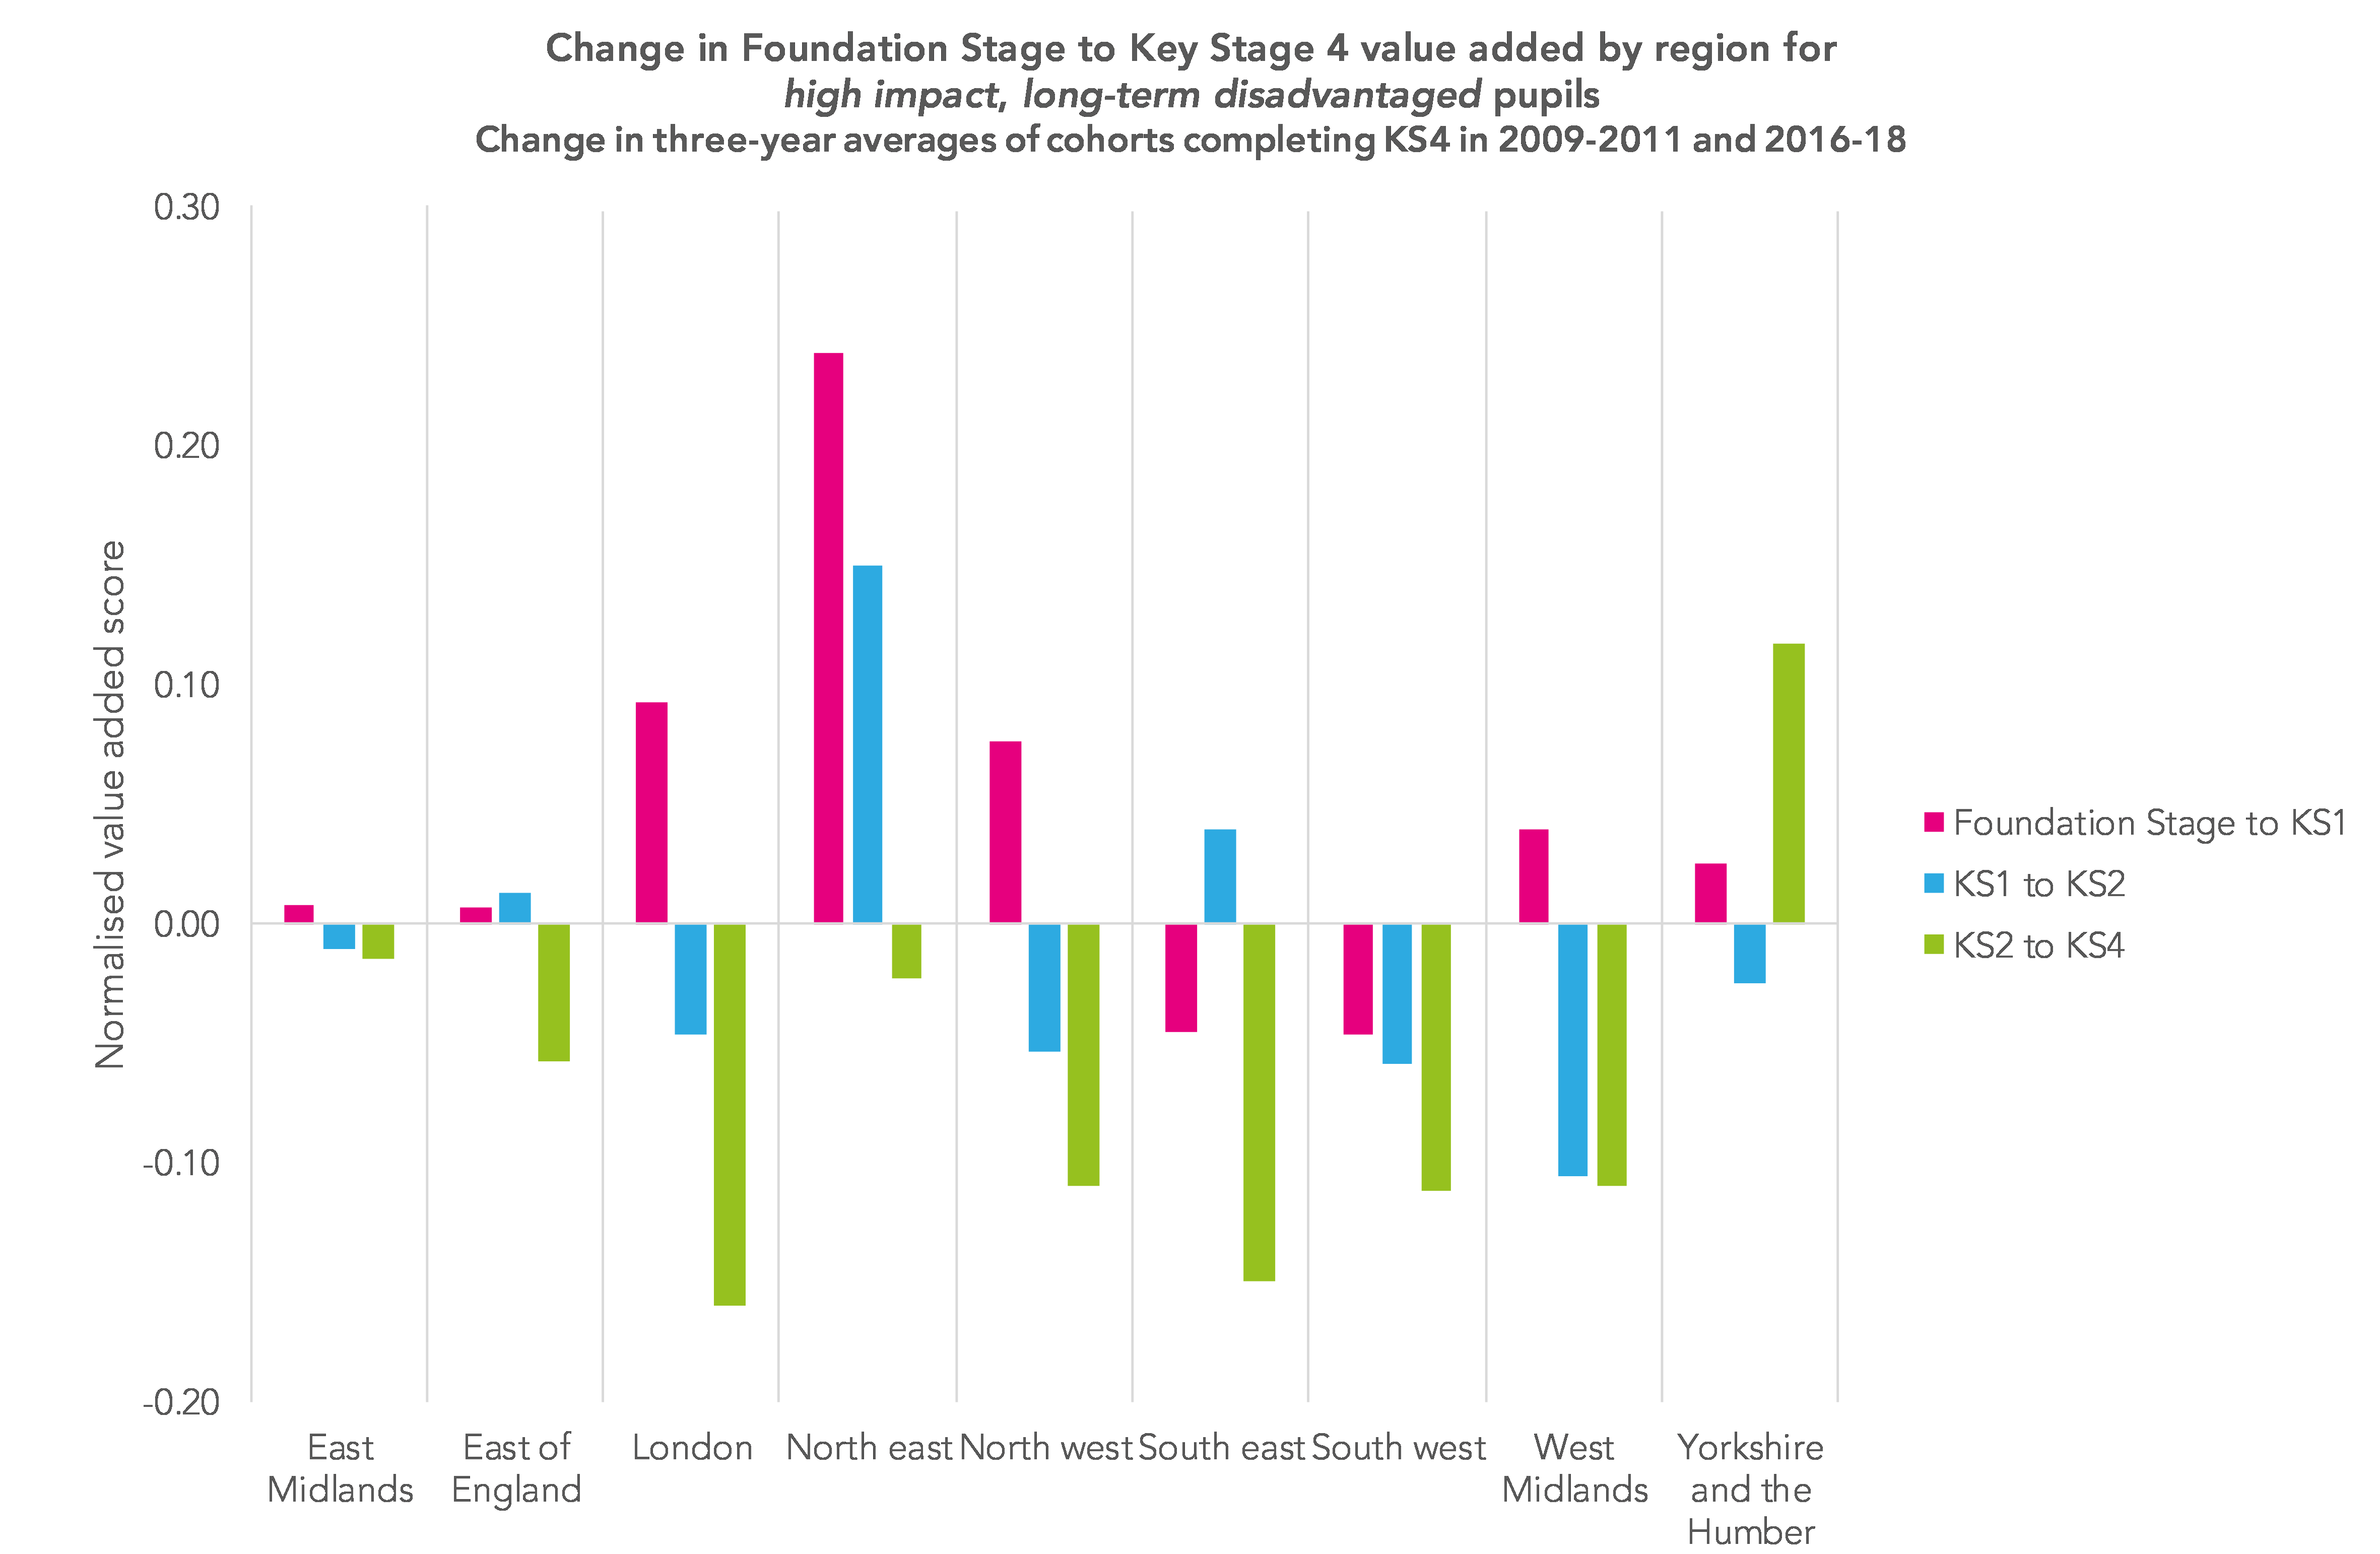
The chart below shows the change in value added scores over ten years, comparing the three-year period 2009 to 2011 to the three-year period 2016 to 2018. During this time, there was substantial change in the types of qualifications schools offered at KS4.
What does this show?
We can see a similar pattern to that seen earlier, with the north east showing improvement at both KS1 and KS2, London showing improvement at KS1, and Yorkshire and the Humber at KS4. However, at KS4, progress for this group of pupils shows a substantial drop in five regions, including London.
Finally, let’s revisit the contribution made to attainment differences at KS4 by initial (Foundation Stage) attainment and subsequent progress through each Key Stage for long-term disadvantaged pupils in the group most impacted by disadvantage.
There are four regions where there is substantial variation from the overall England average – shown on the chart below. This shows where attainment gaps at the end of Key Stage 4 arise.

So in London, a bigger part of the gap is explained by the level of attainment at the end of Foundation Stage than is the case in other areas. Meanwhile, in the north east and north west the greatest part of the gap arises between the end of KS2 and KS4 – with very little of the gap arising during KS2. In the east of England, more of the gap arises during KS2 than is the case in other regions.
Summing up
In summary, when we look at all pupils:
- at both KS1 and KS2, pupils in London and the north east show above average progress;
- both of these regions show improvement in pupil progress over the past ten years at KS1;
- at KS2, the north east has improved and London has been consistently above average;
- at KS4, value added for pupils in Yorkshire and the Humber has shown substantial improvement.
When we look at long-term disadvantaged pupils in the (mainly white British) group impacted the most by disadvantage:
- at KS1 and KS2, the north east again shows substantial improvement, with value added at KS2 now very close for these pupils to the national average for all pupils;
- London shows improvement at KS1 but, overall, progress for this group of pupils in London is much closer to other regions than was the case for all pupils;
- data for KS4 shows that, apart from Yorkshire and the Humber, value added for this group of pupils is declining. This means that they are falling further behind the national average.
This all leads to two questions.
What is happening in the north east at KS1 and KS2 – and why does so much of the progress gap for long-term disadvantaged pupils in this region arise between the end of KS2 and the end of KS4?
And can we arrest the decline in progress at KS4 for the white British pupils who are long-term disadvantaged?
Want to stay up-to-date with the latest research from FFT Education Datalab? Sign up to Datalab’s mailing list to get notifications about new blogposts, or to receive the team’s half-termly newsletter.


What is happening in the North East at KS2 level? endemic cheating and hugely narrowing the curriculum.
I look after Data for a secondary school in the North east (we do rather well, with positive P8 scores despite fairly high levels of deprivation). Out of our 3 main feeder schools, one was caught with it’s fingers in the till about 5 years ago (head departed, DfE scrubbed the SATS and used the Teacher Assessments written by the same staff who presumably knew they were going to tell the kids the answers). Another has been giving us “unusual” KS2 results for the past 3 years – when I look at the yearly intake as a whole (averaging 160 students), students from that school increase their average ranking within the cohort by 59 places from KS1 to KS2, yet when given baseline tests in the first half term of Y7 strangely their ranking decreases by 61 places from KS2, with the effect especially pronounced for students with SEN (most likely to have readers/scribes and do their tests away from the main hall). A third feeder school had their maths results nullified last year for maladministration. This ties in with anecdotal evidence of large quantities of readers and scribes, teachers hinting about incorrect answers etc. and the TeacherTapp data showing that a third of Primary School teachers had been asked to cheat.
My feeling is that cheating/maladministration (or bending the rules/pushing the boundaries) within SATS is pervasive and widespread, and has become culturally acceptable within primary schools. Once all the other schools begin cheating, or are perceived to be doing things which give an advantage, there is a feeling that any school which does not will be penalised as their students will score relatively lower as grade boundaries shift.
I remember the bad days of GCSE coursework – Heads of Departments and SLT telling us that it was not acceptable for a student to hand in coursework unless it was one grade above their target (which was usually already a grade above what FFT50 predicted). Coursework, like can do tasks or practical skill scores in Science, became a game, where we all “knew” everyone else was gaming it or pushing the rules past their limits in a way nobody would ever have done with an actual exam, which (thankfully) remained sacrosanct (and the difference in grade boundaries between exam and coursework components rather backs this up) a creeping corruption which continued until it was thankfully abolished – most individual teachers had too much to lose and nothing to gain if they tried to stand up and do what was morally right. In a marketised, league table driven education system is it a surprise that a culture is fostered of doing whatever it takes to produce the grades required?
KS2 SATS at the moment seem to be in a similar place – from my discussions with Primary colleagues it seems they’re devalued as some parts are teacher assessed anyway, devalued by boycotts, little oversight and scrutiny and they are seen primarily as an instrument for school/staff accountability and performance, rather than for the students, so gaming them is seen to have little consequence for the kids. Meanwhile Secondary schools are being told they’re failing as students often cannot achieve the levels they supposedly reached in KS2 for years afterwards, their targets (usually set using FFT, Attainment 8 estimates or otherwise calculated from KS2 scores) end up unattainable and demotivating and professionals at secondary level are being held accountable for the false data provided by primary cheating.