In our last post on the London effect, we showed that Asian students appear to be making more progress in the capital than elsewhere, unlike some other groups, such as white British students.
When we looked at this more closely, we found something rather surprising: the London effect seems to be stronger for students from a Pakistani background than for any other ethnic group.
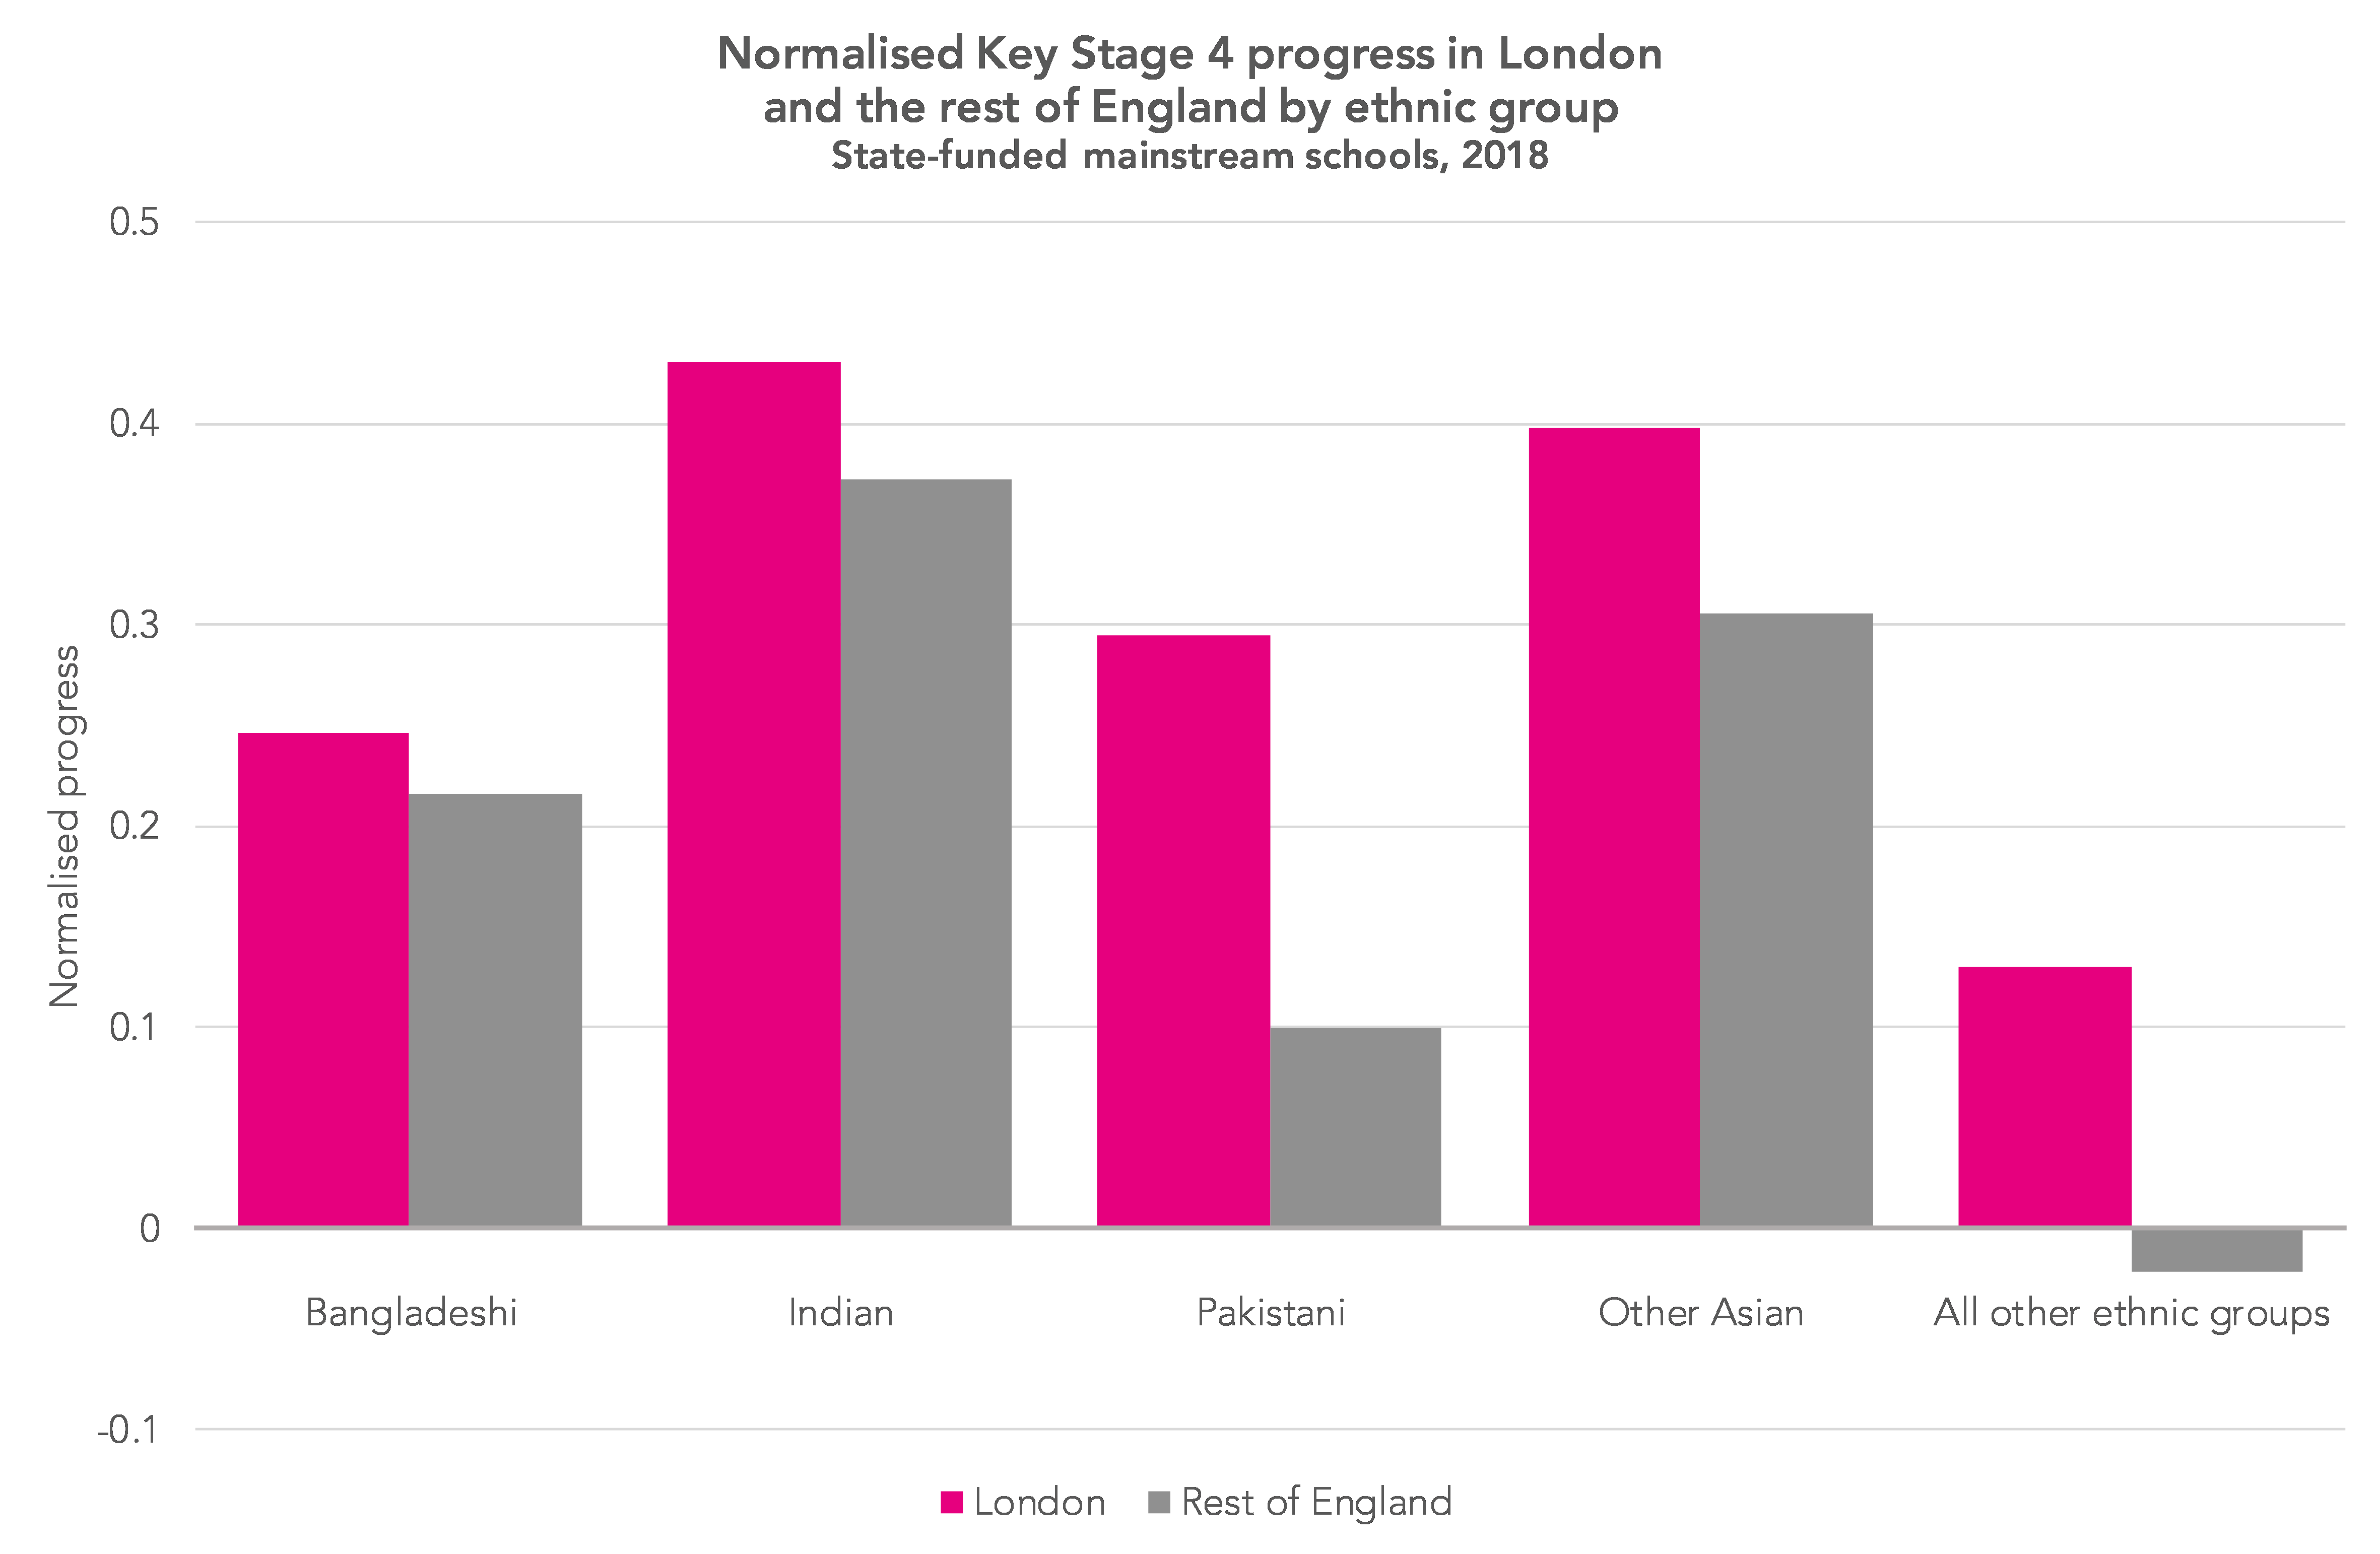
The graph below shows Key Stage 4 progress scores n London and the rest of England for different groups of Asian students, and for all ethnic groups combined. These scores have been normalised – that is, put onto a common scale with an average of 0 and a standard deviation of 1.
For all of these groups, progress in London is higher than in the rest of England, but we can see that this difference is much larger for students from a Pakistani background than it is for any of the other groups shown.
But why?
We speculated that perhaps Pakistani students in the capital tend to have different characteristics to those outside the capital; perhaps they were less likely to be disadvantaged, for example.
If there are more differences between Pakistani students in London and outside London than there are between, say, Indian students in and outside London, that might explain the difference in progress.
The boxplot below shows the range of IDACI rankings for each Asian ethnic group both inside and outside the capital. IDACI is a measure of deprivation with areas given scores between 0 and 1. A score of 1 means that all families living in that area with children under 16 are income deprived; a score of 0 means that none are.
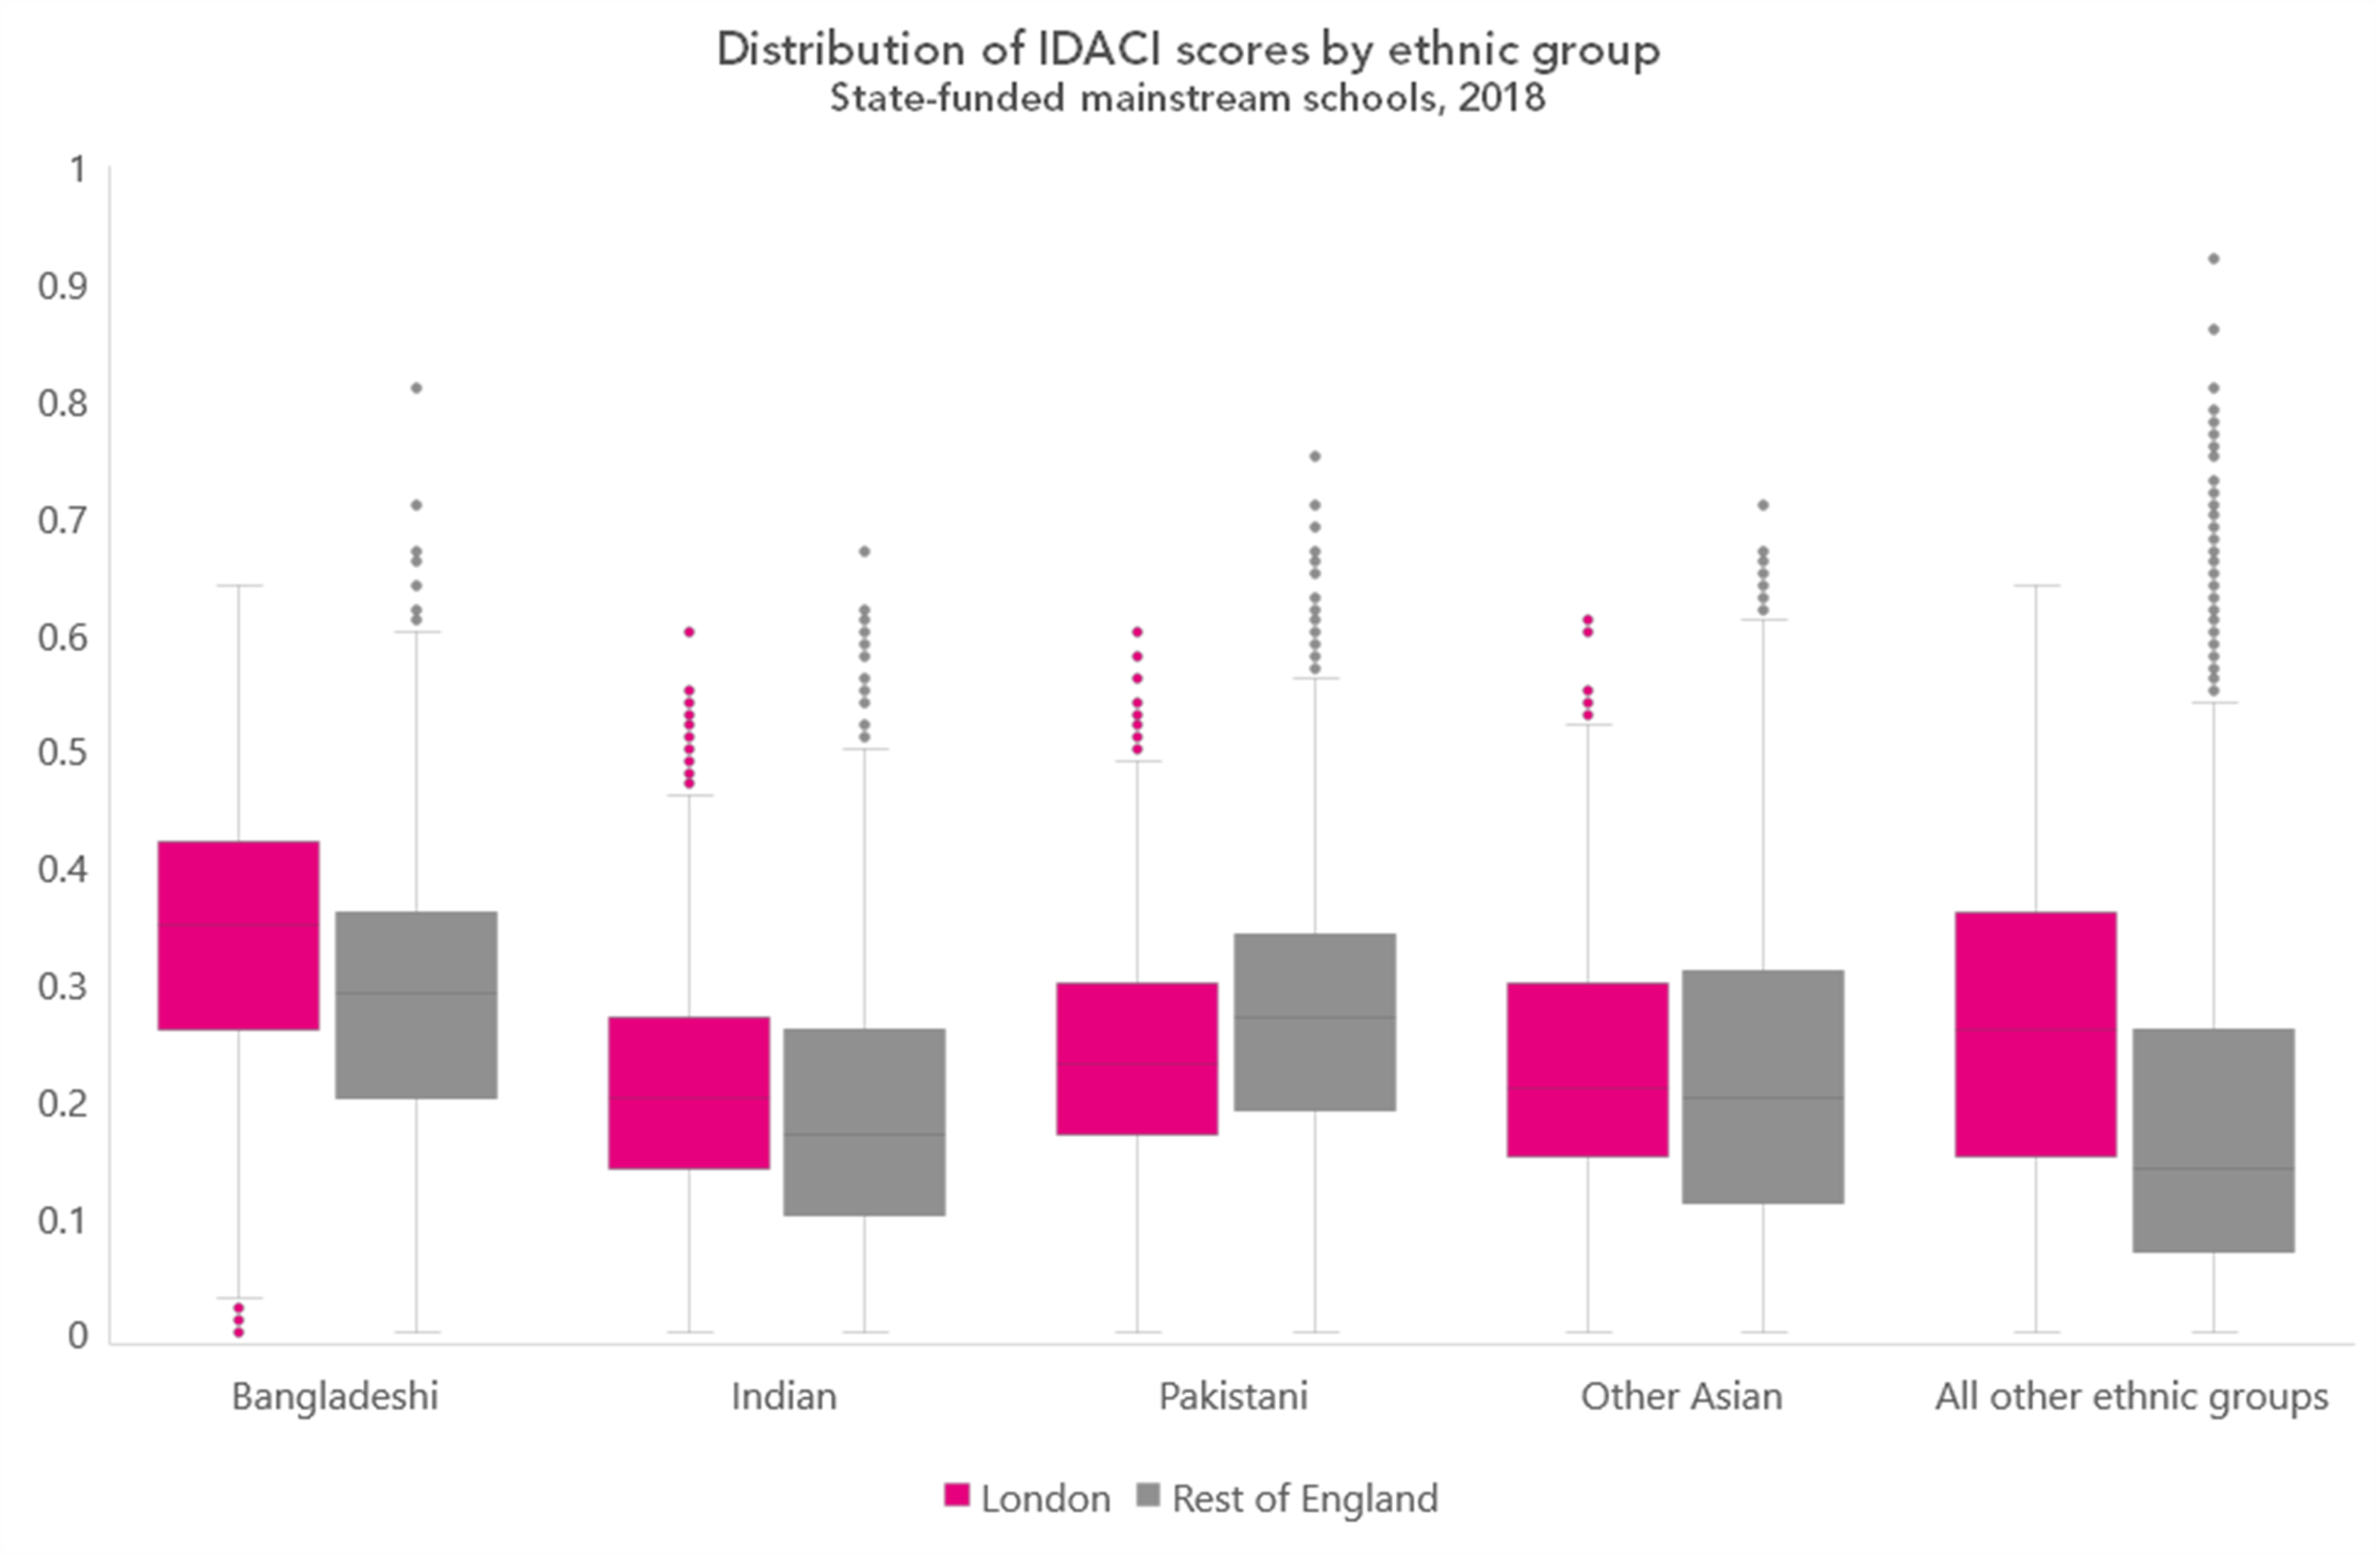
It does suggest that Pakistani students in London tend to live in slightly less deprived areas than those outside – as indicated by the higher IDACI score – whereas the opposite is true for other groups shown.
How to interpret a box plot
The charts used here are box plots, a type of chart which most people are likely to recognise – but the details of which we may not all remember.
The line across the middle of the box is the median – the value which exactly half of results fall below, and the other half fall above. The box itself shows the range between the lower quartile – the value below which exactly a quarter of results fall – and the upper quartile – the value above which exactly a quarter of results fall. This definition means that exactly 50% of results are within the range of values covered by the box.
The difference between the lower quartile and the upper quartile is the inter-quartile range. The whiskers stretching out from the box reach to the maximum and minimum values, excluding outliers, which are shown as dots. Outliers are defined as results more than 1.5 times the inter-quartile range away from either the lower or upper quartile.
But does this explain the difference in relative progress at KS4? The table below shows the estimated London effect on different ethnic groups before and after controlling for disadvantage, as well as other demographic factors.[1] That is, by how much we would expect a student in London to outperform a student elsewhere.

Controlling for demographic factors makes surprisingly little difference: Pakistani students still seem to be more susceptible to the London effect than students from other ethnic groups.
English and maths
In a previous blogpost on the London effect, we argued that looking at progress in English and maths might give a more realistic picture than progress based on overall measures of attainment that combine the results of different qualifications. So far in this post we’ve looked at progress based on an overall measure of attainment; now let’s look at progress in English and maths.
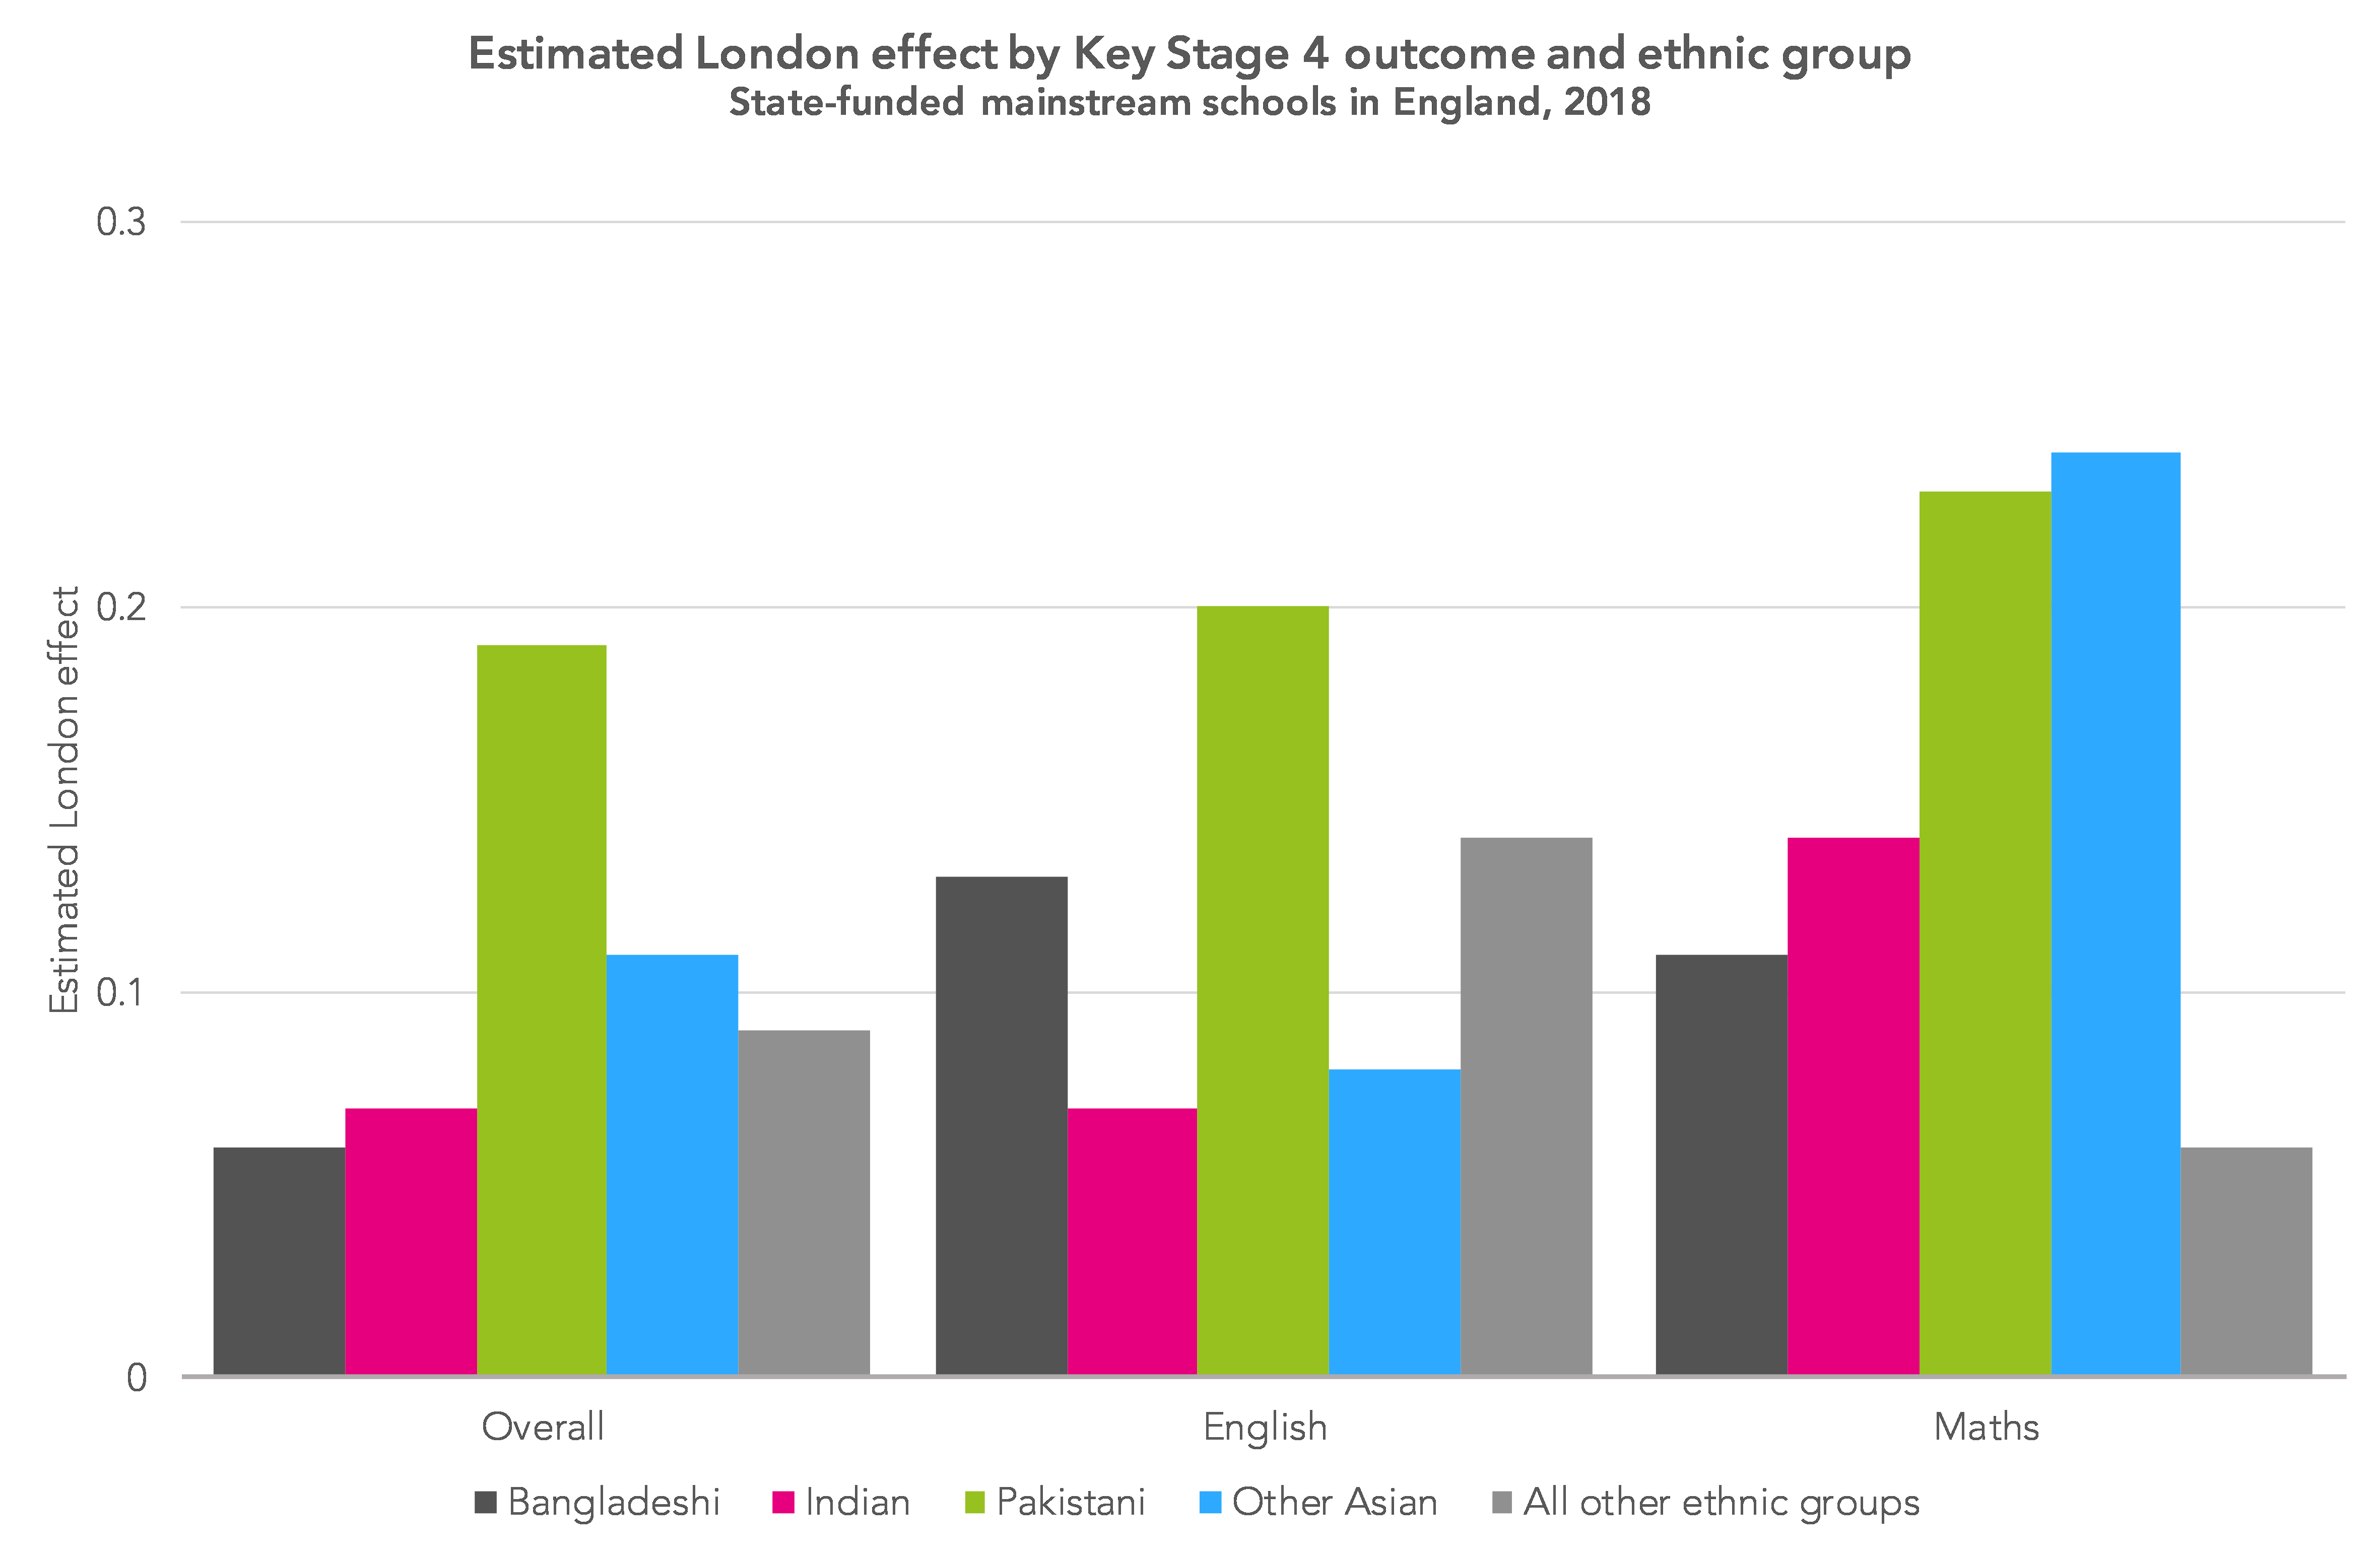
The graph below shows the estimated London effect, after controlling for demographic factors, on overall progress and progress in English and maths. The difference between Pakistani students and other groups is not quite so striking as when we look at overall progress, but we see a strong London effect on maths progress for both Pakistani students and students from other Asian backgrounds.
Is immigration the answer?
One possible cause might be that these groups contain more recent immigrants[2] than others. As Simon Burgess argued in his well-known paper on the London effect, it is difficult to disentangle the effects of recent immigration, ethnicity and speaking English as an additional language, but all three tend to be associated with higher levels of progress.
In particular, students who are relatively new to the English education system when they undertake assessments at Key Stage 2 will tend to achieve relatively low results, but by Key Stage 4 will tend to have caught up with their peers as they develop proficiency in English.
It’s difficult to control for this: we aren’t able to identify students’ immigration status from the data available (probably a good thing) and collection of proficiency-in-English data has been abandoned.
However, we can try to minimise the effect of accelerated progress for students who have recently joined the English education system by repeating our analysis, omitting any students for whom there is no data available on attainment at the end of the Foundation Stage. Effectively this assumes that these students were not in school in England at that time.
The graph below shows the results of this analysis.
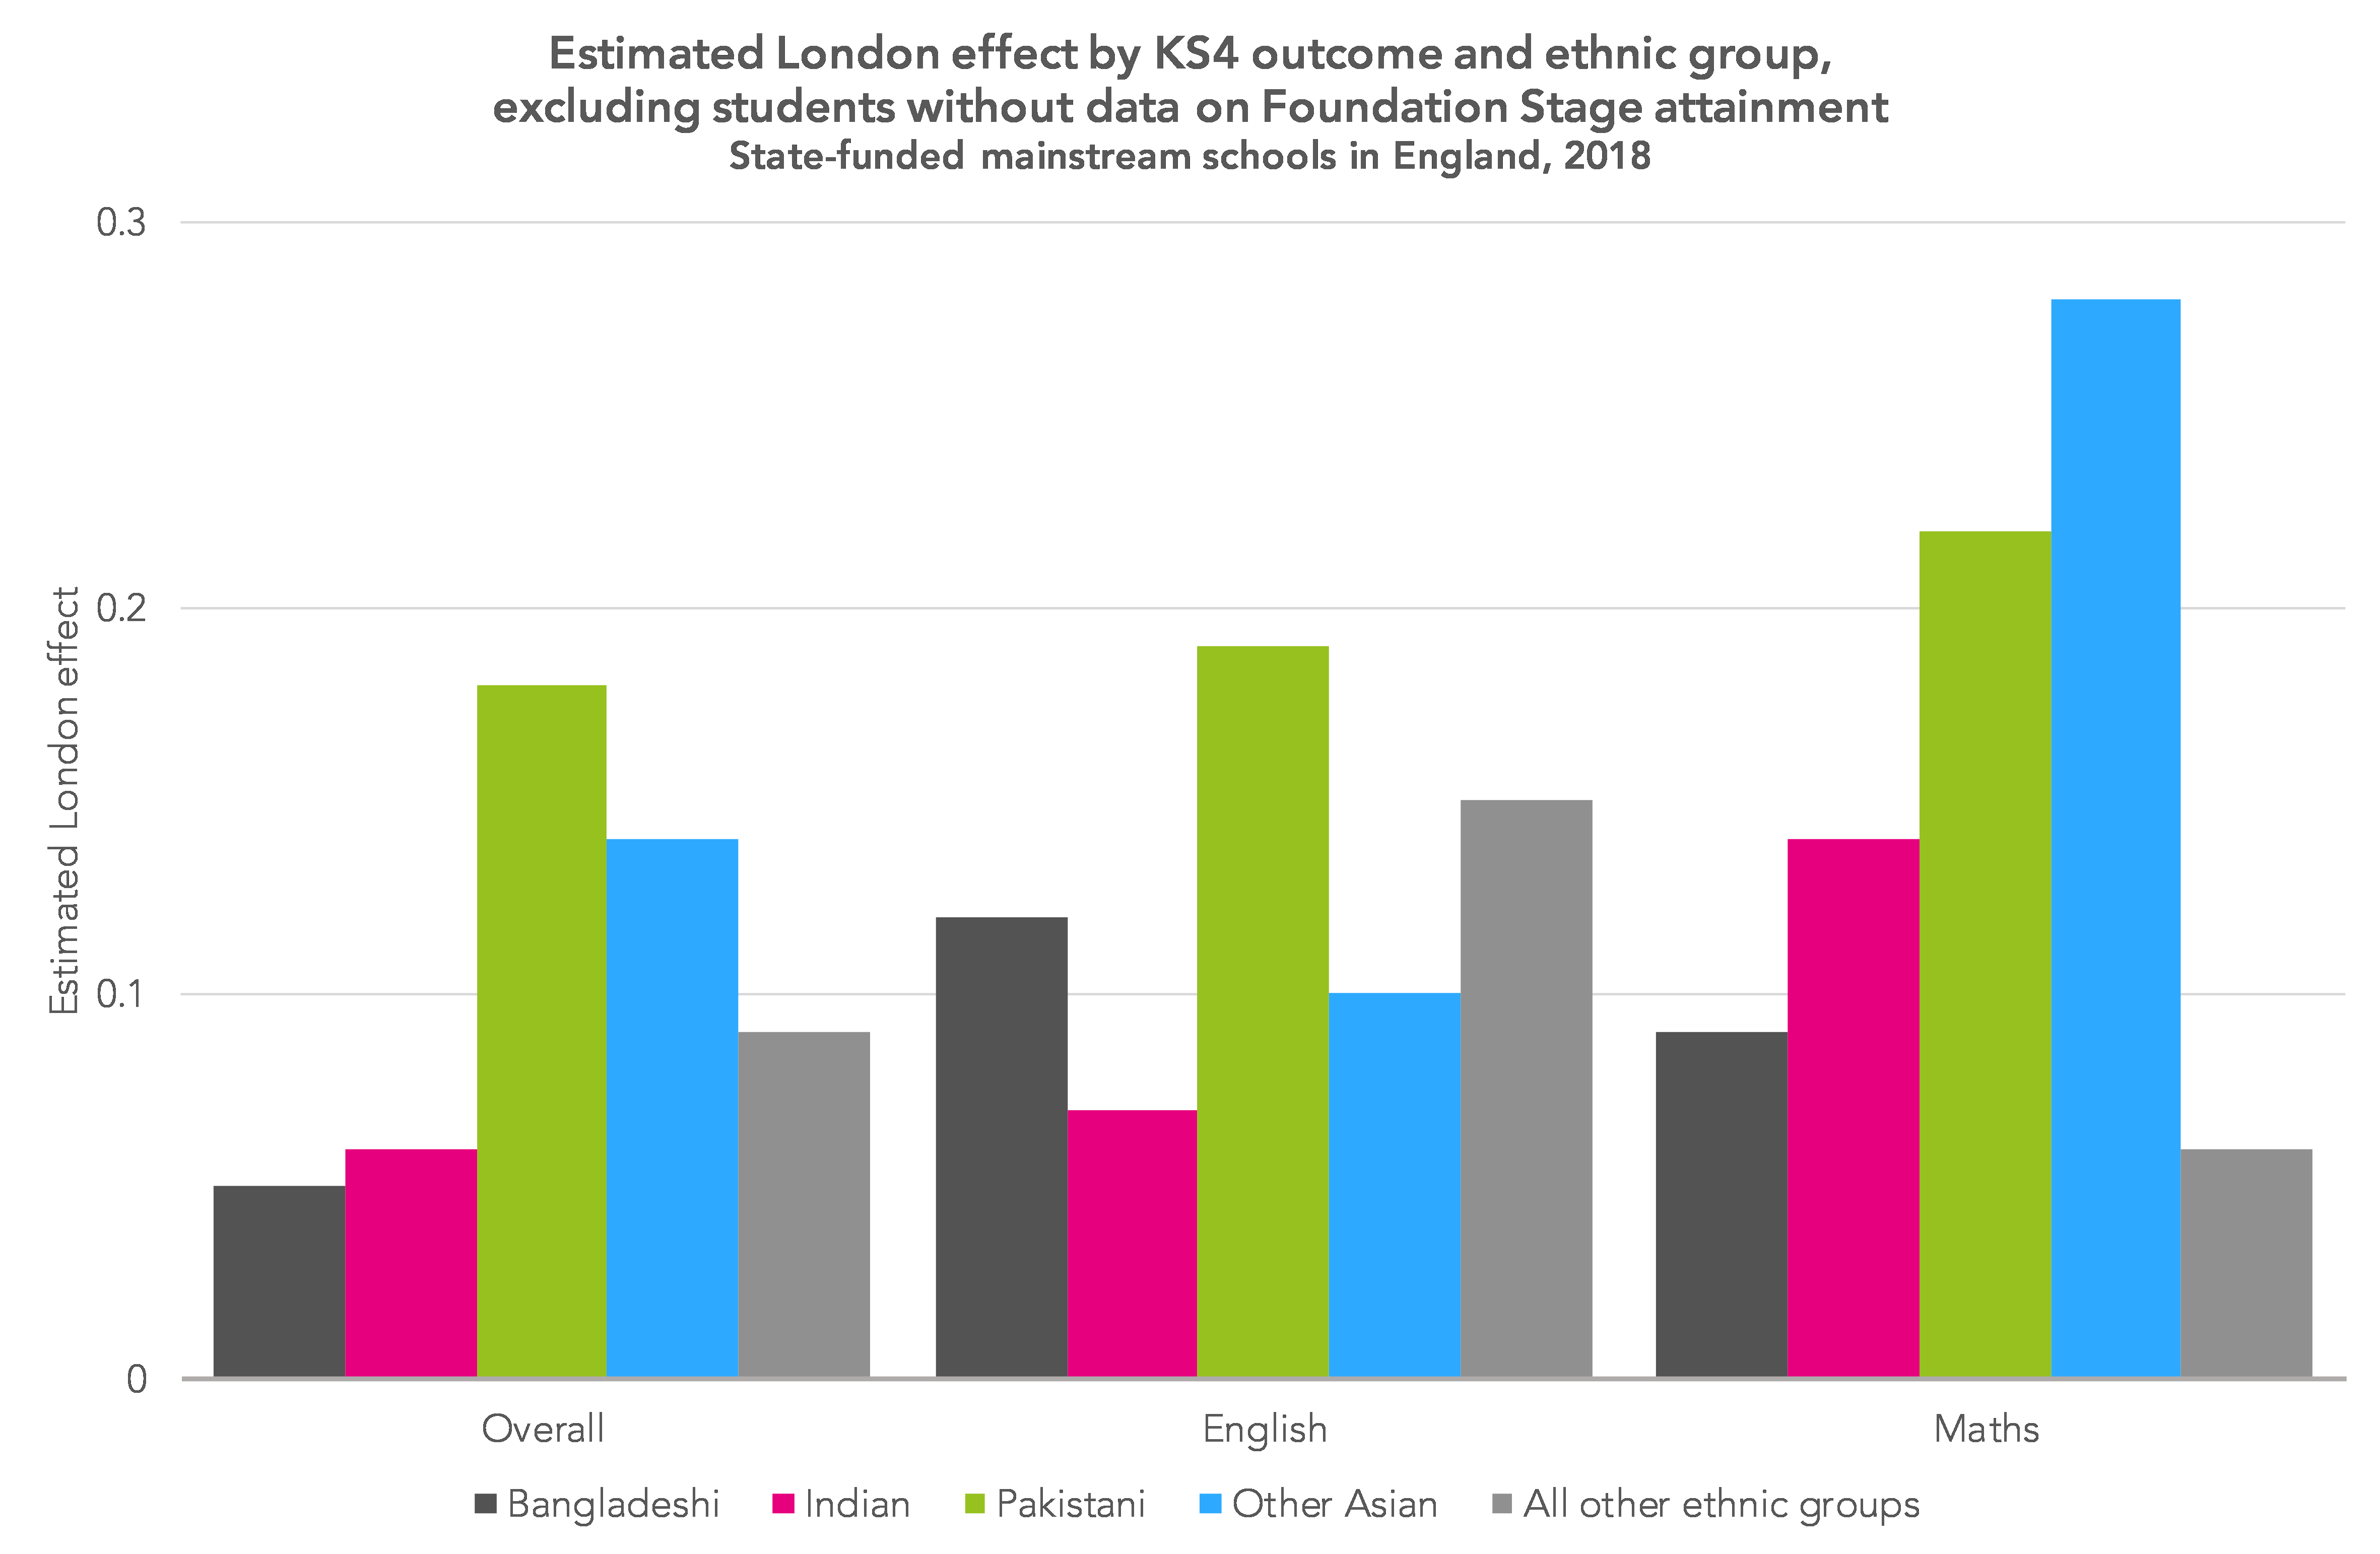
Comparing to the graph above, we can see that while omitting these students reduces the London effect for some groups, it increases the effect for others, notably for the other Asian group in maths progress. However, we continue to see an extra-strong London effect for Pakistani students.
So despite our best efforts to explain why Pakistani students are so susceptible to the London effect, we still haven’t found a conclusive answer.
Want to stay up-to-date with the latest research from FFT Education Datalab? Sign up to Datalab’s mailing list to get notifications about new blogposts, or to receive the team’s half-termly newsletter.
1. We controlled for gender, month of birth, level of deprivation (defined by both proportion of years in school when a student was eligible for free school meals, and IDACI), whether a students has English as an additional language (EAL), school level of EAL, and interactions between level of deprivation, EAL and gender.
2. Here, we define an immigrant as someone who was born abroad.


Leave A Comment