Today we’re publishing some research that we started what feels like a lifetime ago and in a different world.
At the end of probably the worst year and the worst term in modern school history, a detailed, technical discussion of school accountability is likely as appetising as a cold sprout in January. But hey, we press on; feel free to bookmark and read this in those ‘quiet’ moments between presents and dinner.
There are some important points to make, nonetheless, both big picture, and detail. At the big picture end, our results confirm that accountability measures are an effective policy tool. They do not impinge directly on schools’ operational autonomy, unlike explicit ministerial directives, but they do adjust the incentive structure that schools face.
This research shows that this can be effective in changing behaviour. In this particular case, the adjustment reduces educational inequality.
Turning to the detailed impact of the specific measure we have looked at: in 2015/16, the Department for Education introduced Progress 8 as a headline measure of secondary school accountability. This had two new features, one that affects school choice and school admissions (which we do not study here) and one that affects schools’ decisions about the pupils they teach.
What did we set out to do?
Up until the introduction of Progress 8, the headline KS4 accountability figure was a threshold measure: the percentage of pupils achieving five or more GCSEs at grades A*-C including English and maths.
This meant that the performance of the pupils who were marginal for hitting this target was disproportionately important for schools, and that they were thereby implicitly incentivised to focus resources on them to get as many as possible over the hurdle.
Progress 8 is different: it is a simple average of the progress of all the pupils in the year group. The work of all pupils is “worth” the same to the school.
We set out to understand whether this would encourage schools to work more ‘equitably’. By this, we mean whether we could find evidence of schools focusing their efforts less on pupils at the C/D borderline (as it was in those days) and instead spreading their effort more evenly across the full range of attainment.
We have tried to answer this question by analysing how attainment changed for such borderline pupils relative to other pupils after the introduction of Progress 8.
Methodological challenges
Doing so was not without its challenges.
Firstly, we did not know with any certainty who the borderline pupils within each school were. The best we could do is create a proxy group based on attainment at Key Stage 2. We defined the borderline group as pupils with a 40-60% probability of achieving grade C or above (later grade 4 or above) in English and mathematics in each year. We then defined two other groups: those with a higher than 60% probability and those with a lower than 40% probability.
Secondly, we needed a consistent measure of attainment over time. However, Progress 8 was just one of a series of changes to secondary school accountability introduced since 2010 that substantially affected the types of qualifications taken in schools and the measures of performance that were calculated. We therefore restricted ourselves to grades achieved in GCSE English language and maths.
Thirdly, attempts to analyse changes in attainment over time are at the mercy of efforts to maintain standards. Since 2012, the exams regulator Ofqual has used an approach known as ‘comparable outcomes’. All things being equal, based on information on prior performance, the proportion of students who obtained certain grades in any given year should be the same as the proportion who achieved the previous year. We therefore standardised the GCSE English language and maths results – that is, put them on a common scale across all of the years we looked at.[1]
Results
For our main results we looked at the period 2012 to 2017. The first of these was the year comparable outcomes was (officially) applied to GCSE English and maths results, while 2017 was the latest year of data available to us for the project.
Progress 8 was introduced for the 2016 academic year but had been announced in October 2013 to give schools sufficient time to plan for its introduction.[2] We thought we might see schools begin to anticipate its introduction.
We have set out our methodology in more detail in the report but, briefly, we analysed the change in standardised scores in English and maths for pupils in the above-borderline and below-borderline groups relative to the borderline group. We did this both before and after the introduction of Progress 8. Results are summarised in the chart below.
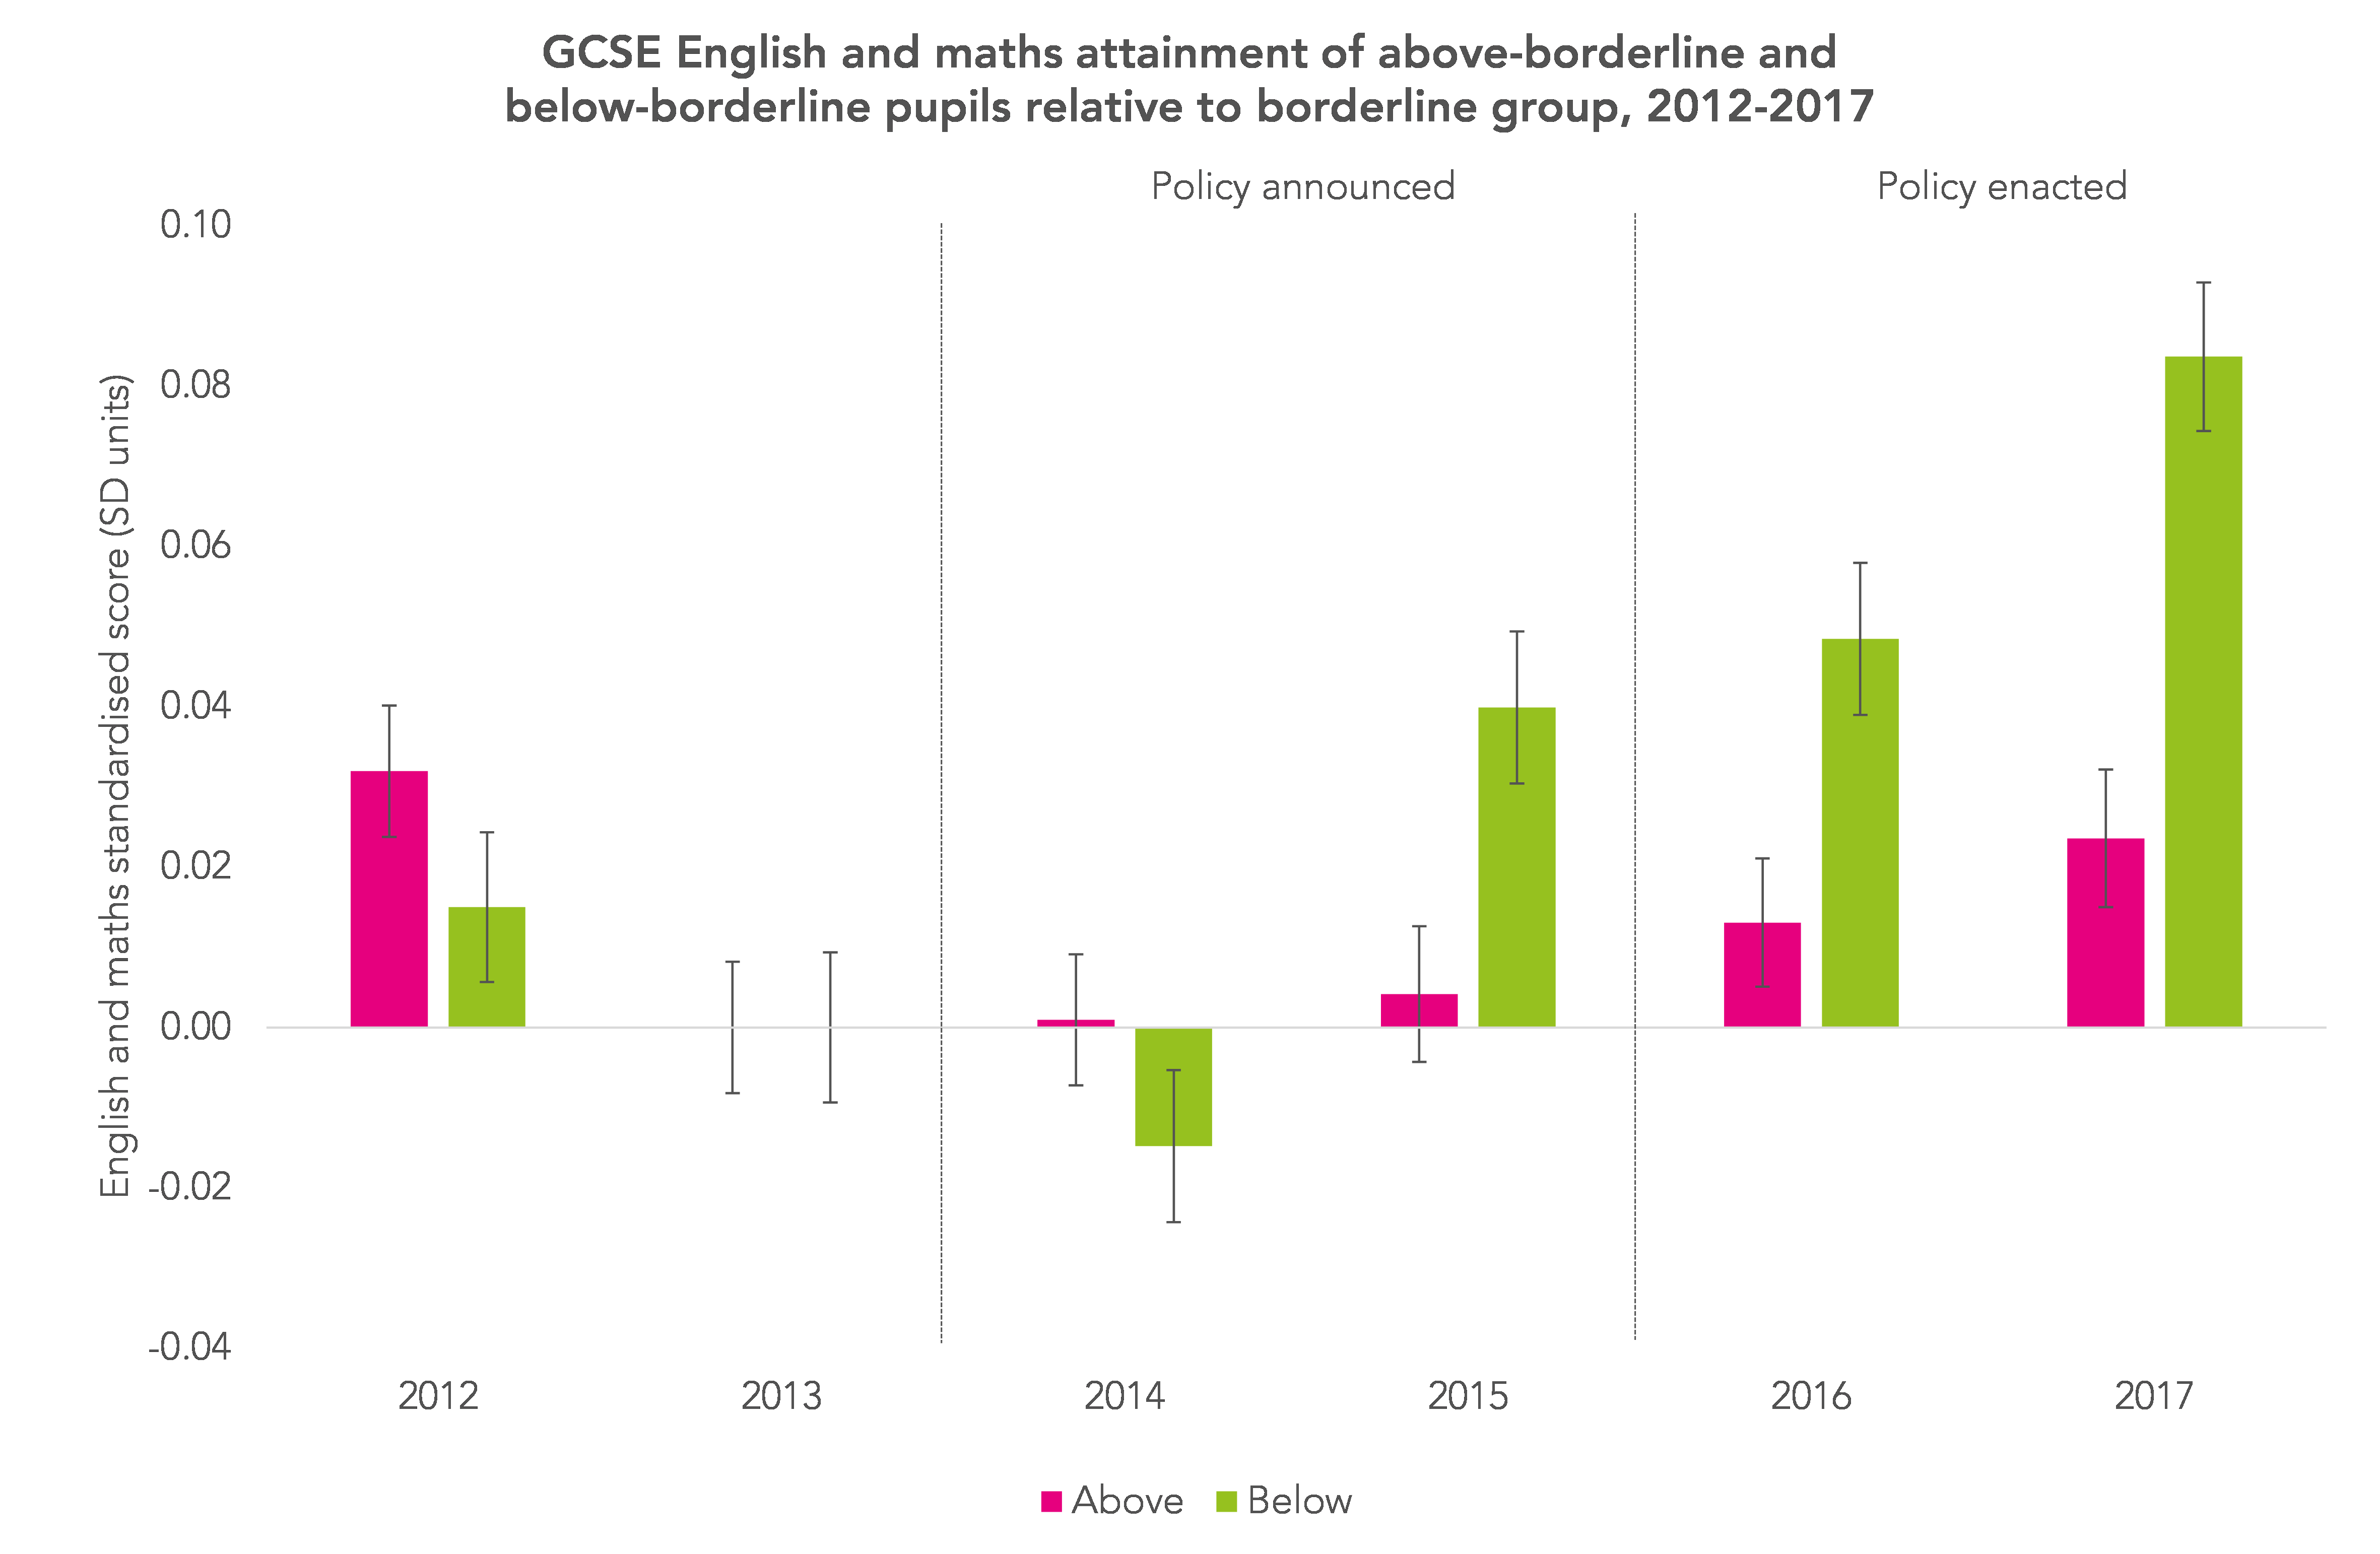
What does this show?
The effects are small but they are definitely not trivial. Indeed, for an educational reform that is essentially costless, they are quite impressive.
Our headline findings show GCSE English and maths gains by 2017 of 0.01 standard deviations (SD) and 0.06 SD for the above-borderline group and below-borderline groups respectively. This equates to a relative loss for the borderline group itself of 0.03 SD
What is the effect on inequality, on ‘working more equitably’? Educational inequality, the test score gap between disadvantaged and non-disadvantaged, falls. Because the ‘below’ group sees the largest improvement in scores and disadvantaged pupils are disproportionately found in this group, disadvantaged pupils gain relative to their more affluent peers by between 0.01 and 0.02 SD.
Implications
Our results are consistent with the view that some schools had reacted to the previous regime of high implicit incentives for the exam results of students at the GCSE grade C/D borderline. Once that incentive was removed, the borderline group appeared to make less relative progress compared to other groups.
We are, however, cautious in presenting these results. To be less cautious we’d have needed to have seen differences between groups only after the policy was implemented, yet we see some small differences beforehand too in the chart above. We therefore judge the results to be supportive of the hypothesis but not clinching.
And what can we say about how the incentive structure for schools arising from Progress 8 interacts with the age-old incentive schools have always had of “doing the best for the pupils”?
Under the old accountability regimes, schools were strongly incentivised to maximise the number of their pupils that achieved at least five or more GCSEs at grades A*-C.
This drive meshed well with the goal of the typical pupil, because passing that threshold was the key to accessing further or higher education and the job market.
Schools could take decisions on allocating their resources knowing that the goal of doing well by their pupils and the goal of doing well on the performance metrics were reasonably well aligned. In the new regime, that is not so true. Access to further and higher education and to jobs is still dominated by achieving at least grade C (now grade 4) passes in GCSE English and maths, and no attention is paid to the achievement of pupils in Progress 8 terms by employers.
This may mean that schools are partially conflicted, and that a goal for the school of keeping the five good GCSE “pass rate” high is still important to them.
This in turn may partly explain why the impact of the reform on test scores was clear and significant, but rather modest.
It may be that these two goals for schools will remain in tension.
Want to stay up-to-date with the latest research from FFT Education Datalab? Sign up to Datalab’s mailing list to get notifications about new blogposts, or to receive the team’s half-termly newsletter.
This project was funded by the Nuffield Foundation, but the views expressed are those of the authors and not necessarily those of the Foundation. Visit www.nuffieldfoundation.org.
1. We standardised scores based on the national mean and standard deviation for each year.
2. A pilot Progress 8 measure was published in 2014/15 involving 327 schools.


What happened before this in 2010, 2011, and after in2018 and 2019 – did trends continue ?
Hi Mark. We’ll be doing more work to include 2018 and 2019 in the new year. As for 2010 and 2011 we show a longer time-series in the report. However, we chose 2012 as a starting point because it offered some (brief) stability in attainment trends due to the application of comparable outcomes by Ofqual to maintain standards.
I enjoyed this, thank you. I think it is worth noting that even though the official threshold is gone, many schools are still using a 4 or 5 threshold in their marketing and internal processes. Why this is…probably complicated, but I would say if you did a survey of teachers and asked which group of students receive the most report, majority response would be 3/4 or 4/5 boundary.
Hi Adam. Thanks for taking time to comment. Yes I think that’s right. We did a survey of schools as part of the main report. As far as we could tell there was still plenty of support going in at the 3/4 boundary though perhaps less than in the past.
I think it’s also worth mentioning that the threshold measure is still there for English and maths, in the sense that the percentage of pupils achieving a 4/5 or above in both of these subjects is still published for school accountability purposes. Schools do still have an incentive to focus on borderline pupils, albeit not as large an incentive as doing well in the Progress 8 measure.
For this reason, I think you’d see a more pronounced difference if you did the same analysis with other subjects, although I understand the difficulties in doing so that you’ve outlined in this post.
Thanks for the comment. In the main report we also look at the effect using mean GCSE grade (all subjects) as an outcome and find similar results. Agree that the incentive to focus on the borderline at 3/4 hasn’t completely disappeared (and as you say there’s another one at 4/5 now as well).
How were other potentially impact generating changes accounted for?
Within your timescale the compulsory age of education/training rose to 18. Potentially generating greater encouragement for those within the demographic of interest to raise their game in order to qualify for university courses.
Further to this is the possibility that the push for ‘C’ grades in Maths and English pressured students to work harder in those subjects for fear of being forced into continual resits.
Hi Nigel. Thanks for the comments. We discuss some of the other policy changes that occurred around the same time in the report. Some of them we can cope with in our modelling some of them we can’t to be perfectly honest. That’s one of the reasons why we’re cautious about the results we present. You’re right that achieving 4/C grades in English and maths are still seen as essential for pupils’ future life chances and this may affect the borderline group more than others. However, we also see similar results to our main results using a different indicator- mean GCSE grade in all subjects.