This blogpost is part of FFT’s 2021 Secondary Results Service. Reports are now available in FFT Aspire.
We’ve had two years without external exams at the end of Key Stage 4.
In 2020 schools submitted the grades they thought their students would have achieved if exams had gone ahead. In 2021 they submitted the grades they thought their students had demonstrated in content they had covered.
In both years, schools were advised to use their recent performance in exams to moderate their grades.
In practice, grades in 2020 were higher on average than in 2019 (in some schools, much higher). This was compounded by Ofqual’s algorithm. And 2021’s grades were higher than 2020’s. This has been written about a lot already.
However, these averages hide a lot of variation. Some schools submitted grades which, like the averages, were higher in 2020 than 2019, and higher again in 2021 than 2020. But many did not.
In this post, we look behind the averages to see what’s happened to school-level results in the last two years.
The data
The data we’re using here has been submitted to us by schools using our Key Stage 4 secondary results service in both 2020 and 2021 (who had results published in 2019). This gives us around 1,400 schools – over 40% of state-maintained secondary schools.
As all of the schools we have data for are state-funded, we won’t be able to look at the much talked about gap between independent and state schools.
For this group of schools, we calculate the average point score (APS, where a grade 9 is 9 points, and 8 is 8 points etc.) across all pupils and subjects in 2019, 2020 and 2021.
Results in 2020 and 2021
Firstly, let’s summarise the changes in APS by school in each year.
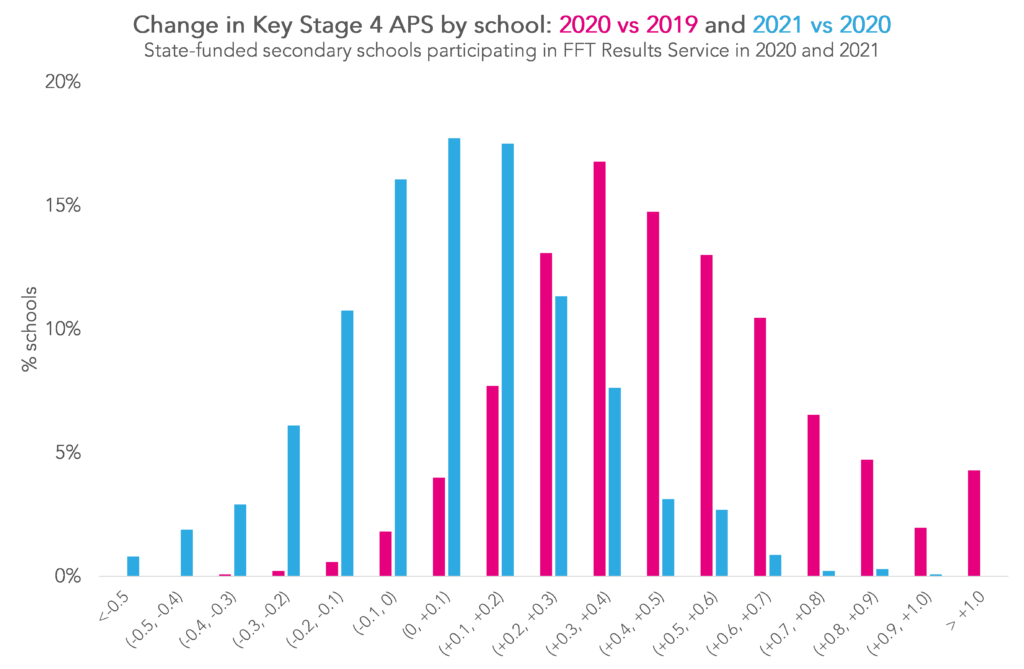
We can see immediately that the two distributions are very different. In 2020, almost all of the schools in our sample saw increases in APS from 2019, with 41% of schools seeing increases of at least half a grade. This isn’t too surprising because each grade was the higher of the one submitted by the school and the one produced by Ofqual’s algorithm.
What might be more surprising, given how much has been written about grade inflation in 2021, is that 38% of the schools actually saw lower average results in 2021 than in 2020. And only 4% saw increases of more than half a grade.
Linking yearly changes
So what’s gone on here? Are the schools who reduced their grades in 2021 the same ones who saw much higher than usual grades in 2020? Or did those schools record big increases in 2021 too?
Well, if you’re a regular reader of our blogs, you might have guessed the answer: “a bit of both, actually.”
Here we plot each school with their change in APS between 2020 and 2019 on the x-axis and between 2021 and 2020 on the y-axis. This allows us to see how each school’s grades changed in 2020 and in 2021.
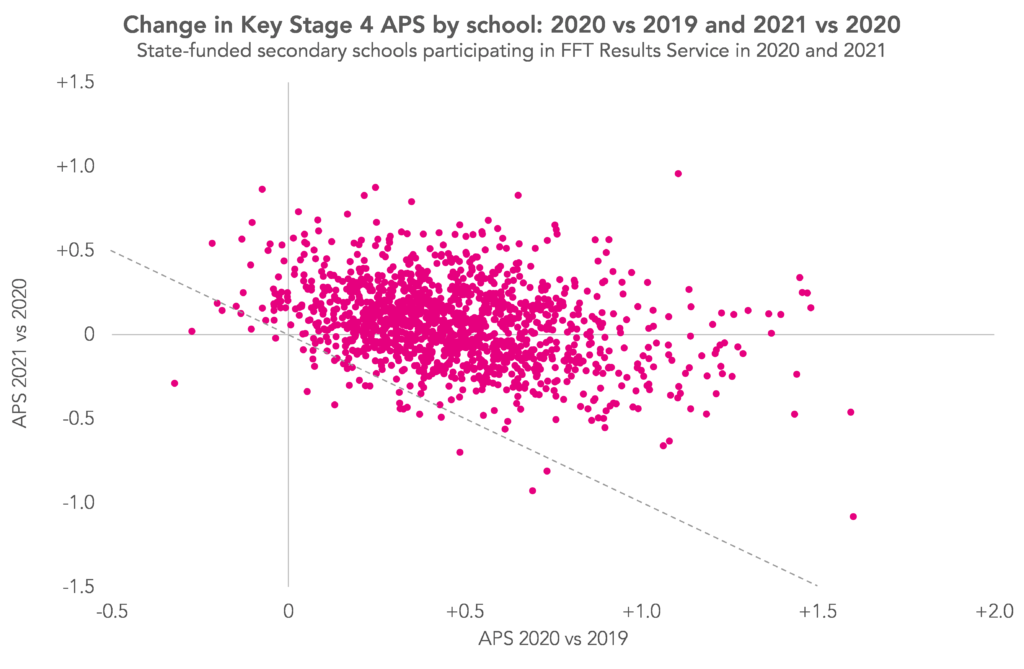
Firstly, we see a lot of variation. This means that, for a particular school, the change in APS between 2020 and 2019 is not very predictive of the change between 2021 and 2020.
That said, we do see a greater proportion of schools who had big increases in 2020 going on to reduce their grades in 2021 (though very few reduced them back to 2019 levels – the dotted line in the chart). In contrast, schools with small increases in 2020 were more likely to increase their grades further in 2021.
Summary
Two years without external exams has led to increased grades for almost all schools.
We have seen that schools with bigger increases in 2020 were somewhat more likely to reduce their grades in 2021.
However, the amount of variation highlights that there are many more factors involved. For example, differences in grading approaches between schools as well as the unequal impact of the pandemic on attendance (and in general).
We’ll see what the picture looks like after the planned return of external exams next summer.
Want to stay up-to-date with the latest research from FFT Education Datalab? Sign up to Datalab’s mailing list to get notifications about new blogposts, or to receive the team’s half-termly newsletter.


Leave A Comment