Aspire Attendance Tracker
Schools can track, analyse and compare their attendance data against 1,000s of other FFT schools using Aspire Attendance Tracker.
Log in to Aspire to access Attendance Tracker – log in here.
Not an FFT Aspire user? Learn more here.
The latest ONS infection survey was published last Friday. This provides estimates of the population in England testing positive for COVID-19 each day from the 5th September to 16th October.
We’ve been taking a look at it and it’s left us scratching our heads.
In previous posts we’ve shown how pupils in older year groups have seen their absence rates increase more than those in younger ones during the pandemic. This was true last year and early signs suggest it could be true this year too.
So it was surprising to read in the latest release that a greater percentage of Year 7 pupils were estimated to have COVID than Year 11[1]. Why isn’t this translating into absences? Let’s take a closer look.
Comparing school absence and COVID-19 infection rates
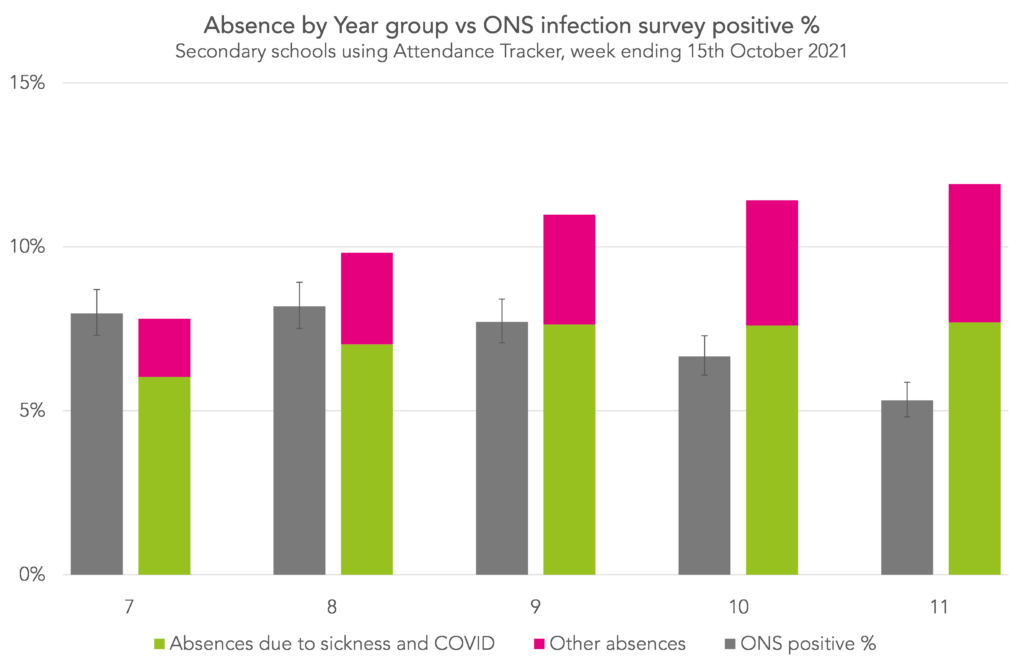
Here we show absence data from Aspire Attendance Tracker alongside the % of the population that ONS estimate to be infected with COVID. We’re looking at a single week: the week ending 15th October 2021. This is the latest week where ONS estimates are available.
We’ve grouped absences into those due to sickness or related to COVID[2], and those due to other reasons. Sickness and COVID-related absences are grouped together because schools are advised to record positive COVID cases as sickness.
Briefly, we see that older pupils are less likely to test positive for COVID (perhaps related to the vaccine rollout) but are more likely to be absent from schools compared to younger pupils.
Although 8% of Year 7 pupils were estimated to be infected with COVID, only 6% of sessions were missed because of sickness or COVID. Conversely, 5.3% of Year 11 pupils were estimated to be infected, yet 7.7% of sessions were missed due to sickness or COVID.
So even though infections were estimated to be 50% lower in Year 11 than Year 7, absence was around 30% higher.
Was this week just a one-off?
So there’s definitely something a bit strange about that week. How about the others?

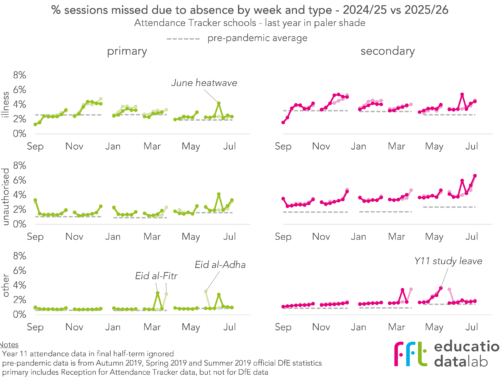
Here we plot absences (the dots) so far this term by week and year group and compare them with the relevant ONS estimates (the line with grey halo showing the confidence intervals for the estimates).
In the first four weeks of term we see more-or-less what you’d expect for all year groups: absence rates which are increasing with infections, and sickness + COVID absence rates which are generally above the infection rate (remember, schools are advised to record positive COVID cases as sickness).
The following two weeks is where we start to see the sickness + COVID absence rate start to dip below the estimated infection rate. We see this particularly for the younger year groups.
Should anything be done?
So what’s going on? Well, we’re not entirely sure.
One theory which would explain what we’re seeing is that pupils in younger year groups are more likely to be asymptomatic, and therefore less likely to be tested for COVID (but, crucially, still able to pass it on).
This would raise the question of how far the switch from compulsory on-site testing to advisory at-home testing is responsible for the record COVID rates we’ve seen among school-age children so far this year.
But would the benefits of a return to mass on-site testing for controlling infection rates in schools outweigh the organisational headaches it would create?
[1] Here and throughout, we’re going to equate being in Year 7 with being 11 years-old, Year 8 with being 12 years-old etc. so that we can map our absence data (in national curriculum Year groups) with ONS infection data (in years of age). We know this isn’t quite correct, but as we’re still early in the school year we think it’s correct enough.
[2] Attendance codes “I” and “X”. “I” is used for any type of sickness, including positive COVID cases, while “X” is mostly used for pupils required to isolate or quarantine.
Want to stay up-to-date with the latest research from FFT Education Datalab? Sign up to Datalab’s mailing list to get notifications about new blogposts, or to receive the team’s half-termly newsletter.


Leave A Comment