Just before half term the government published its Levelling Up White Paper.
The mission for education: for 90% of pupils to achieve the expected standard in reading, writing and maths at the end of Key Stage 2 by 2030.
So far, there has been little in the way of new policy to reach this target, save for the announcement of 55 Education Investment Areas (EIAs) and some funding for early years and families through Family Hubs and the Supporting Families programme. Perhaps there will be more in the forthcoming education white paper.
In this blogpost we dig into the Key Stage 2 data to think about how the target might be achieved.
Data
We use Key Stage 2 data from 2019. This is the latest year of data available as Key Stage 2 tests were cancelled in 2020 and 2021 due to the pandemic.
Pupils were tested in reading and maths and assessed by their teachers in writing.
We link pupils’ Key Stage 2 results to their Key Stage 1 teacher assessments from four years earlier and also to some basic demographic data (gender, month of birth, disadvantage[1] and special educational needs[2])
Distance to target
In 2019, 65% of pupils reached the expected standard in reading, writing and maths. This is some way short of the 2030 target of 90%.
If Key Stage 2 tests return this summer, we may find that this figure is even lower, particularly if there are still higher levels of absence in schools (as absent pupils are counted as not having achieved the expected standard).
But if we look at the individual subjects, we see higher rates of achievement. This is especially so if we consider pupils who achieved the expected standard in reading, writing OR maths.
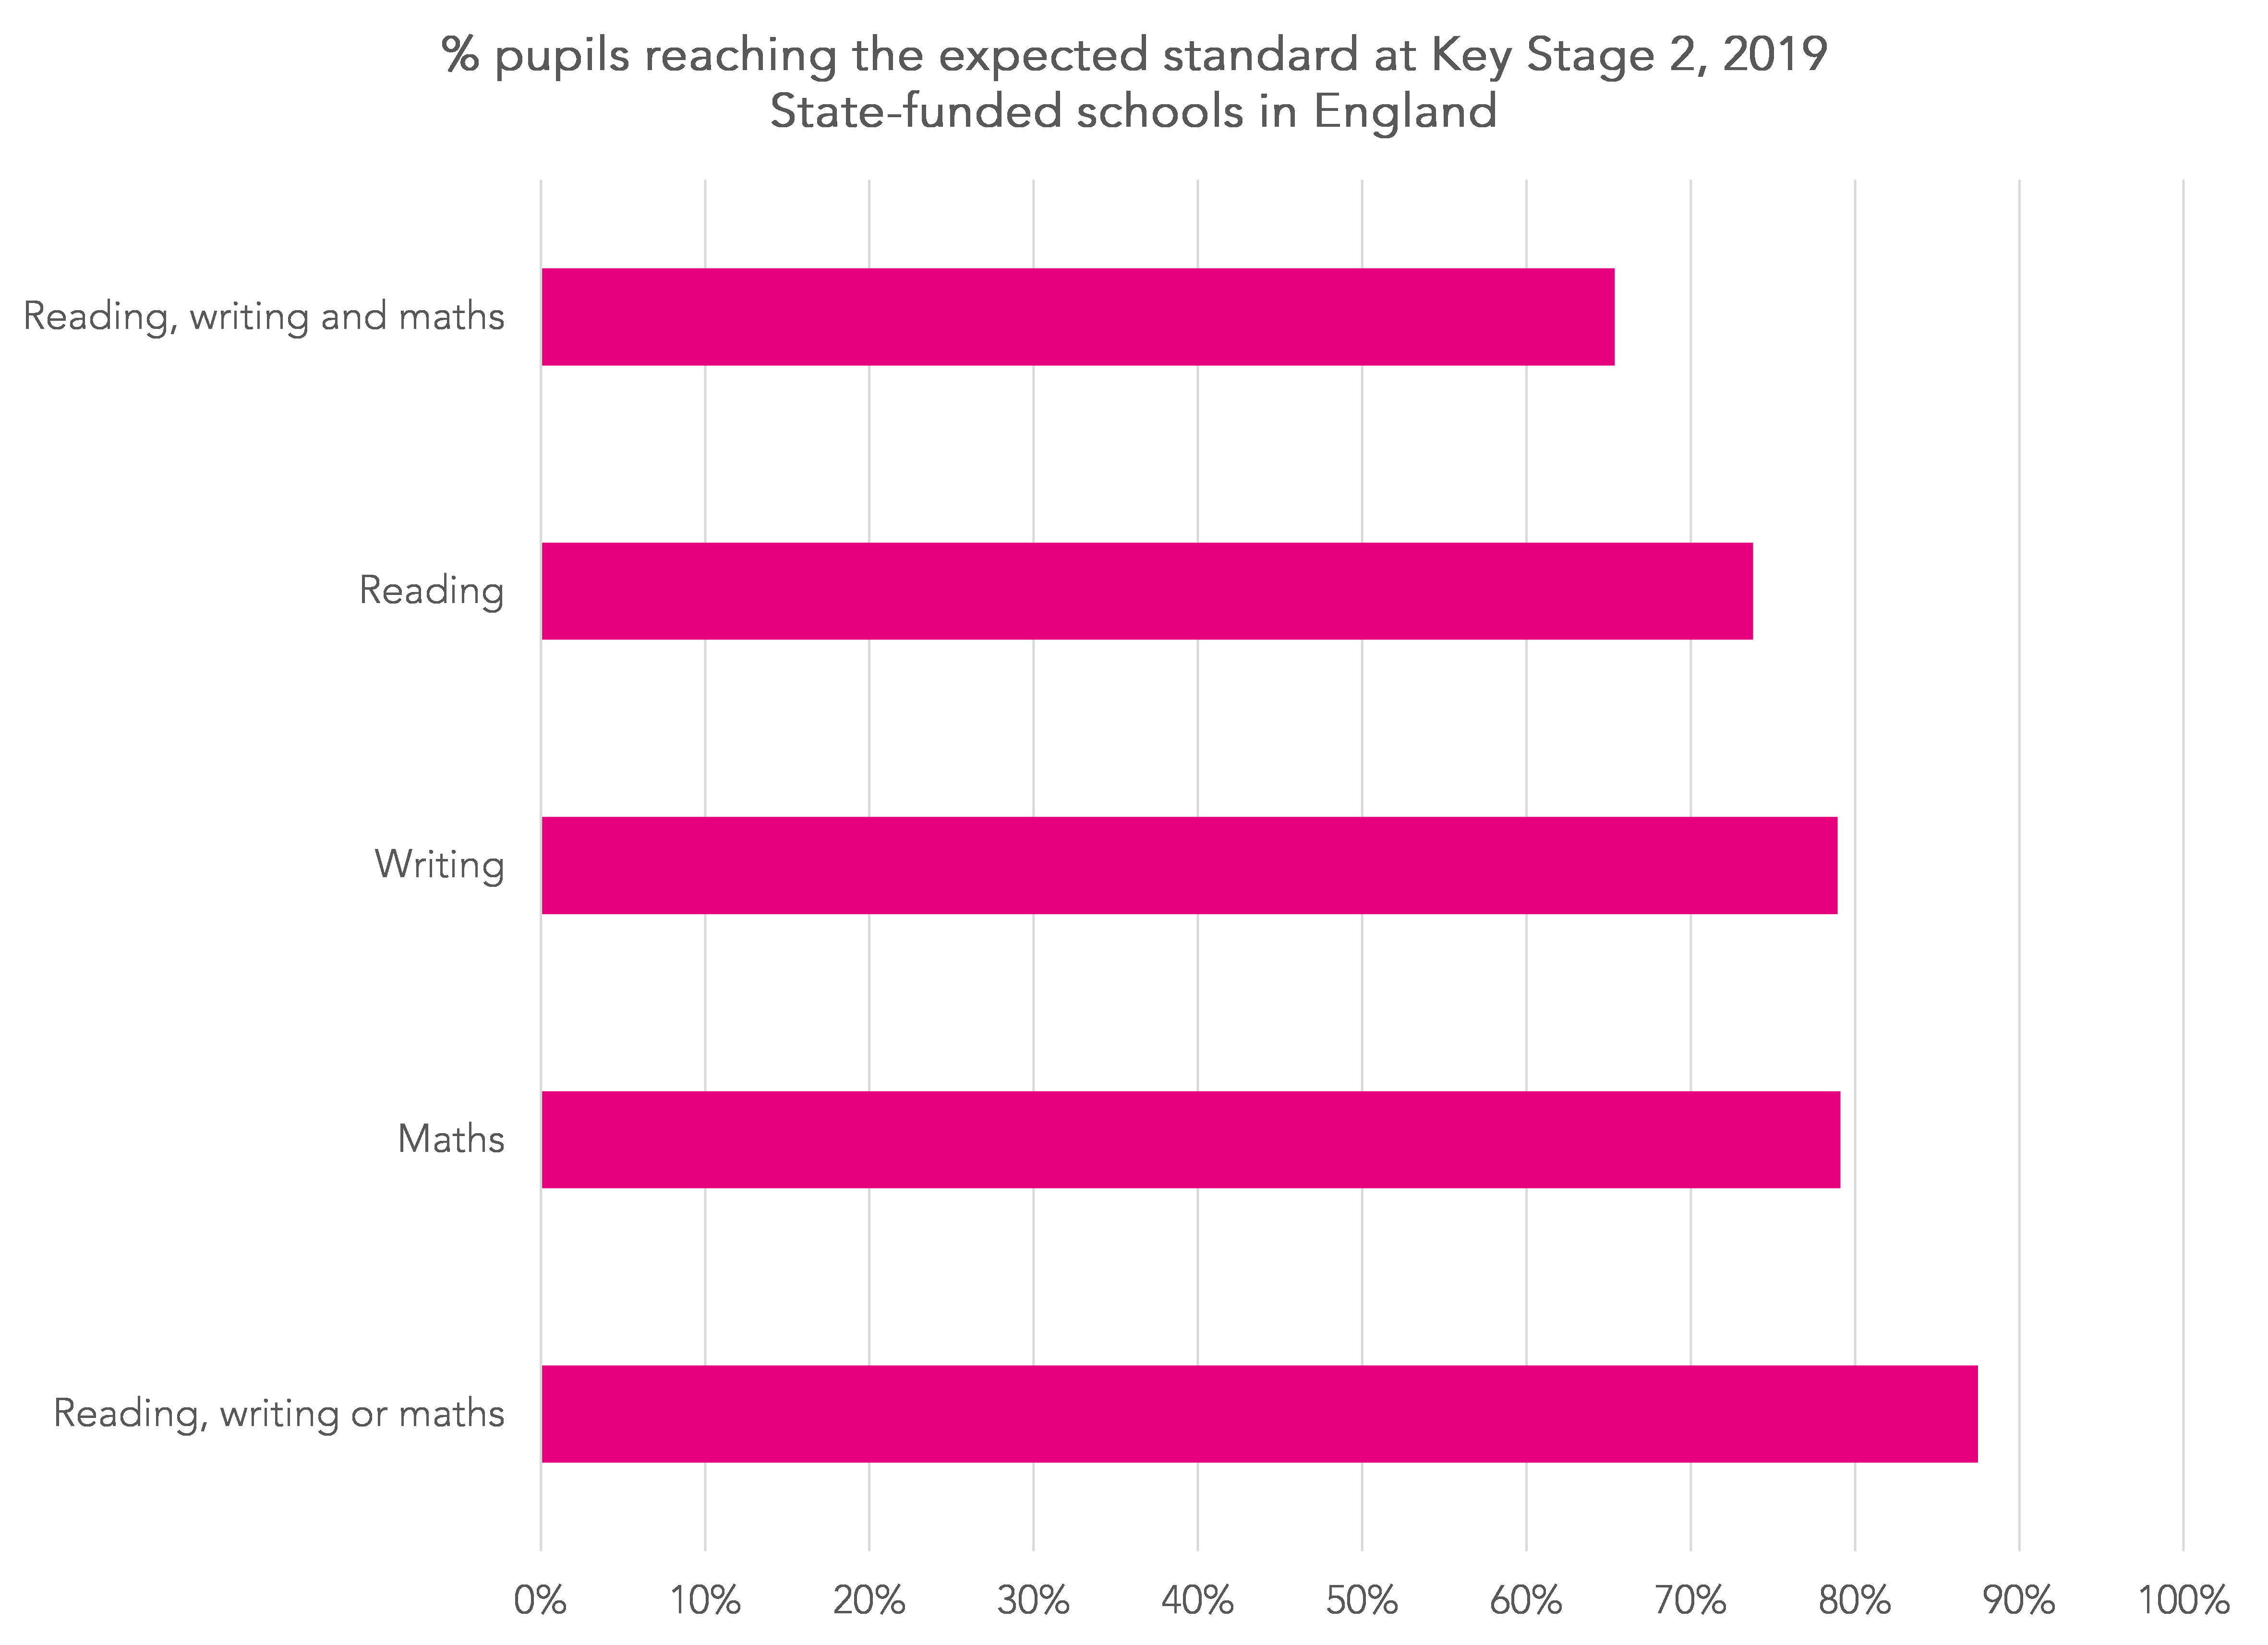
87% of pupils achieved the expected standard in at least one of reading, writing or maths. Not far short of the 2030 target.
We also see that the percentage of pupils who reach the expected standard in reading (73%) is lower than the percentage who reach the threshold in writing (78%) and maths (79%).
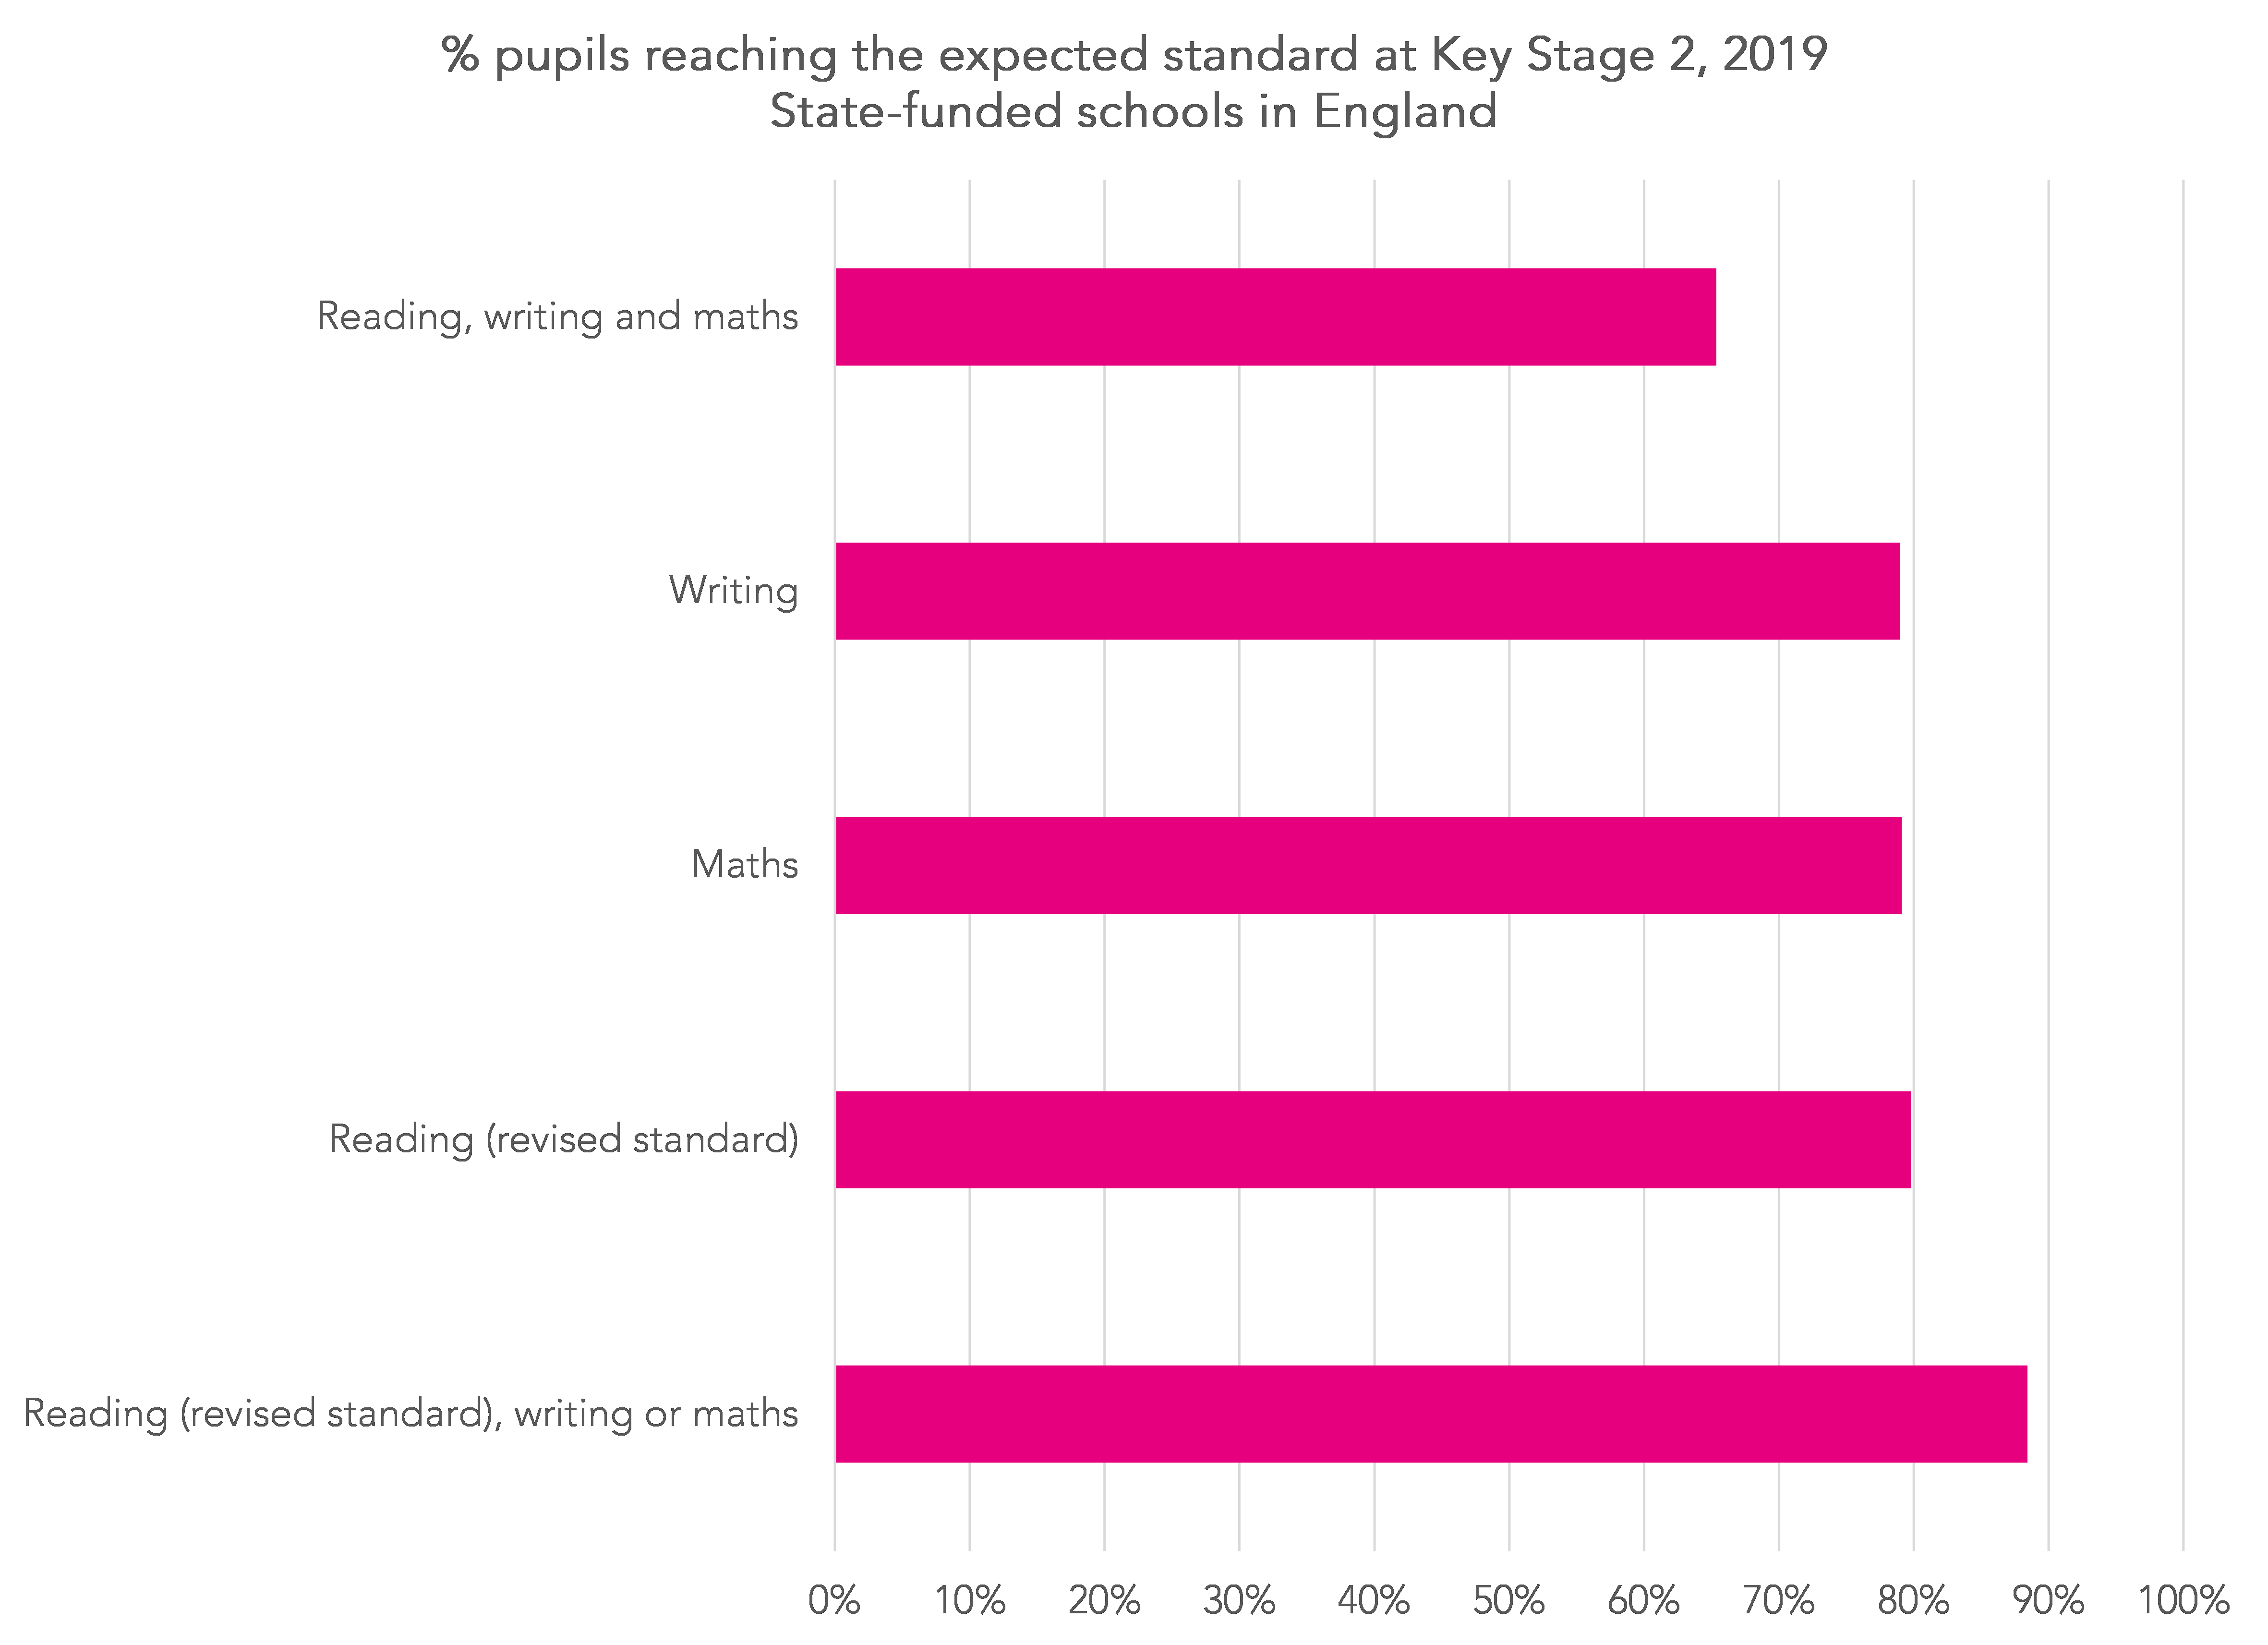
If we were to revise the expected standard for reading slightly and include all pupils who scored 25 on the reading test [3] then roughly even proportions would have achieved the expected standard in all three subjects. This would lead to 88% pupils achieving the expected standard in at least one of the three subjects as shown in the final bar in the chart below.
Which pupils achieve the expected standard in at least one subject but not all three?
65% of pupils achieved the expected standard in all three subjects whereas 88% achieved it in at least one subject, with a bit of extra allowance for reading.
In a world in which there is a target of 90% of pupils achieving the expected standard, then all these pupils (plus a few more) would be expected to achieve it.
So who are the 23% of pupils who achieve at least one expected standard but not all three?
This was a group of 148,000 pupils in 2019. Let’s start by looking at how many achieved the expected standard in each subject.
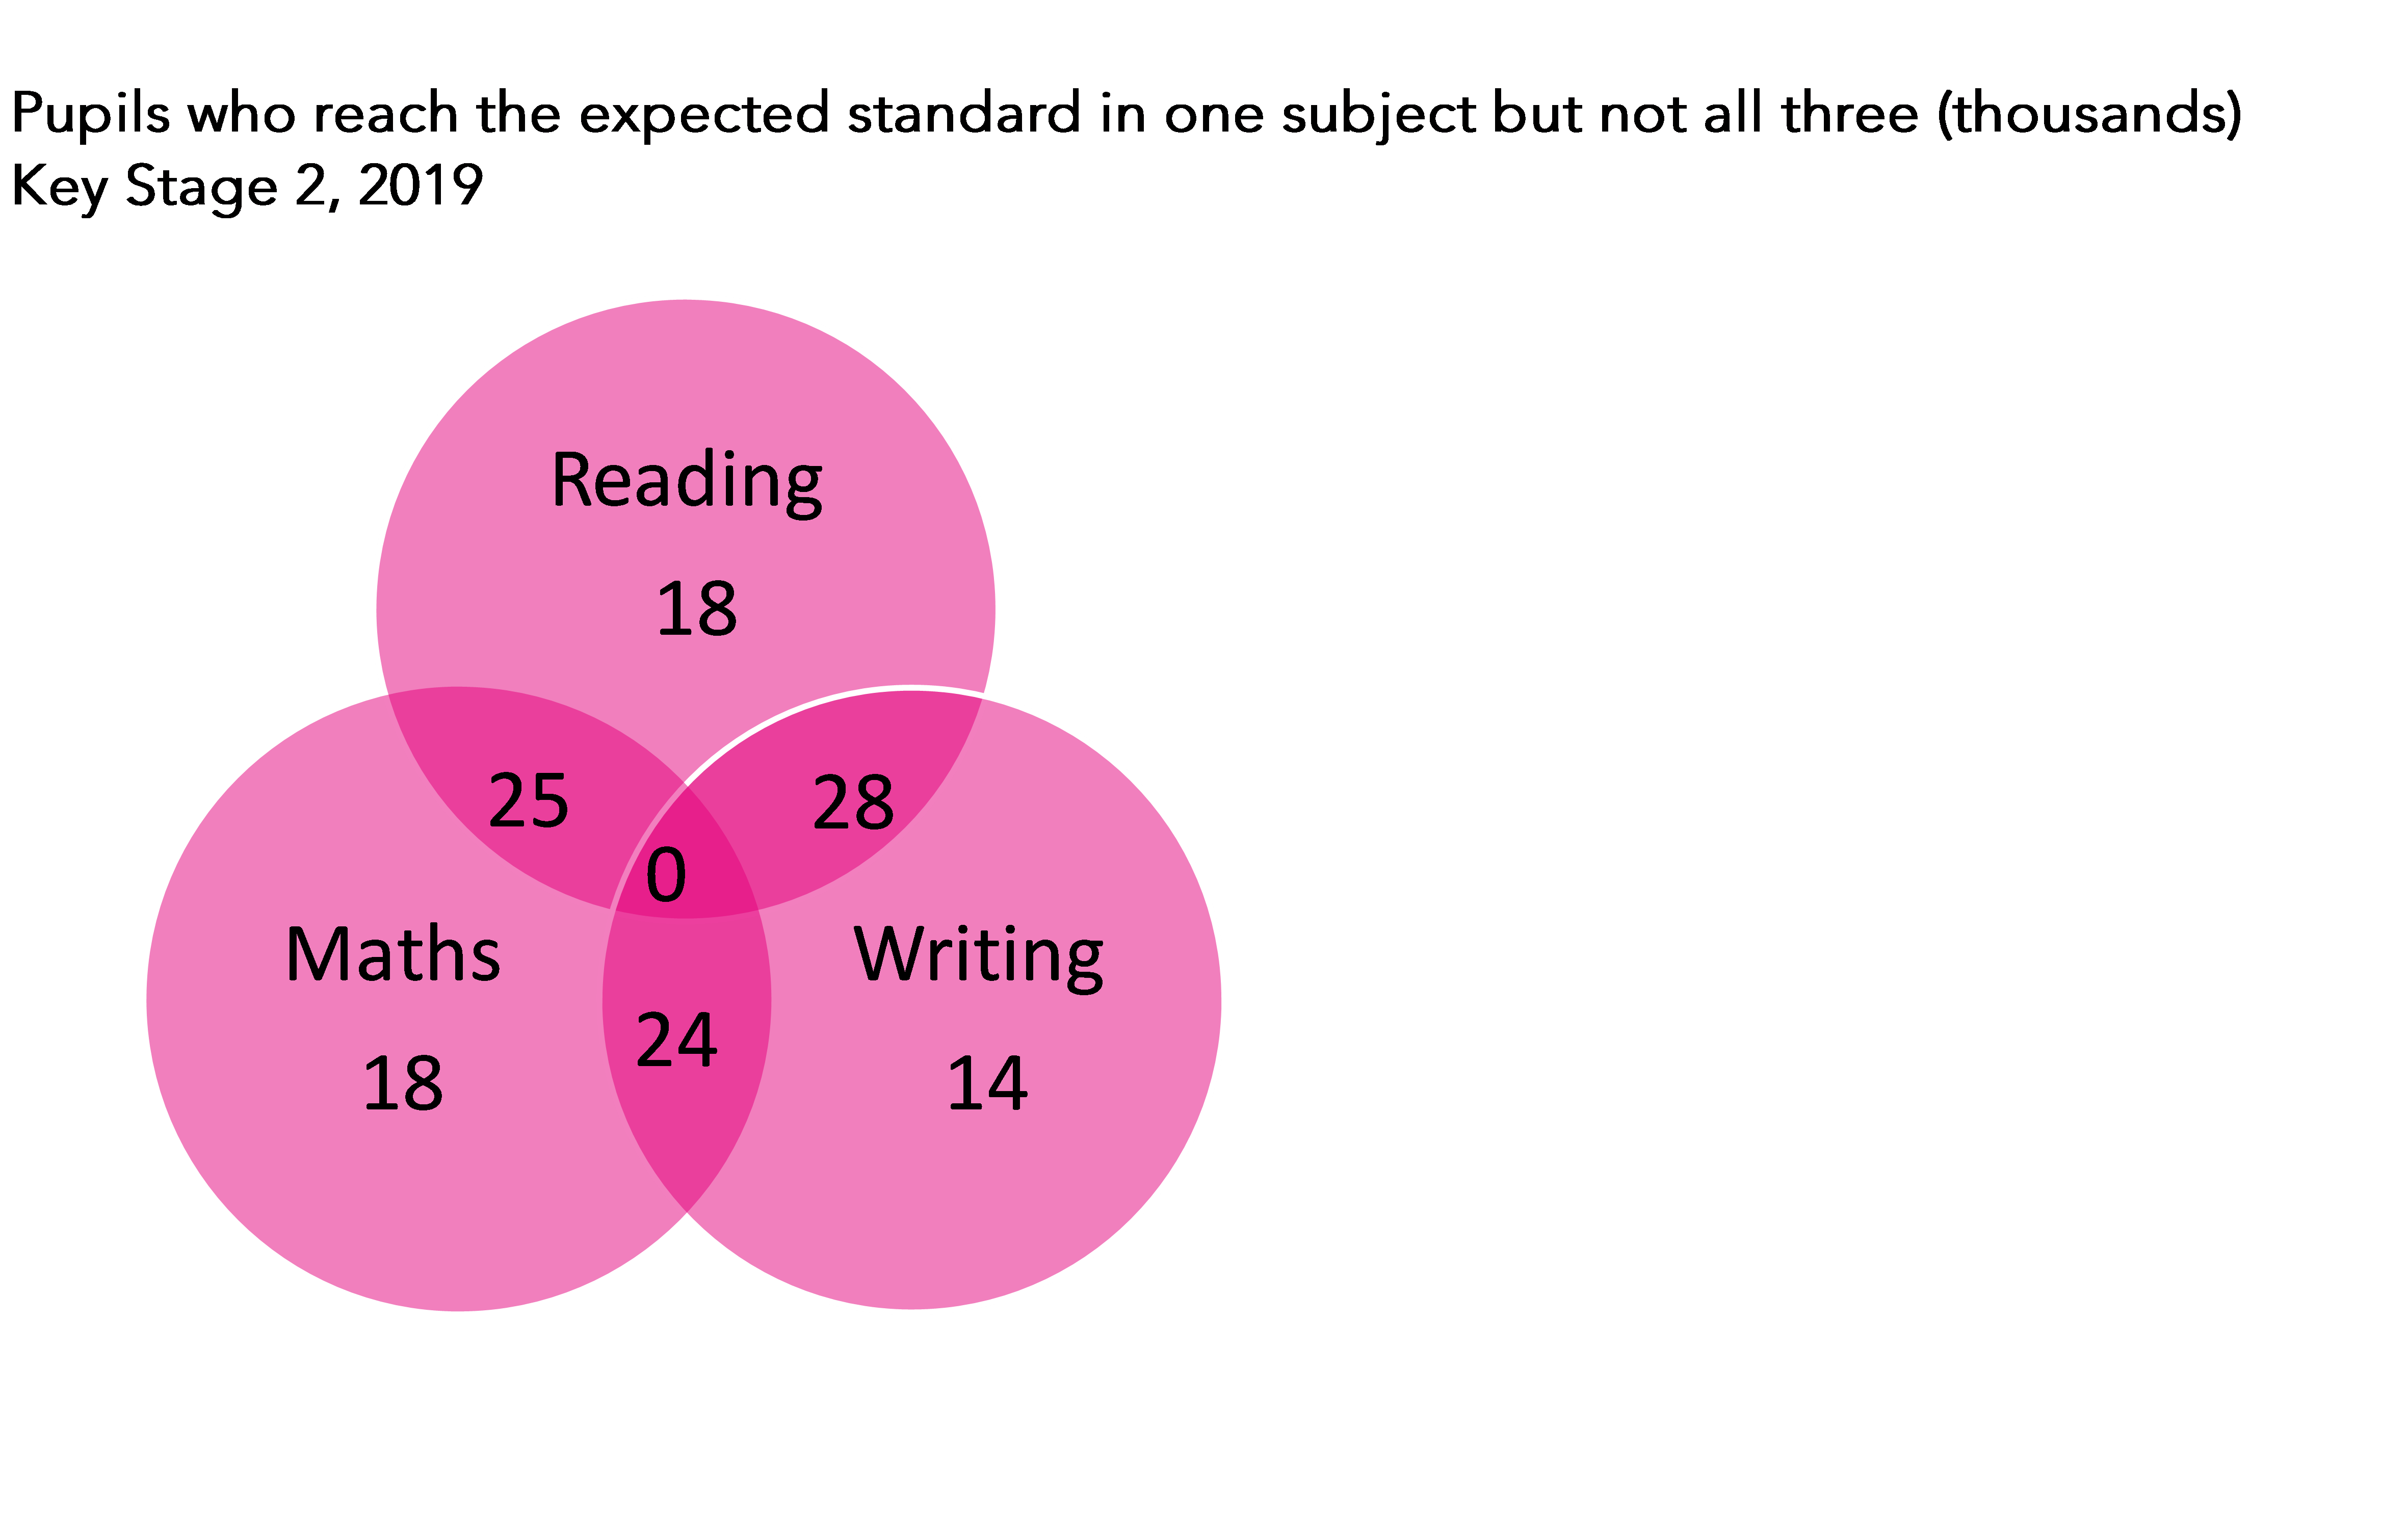
77,000 (52%) achieved the expected standard in two subjects. The remainder are fairly evenly spread among the other three subjects.
And what of the characteristics of these pupils?

Unsurprisingly, this group of pupils are more likely to be disadvantaged, boys, summer born and have been identified by their schools as having special educational needs. They also tended to have achieved lower levels of literacy at Key Stage 1. Here we use KS1 literacy scores we created in this blogpost.
Any policy aimed at reaching the 90% target therefore has to work for these groups of pupils.
Summing up
The government white paper on Levelling Up has set a target of 90% of pupils to achieve the expected standard in reading, writing and maths at the end of Key Stage 2 by 2030.
These pupils will enter their Reception year in 2023/24. Many may already be attending early years provision.
However, there has been little in the way of new policy from which this cohort will benefit so far.
Education Investment Areas have been announced in 55 of the 150 or so local authorities in England. These might play a part in achieving the target, but our analysis of published Key Stage 2 data for 2019 suggests that only 40% of pupils who did not achieve the expected standard in reading, writing and maths lived in these areas.
So policy is needed that works across all areas.
In particular, policy (and funding) that improves early literacy and special educational needs provision will be vital.
- Eligible for free school meals in the six years up to 2019
- Both in year 6 and throughout their school history to date up to 2021
- These pupils achieved a scaled score of 97 or higher (though pupils who scored 24 also achieved a scaled score of 97)
Want to stay up-to-date with the latest research from FFT Education Datalab? Sign up to Datalab’s mailing list to get notifications about new blogposts, or to receive the team’s half-termly newsletter.

Hi Dave… how far back is KS-2 attainment data available?
Hi Tony. Back to 1995 – although the tests have changed a fair bit over the years. The current incarnation has been around since 2016.
Hello again Dave… I think your report is quite useful for informing policy-making. An excerpt from your report: “Any policy aimed at reaching the 90% target therefore has to work for these groups of pupils.” I cannot speak for literacy but I can for numeracy. There, without a policy for whole-class teaching in Maths from Reception Year on, I believe that a wide spread of attainments by age 11 is pretty well guaranteed, with about half of children so switched off they are unlikely to really learn much more Maths in secondary school. Primary-level within-class “ability” grouping for Maths, unfortunately widespread in the UK, is nothing but damaging for so many children. Even the use of the word “ability” is not good, as it implicitly supports the societal notion that ability is more fixed than changeable.
I agree with your point – I wonder if there is any data on or research into the outcomes of low attaining children who are grouped together in class by ‘ability’ (it’s really by attainment as who can actually measure ability?), sometimes for their entire primary school lives. It’s a pervasive, educationally bankrupt approach that ghettoises the neediest and least understood proportion of the school population, many of whom are likely to fit the categories of underperforming children in this article – disadvantaged, summer-born, boys, with SEND.
I was interested in your idea of reducing the target score in the reading SAT paper. I wonder what would be the effect of giving children more leeway with the time available to complete the paper?
One of the points I continually make in training about reading comprehension is that slowing down helps readers understanding better – mainly because it gives time to link the text with their prior knowledge and to think about what is being hinted and implied (the basis of reading inference). Generally comprehension improves if we spend time re-reading and thinking (and ideally talking about – but maybe not in SATs!) what we’ve read.
Interestingly, although anecdotally, a school I work with regularly – and a school that before covid was regularly achieving 85 – 93% at age related expectations in reading at KS2, found that allowing children more time to complete the paper had a significant improvement in the number of children who achieved the target pass mark. (This was a Year 5 group doing a Year 6 past paper.)
So, there may be other ways to impact on the reading scores achieved at the end of KS2 – giving children more time to read several challenging (and long) texts seems an entirely reasonable way to move forward.
It’s very good to hear of at least one school which has ~90% of children meeting age-related expectations at KS-2. The ‘more time’ points about improving/optimising reading comprehension I think show wisdom in teaching. However, another way to look at this is: Doesn’t a lot of effort go into reacting to and living with what is arguably a bad system? The aspect of ‘badness’ here is the very existence of high-stakes exams at such an early age. Intrinsic motivations for primary school learning and teaching are greatly diminished. The structures of schooling remain mostly as they were a few generations ago- largely unsuited to today’s world.
In an LA maintained Junior school with 30% of the cohort on the SEN register – 90% combined seems beyond the bounds of possible. 15-20% of children join us still requiring high intensity phonics input and often 2 years or more behind in other subjects. Intensive catch up needs staff and costs well beyond the remit of PP funding. There has to be some serious consideration around funding of low attainers – but with no published assessment until KS2 I’m not sure how these can be identified to direct any funding effectively. Equally catch up of that magnitude in core subjects is vastly at odds with a bloated primary curriculum where time is already at a premium.
An excellent point. The government continues to declare targets but does not provide the means to enable meeting the targets. Further, that targets are even set is essentially wrong. Under the joint coshes fo Ofsted and league tables, schools are forced to make huge efforts to hit targets. But teachers know well that much of that effort is not about truly educating pupils.
I know I’ve come to your article late but, if you are still listening to replies…
The target will never be met while the threshold for a ‘pass’ keeps changing. The fact that the pass mark is not set until papers are marked is highly suspicious! The percentage of children who achieve each standard is always around 70%. This doesn’t strike me as being intuitively likely. I have been teaching children to take KS2 tests since the new framework began. I KNOW that I am better at it and that, consequently, my children are better prepared each year. Most schools try previous papers and they KNOW that x% of them would have passed each paper. Yet that percentage of children don’t always pass the test for their cohort. The ‘pass’ mark for reading and maths has crept up each year, suggesting that the government/ DFE/whoever, are moving the goalposts. They seem scared of the idea that teachers are teaching better and that children are smarter (or at least smarter when it comes to answering SATs style questions).