GCSE exam results are out on Thursday, for the first time since 2019.
Here’s our round up of what we expect to happen on the day (and a few things that we won’t find out until later).
Grades will fall relative to those in 2020 and 2021
Just as we saw on last week’s results day, most of the headlines will probably be about the fall in grades. Ofqual has already stated – almost a year ago – that grades this year will be set at a midpoint between 2019 and 2021, so the fall in grades should hardly come as a surprise.
That said, GCSE grades increased by a smaller amount compared to A-Levels between 2019 and 2021 so we would expect smaller drops.
Increases in the size of the cohort and the percentage of pupils achieving grade 3 or lower in English and maths will result in larger numbers resitting English and maths next year.
Regional differences in attainment may have widened
Analysis of both A-Level and Key Stage 2 results show differences in attainment between regions.
It seems likely that we’ll see similar regional differences in GCSE results.
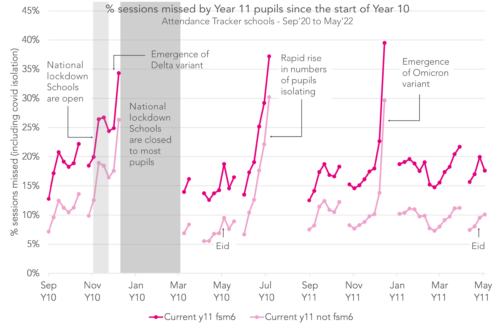
These differences may indicate that attainment in some regions has been disproportionately affected by the pandemic. Although we can’t be sure if this is the case, our analysis of attendance data collected from over 2,000 secondary schools via Aspire Attendance Tracker shows that, among this year’s Year 11 pupils, there were regional differences in how much school pupils have missed.
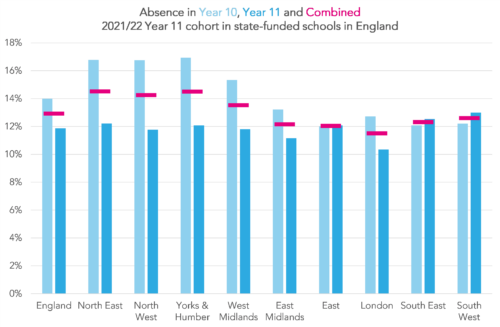
Year 11 pupils in London schools have tended to miss less school over the last two years, and particularly so this year, than Year 11 pupils in other regions. Pupils in northern regions have tended to miss the most school.
This may well translate into differences in grades on Thursday.
The gap between state and independent schools’ grades will narrow
Last year there was quite a lot of commentary – including from us – on the increasing gap in grades between state-funded and independent schools during the pandemic.
This also happened again this year following the publication of A-Level results (although John Jerrim cautions against reading too much into the differences in this article).
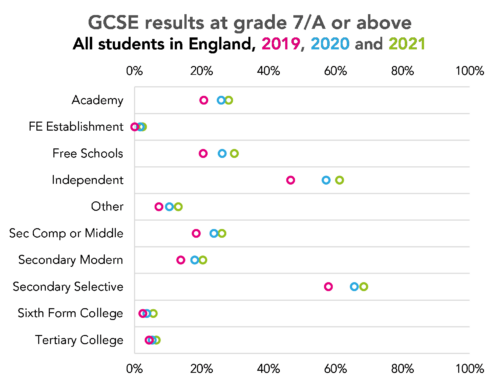
Regardless of the cause of the increased gap, we can expect to see it fall on Thursday. If it follows the pattern seen in last week’s A-Level results, it’ll be much closer to what it was in 2019.
The government’s EBacc ambition will prove too ambitious
We’ve heard very little lately about the government’s previously declared ambition to see 75% of pupils taking the EBacc this year.
Provisional data tells us that entries for EBacc subjects are up, but the crucial question is whether entries for languages have increased substantially. Low entries to languages are the main sticking point preventing entries to the EBacc for rising; the chart below shows how trends in EBacc entries almost exactly track the trends in entries to languages.
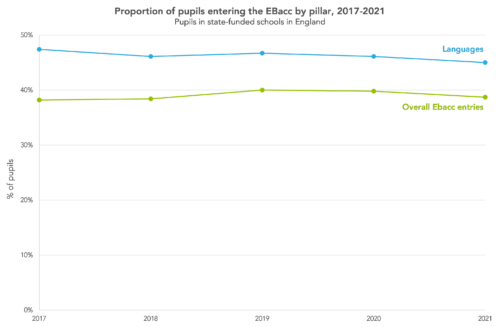
We’re expecting language entries to be up by around 5% this year compared to 2021, as shown in the table below. The 2022 figures are based on provisional data.
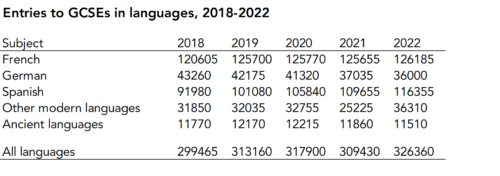
This 5% increase is likely at least partly driven by an increase in the population of 16 year olds of around 4%. But we can expect the proportions of EBacc entries to increase slightly. Although it will be nowhere near the 75% ambition – this year’s figure will likely be much closer to last year, which was 39%.
The disadvantage gap may have increased (but we won’t find out on Thursday)
Last year, Ofqual released an equalities analysis on results day that showed that the gap in average GCSE grade between pupils eligible for free school meals and their peers increased by 0.12 grades between 2019 and 2021.
We aren’t expecting an equivalent publication on Thursday, but we are expecting analysis to be published later in the year as part of the DfE’s key stage 4 performance release.
Any analysis will be complicated by changes in free school meal eligibility, which mean that the group of pupils classified as disadvantaged – usually those who have been eligible for free school meals at some point in the last six years – may not be directly comparable across years.
We do know, however, that among this year’s Year 11s, disadvantaged pupils missed more school than their peers during the course of their GCSEs.
Schools with a lot of early entries could see big drops in performance tables
School performance data won’t be published until later in the year, but changes in the way performance measures are calculated this year could see big drops for some schools.
This is because under the 2022 methodology, results from 2020 and 2021 will be counted as entries but not results – effectively treated as a U grade. As we showed in an earlier post, this could be bad news for schools that entered their current Year 11s for GCSEs in Year 9 or 10.
Want to stay up-to-date with the latest research from FFT Education Datalab? Sign up to Datalab’s mailing list to get notifications about new blogposts, or to receive the team’s half-termly newsletter.


Leave A Comment