Universal Primary Free School Meals (UPFSM) has been rolled out in London this term.
This scheme extends universal free school meals for infants introduced nationally in 2014/15 to pupils in Years 3 to 6.
Some boroughs (Newham, Islington, Southwark, Tower Hamlets and Westminster) already had their own local UPFSM policies in place, Newham’s dating back as far as 2008/09.
We previously set out some thoughts about how the impact of UPFSM on absence and attainment might be estimated. As we set out in that piece there might be good arguments for UPFSM even if there were no impact.
But in this article, we’re going to look at what happened to absence in three of the London boroughs when they introduced UPFSM.
Data
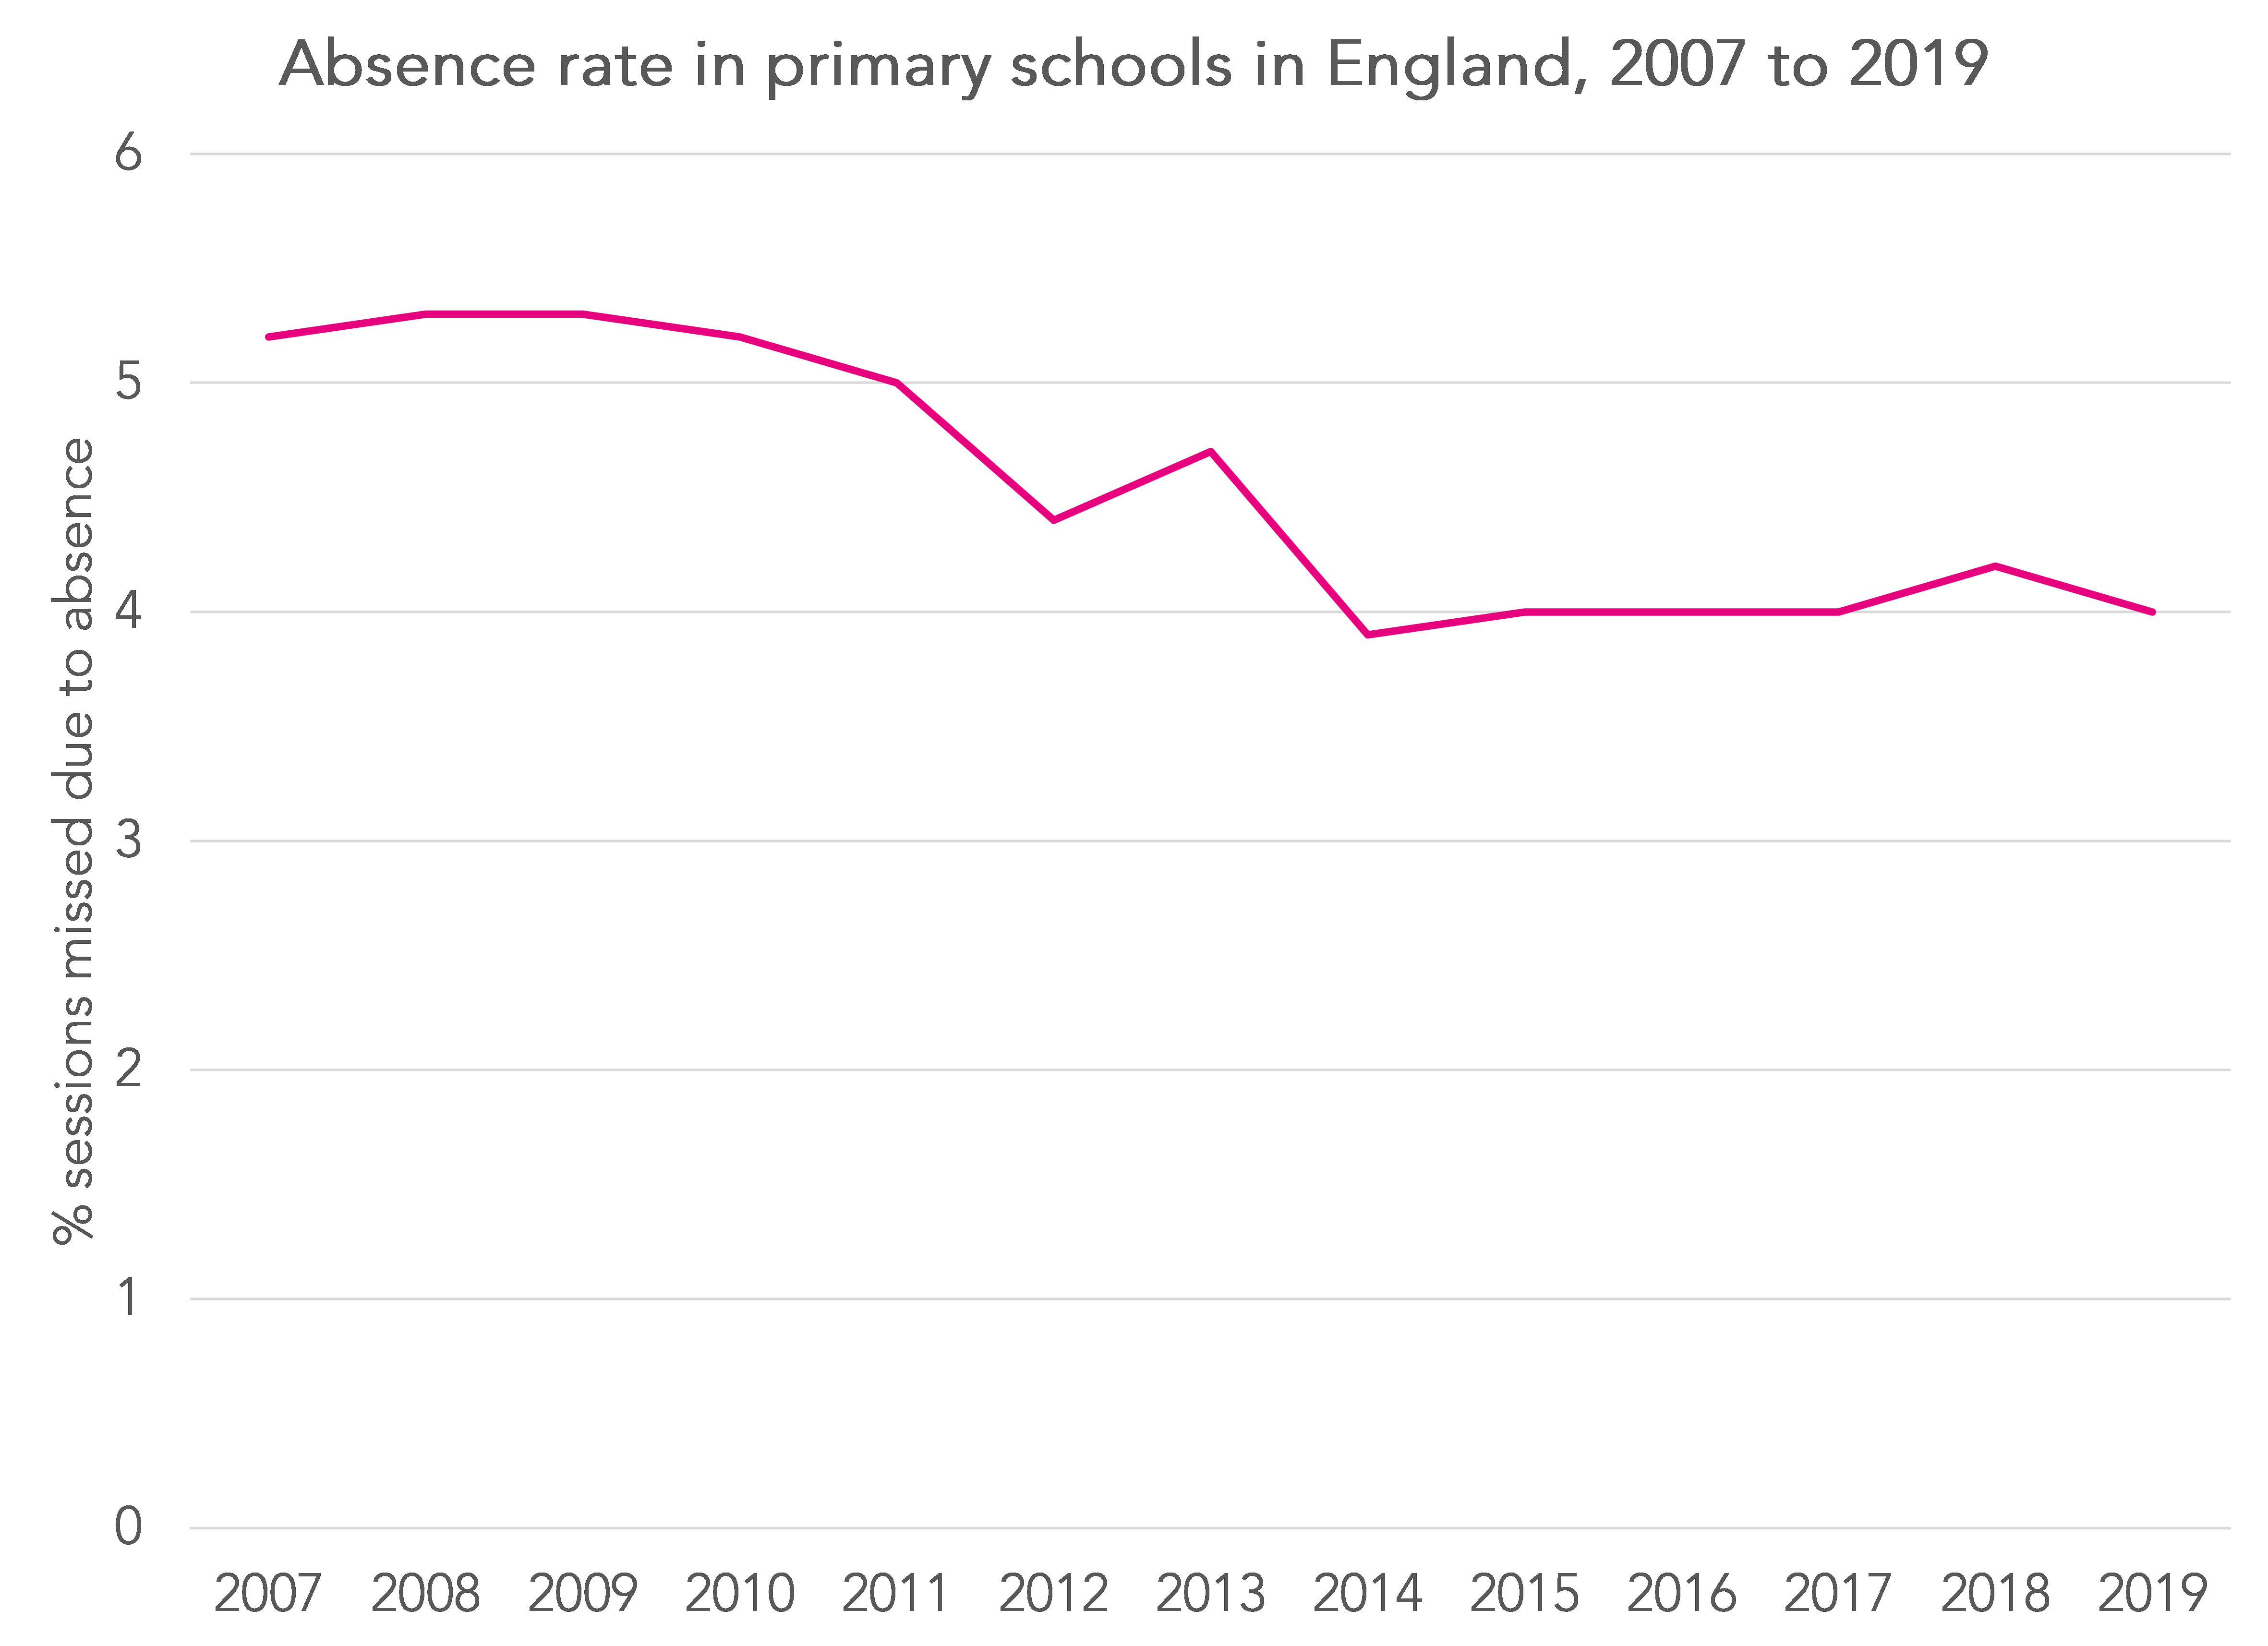
We use published data on absence in state-funded primary schools at local authority level from 2007 (when data was first collected via School Census) to 2019, the final year of data prior to the pandemic.
All local authorities for which the full 13-year period is observed are included. This means we drop authorities that have undergone reorganization during this time.
Four London local authorities (Newham, Islington, Southwark and Tower Hamlets) along with Durham introduced UPFSM during this time: Newham and Durham in 2009/10, Islington in 2010/11, Southwark in 2013/14 and Tower Hamlets in 2014/15.
Comparison to the national average
In general, the absence rate in primary schools nationally fell between 2007 and 2019.
For each of the 5 local authorities that introduced UPFSM, we calculate the difference in absence in primary schools in the LA compared to the national average. This helps to interpret year-on-year changes in each LA net of national trends.
We show these figures in the chart below. We do this for the year in which the UPFSM policy was introduced and three years either side.
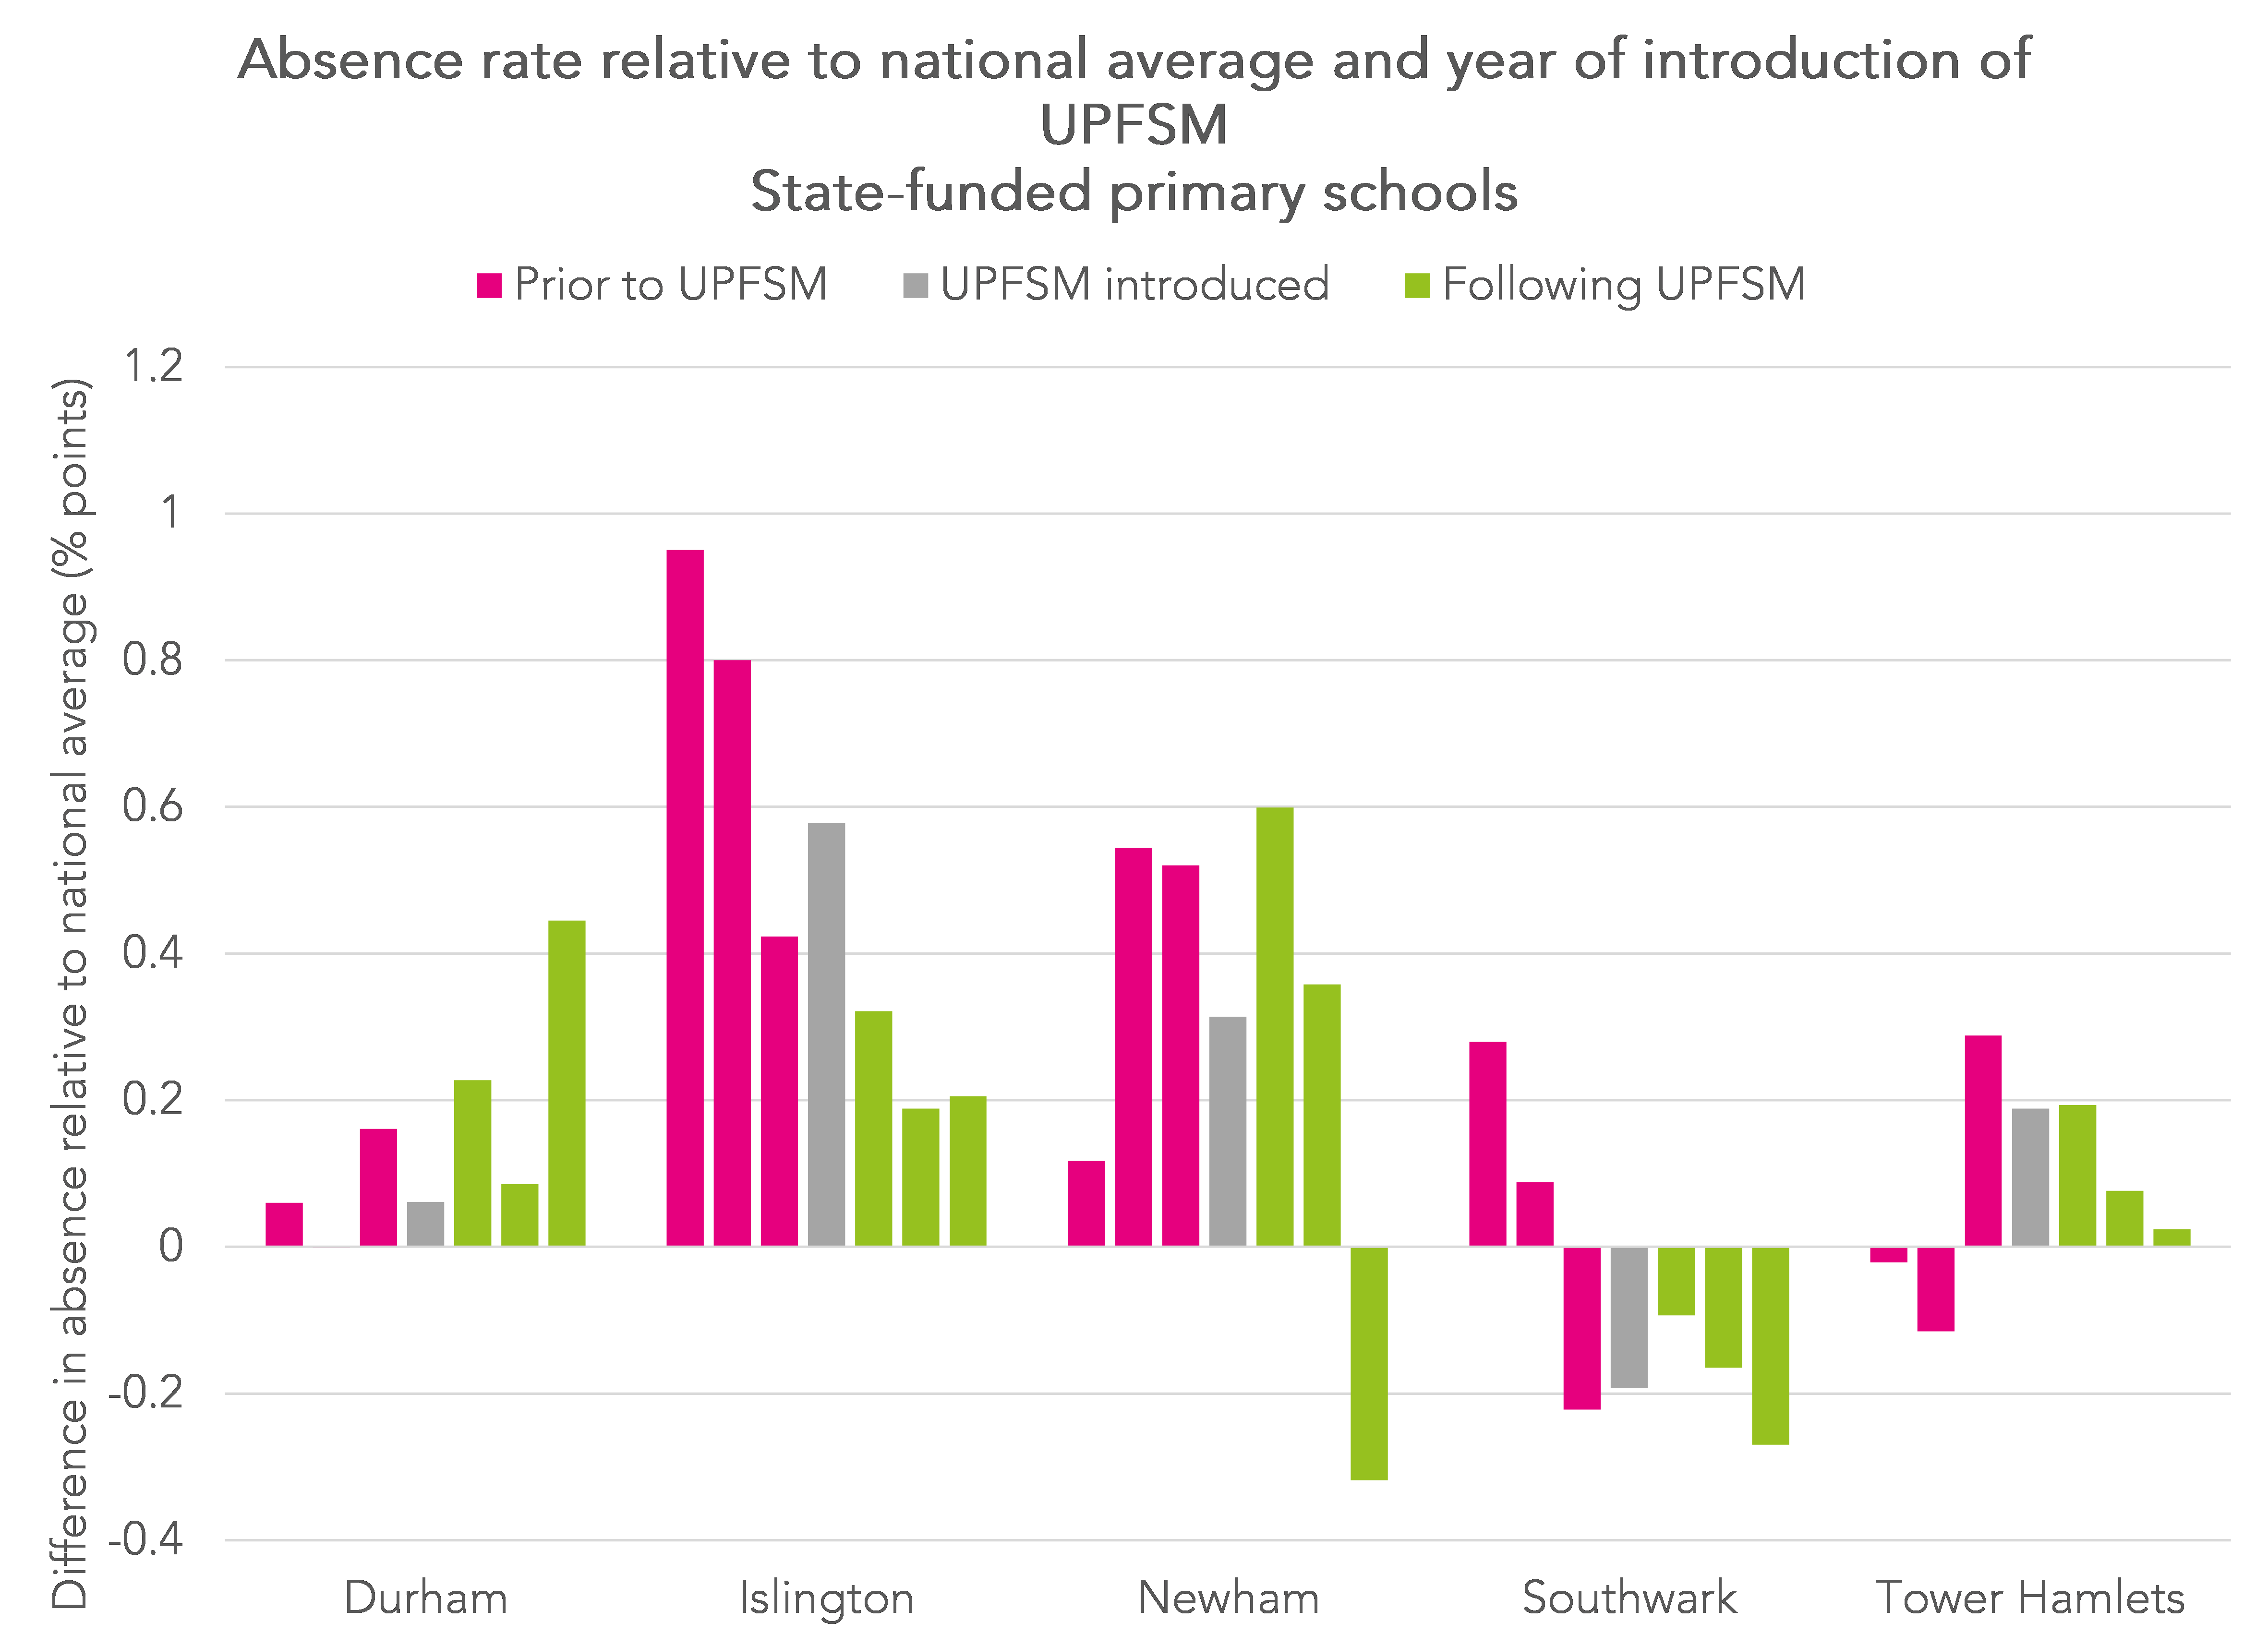
For example, the grey bar for Durham represents absence compared to the national average in 2009/10, the year UPFSM was introduced in Durham. But for Tower Hamlets, it relates to 2014/15.
The picture across each of the 5 LAs varies.
Absence in Durham was slightly above the national average prior to the introduction of UPFSM. It then improved (fell) in the year of introduction before tending to increase thereafter.
In Islington, absence was also above the national average but improving prior to the introduction of UPFSM. It increased in the year of introduction before tending to fall.
In Newham, absence was above the national average prior to the introduction of UPFSM. It fell in the year it was introduced but then increased again for two years before falling below the national average in the third year.
Southwark was slightly more unusual compared to the other LAs in that absence was falling prior to the introduction of UPFSM and was also below the national average the year before. Absence increased slightly in the year of introduction and the following year before falling again.
Finally, absence in Tower Hamlets increased in the 3 years prior to UPFSM, then fell slightly and tended to continue to fall.
Comparison to similar local authorities
What we really want to know is what would have happened in the 5 local authorities had UPFSM not been introduced.
We can’t observe this with any certainty so the best we can try and do is make some assumptions based on absence rates in other local authorities which didn’t introduce UPFSM.
We do this by identifying local authorities which exhibited similar rates of absence in the years prior to the introduction of UPFSM for each local authority. We use the synthetic control method which calculates a set of weights for each non-participating local authority (i.e. those that didn’t introduce UPFSM) such that the rate of absence mirrors as closely as possible the rate in a participating LA prior to the introduction of UPFSM.
The assumption we make is that, in the absence of UPFSM, the absence rate of each LA that introduced UPFSM would have continued to mirror the synthetic control group of LAs. We can then compare this to the actual absence rate.
As there are only three years of data prior to the introduction of the policy in Newham and Durham we leave these aside and present results for the other three.
Newham and Durham were in scope of an earlier DfE-commissioned evaluation. This found no impact on reducing absence.
Islington
The synthetic control group for Islington is formed (in decreasing order of importance) of Manchester, Southampton and Sandwell.
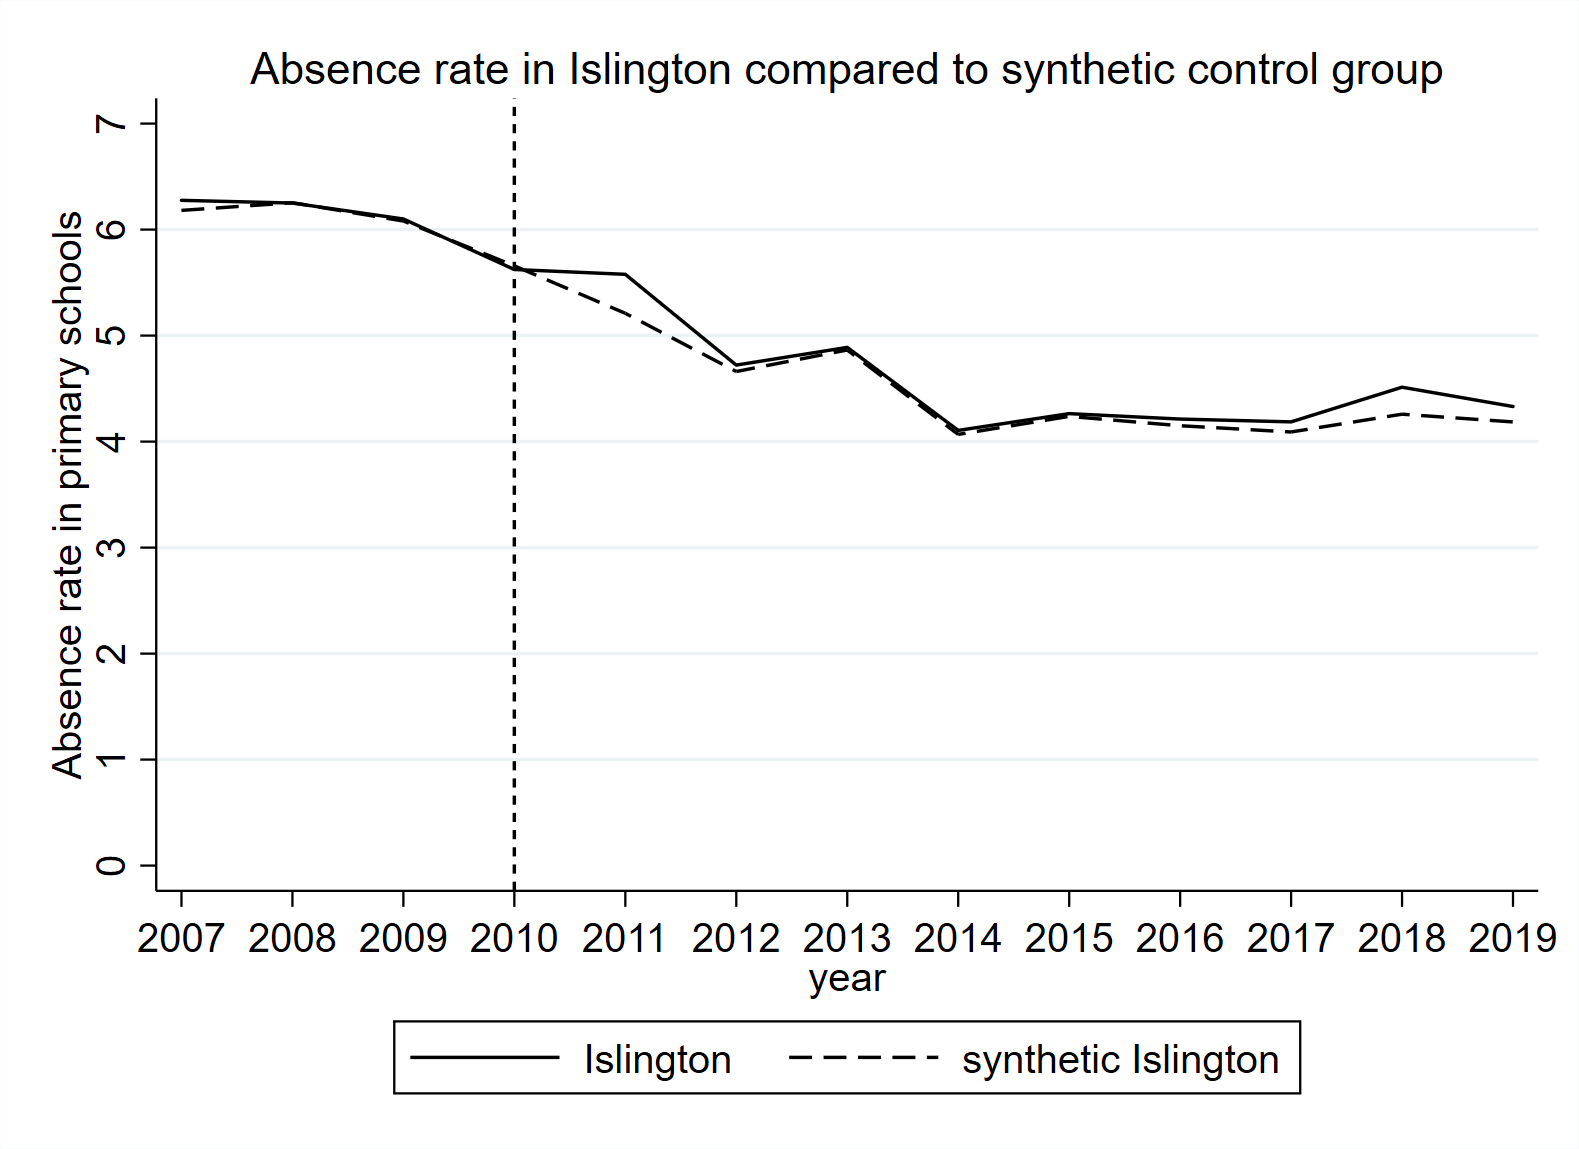
Absence increased in Islington relative to the control group in the year UPFSM was introduced in Islington. It has tended to remain slightly higher ever since.
Southwark
The synthetic control group for Southwark is formed (in decreasing order of importance) of Hackney, Brent, Hull, Isle of Wight, Leicester, South Tyneside and Bournemouth.
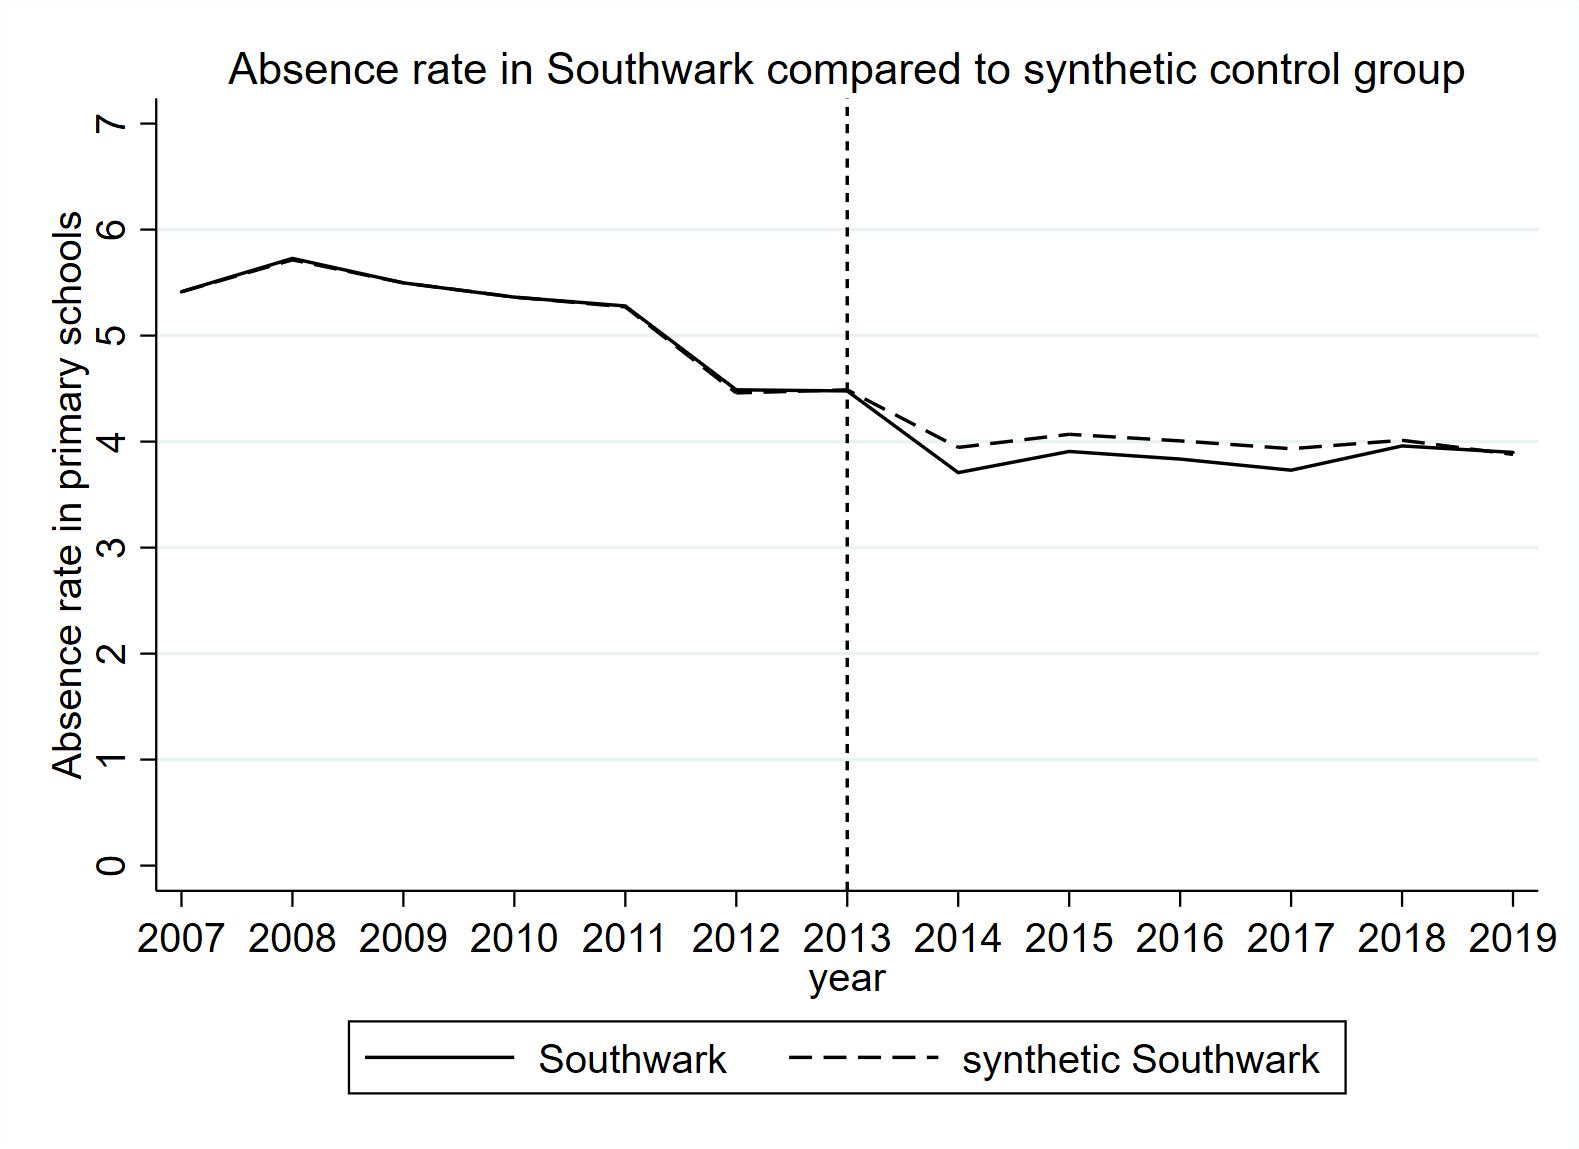
Here we see an improvement in absence relative to the control group when the policy is introduced.
Between 2014 and 2017, the difference was around 0.2 percentage points. This is equivalent to attending an extra half a day a week per pupil.
Tower Hamlets
The synthetic control group for Tower Hamlets is formed (in decreasing order of importance) of Barking and Dagenham, Camden, Lambeth, Enfield, Hull, South Tyneside and Stoke.
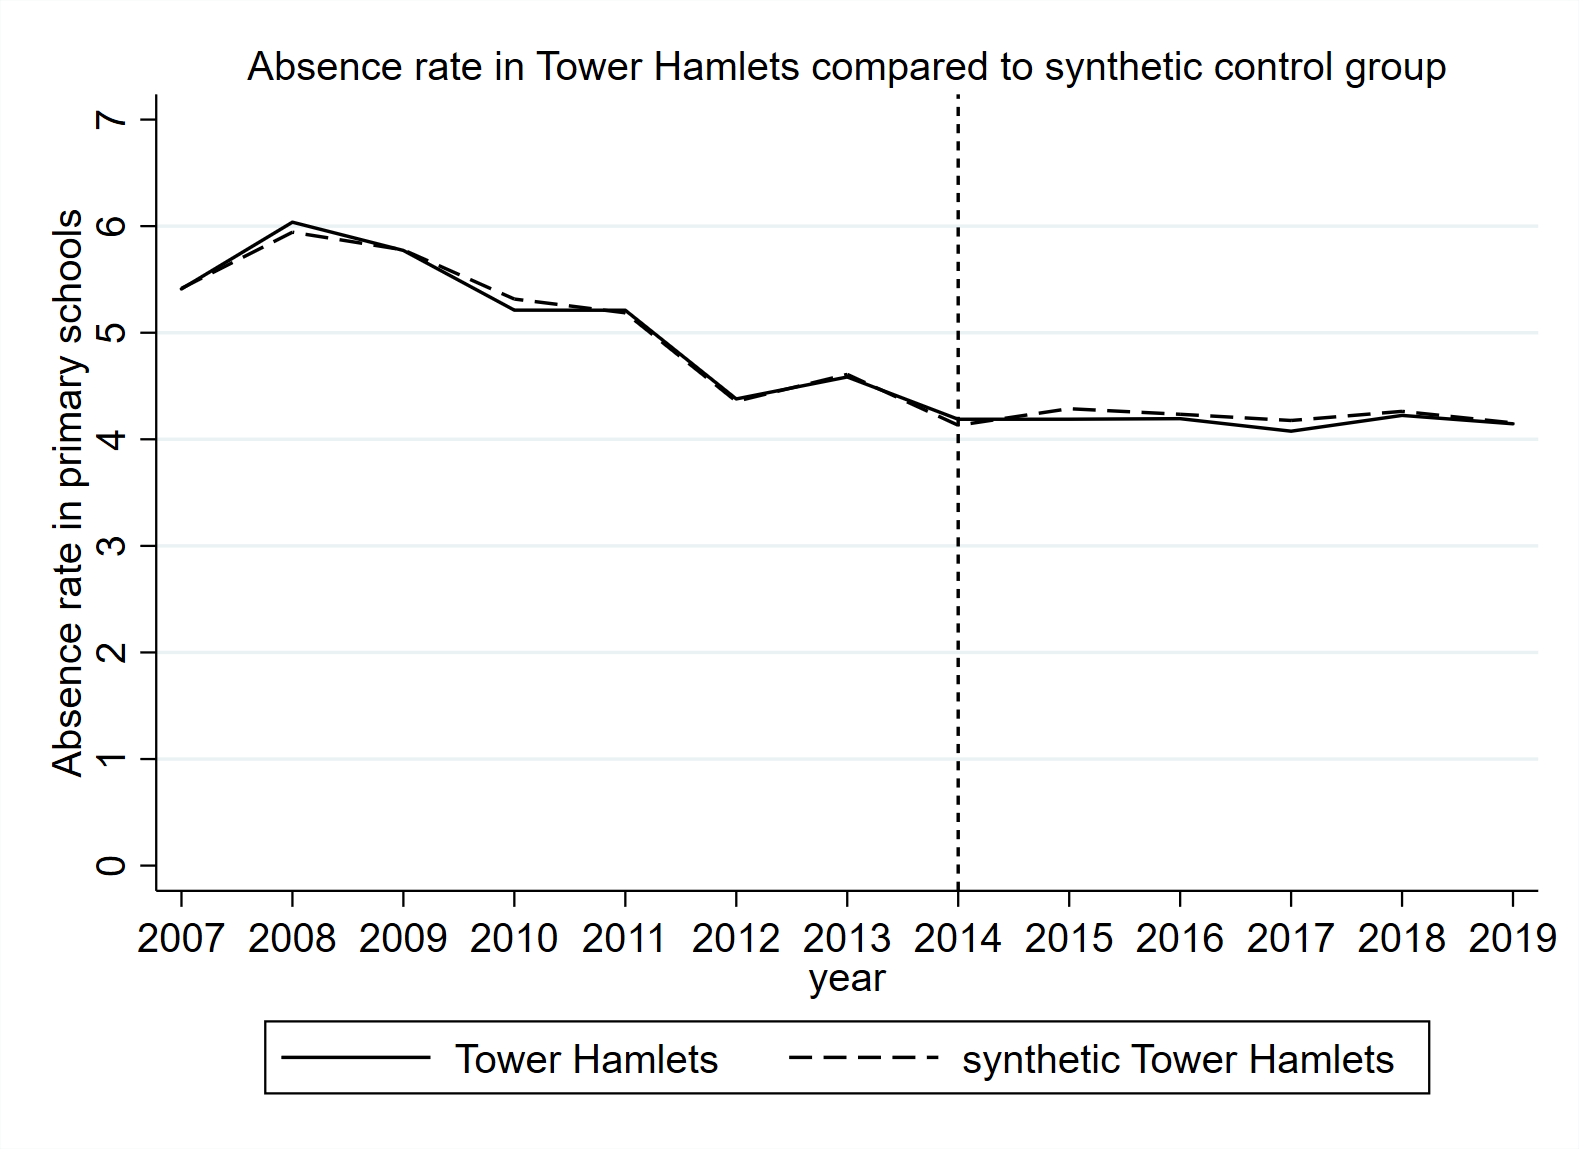
In the chart below, we see a very slight improvement in absence in Tower Hamlets relative to the synthetic control group after the introduction of UPFSM.
Summing up
There are caveats aplenty with this analysis.
Firstly, universal infant free school meals was introduced in September 2014. This may have affected the published attendance statistics of all local authorities. It would be worthwhile repeating the analysis just for Years 3 to 6.
Secondly, we have analysed data for the pre-pandemic period. Absence rates are much higher now, and perhaps UPFSM may have more of an effect now.
Finally, we assume that absence in each LA that introduced UPFSM would have followed the same trends as their synthetic control groups. This is an untestable assumption. It could be that some authorities were more or less susceptible to localized issues affecting absence (e.g. the outbreak of Swine Flu in 2009, which affected some areas more than others).
These limitations notwithstanding, the evidence presented for three local authorities is fairly mixed.
At best, absence improved slightly in Southwark by around 0.2 percentage points, equivalent to pupils attending (almost) an extra half day per year. This might not sound much, but an absence rate of 4% indicates being absent for 15 sessions (7.5 days) per year. In that context, an improvement of half a day could be worthwhile.
On the other hand, there was no improvement in absence rates in Islington compared to their synthetic control group when it introduced UPFSM.
Want to stay up-to-date with the latest research from FFT Education Datalab? Sign up to Datalab’s mailing list to get notifications about new blogposts, or to receive the team’s half-termly newsletter.


Leave A Comment