Exclusions (and suspensions) data for the 2022/23 academic year (that’s right, last year) is due to be published in July.
By October last year, we’d got a bit impatient so tried to use attendance data we’d collected from schools to gauge whether the increase in exclusions and suspensions observed in 2021/22 continued.
We now return to this to see whether suspensions and exclusions increased again in the Autumn term this year.
Data
Briefly, pupils who remain on the school roll but who have been suspended or permanently excluded are recorded in the attendance register using code E. If the exclusion is for 6 days or more, alternative provision is supposed to be arranged from the 6th day.
We use Autumn term 2023/24 attendance data collected from almost 10,000 schools subscribing to FFT Attendance Tracker. We then identify spells of absence recorded as code E. Counting spells gives us an approximate total number of exclusions and suspensions.
What we cannot do is distinguish between spells that are due to suspension and spells that are due to exclusion (or more accurately, spells that will result in due course in permanent exclusion).
Comparing our method to published statistics
Since we published our blog covering the 2022/23 academic year, DfE published its exclusion statistics for the Autumn term that year. We can therefore compare our calculations to theirs.
The figures we produce are equivalent to the sum of the permanent exclusion rate and the suspension rate, in other words the total number of exclusions and suspensions divided by the total number of pupils.
We show our calculated figures for the Autumn term 2022/23 alongside the published DfE figures in the chart below.

Our figures are pretty close to DfE figures, generally within 0.2 percentage points for each year group.
The increase in suspensions in 2023/24
Repeating our methodology for 2023/24, we see a notable increase in suspensions and exclusions.
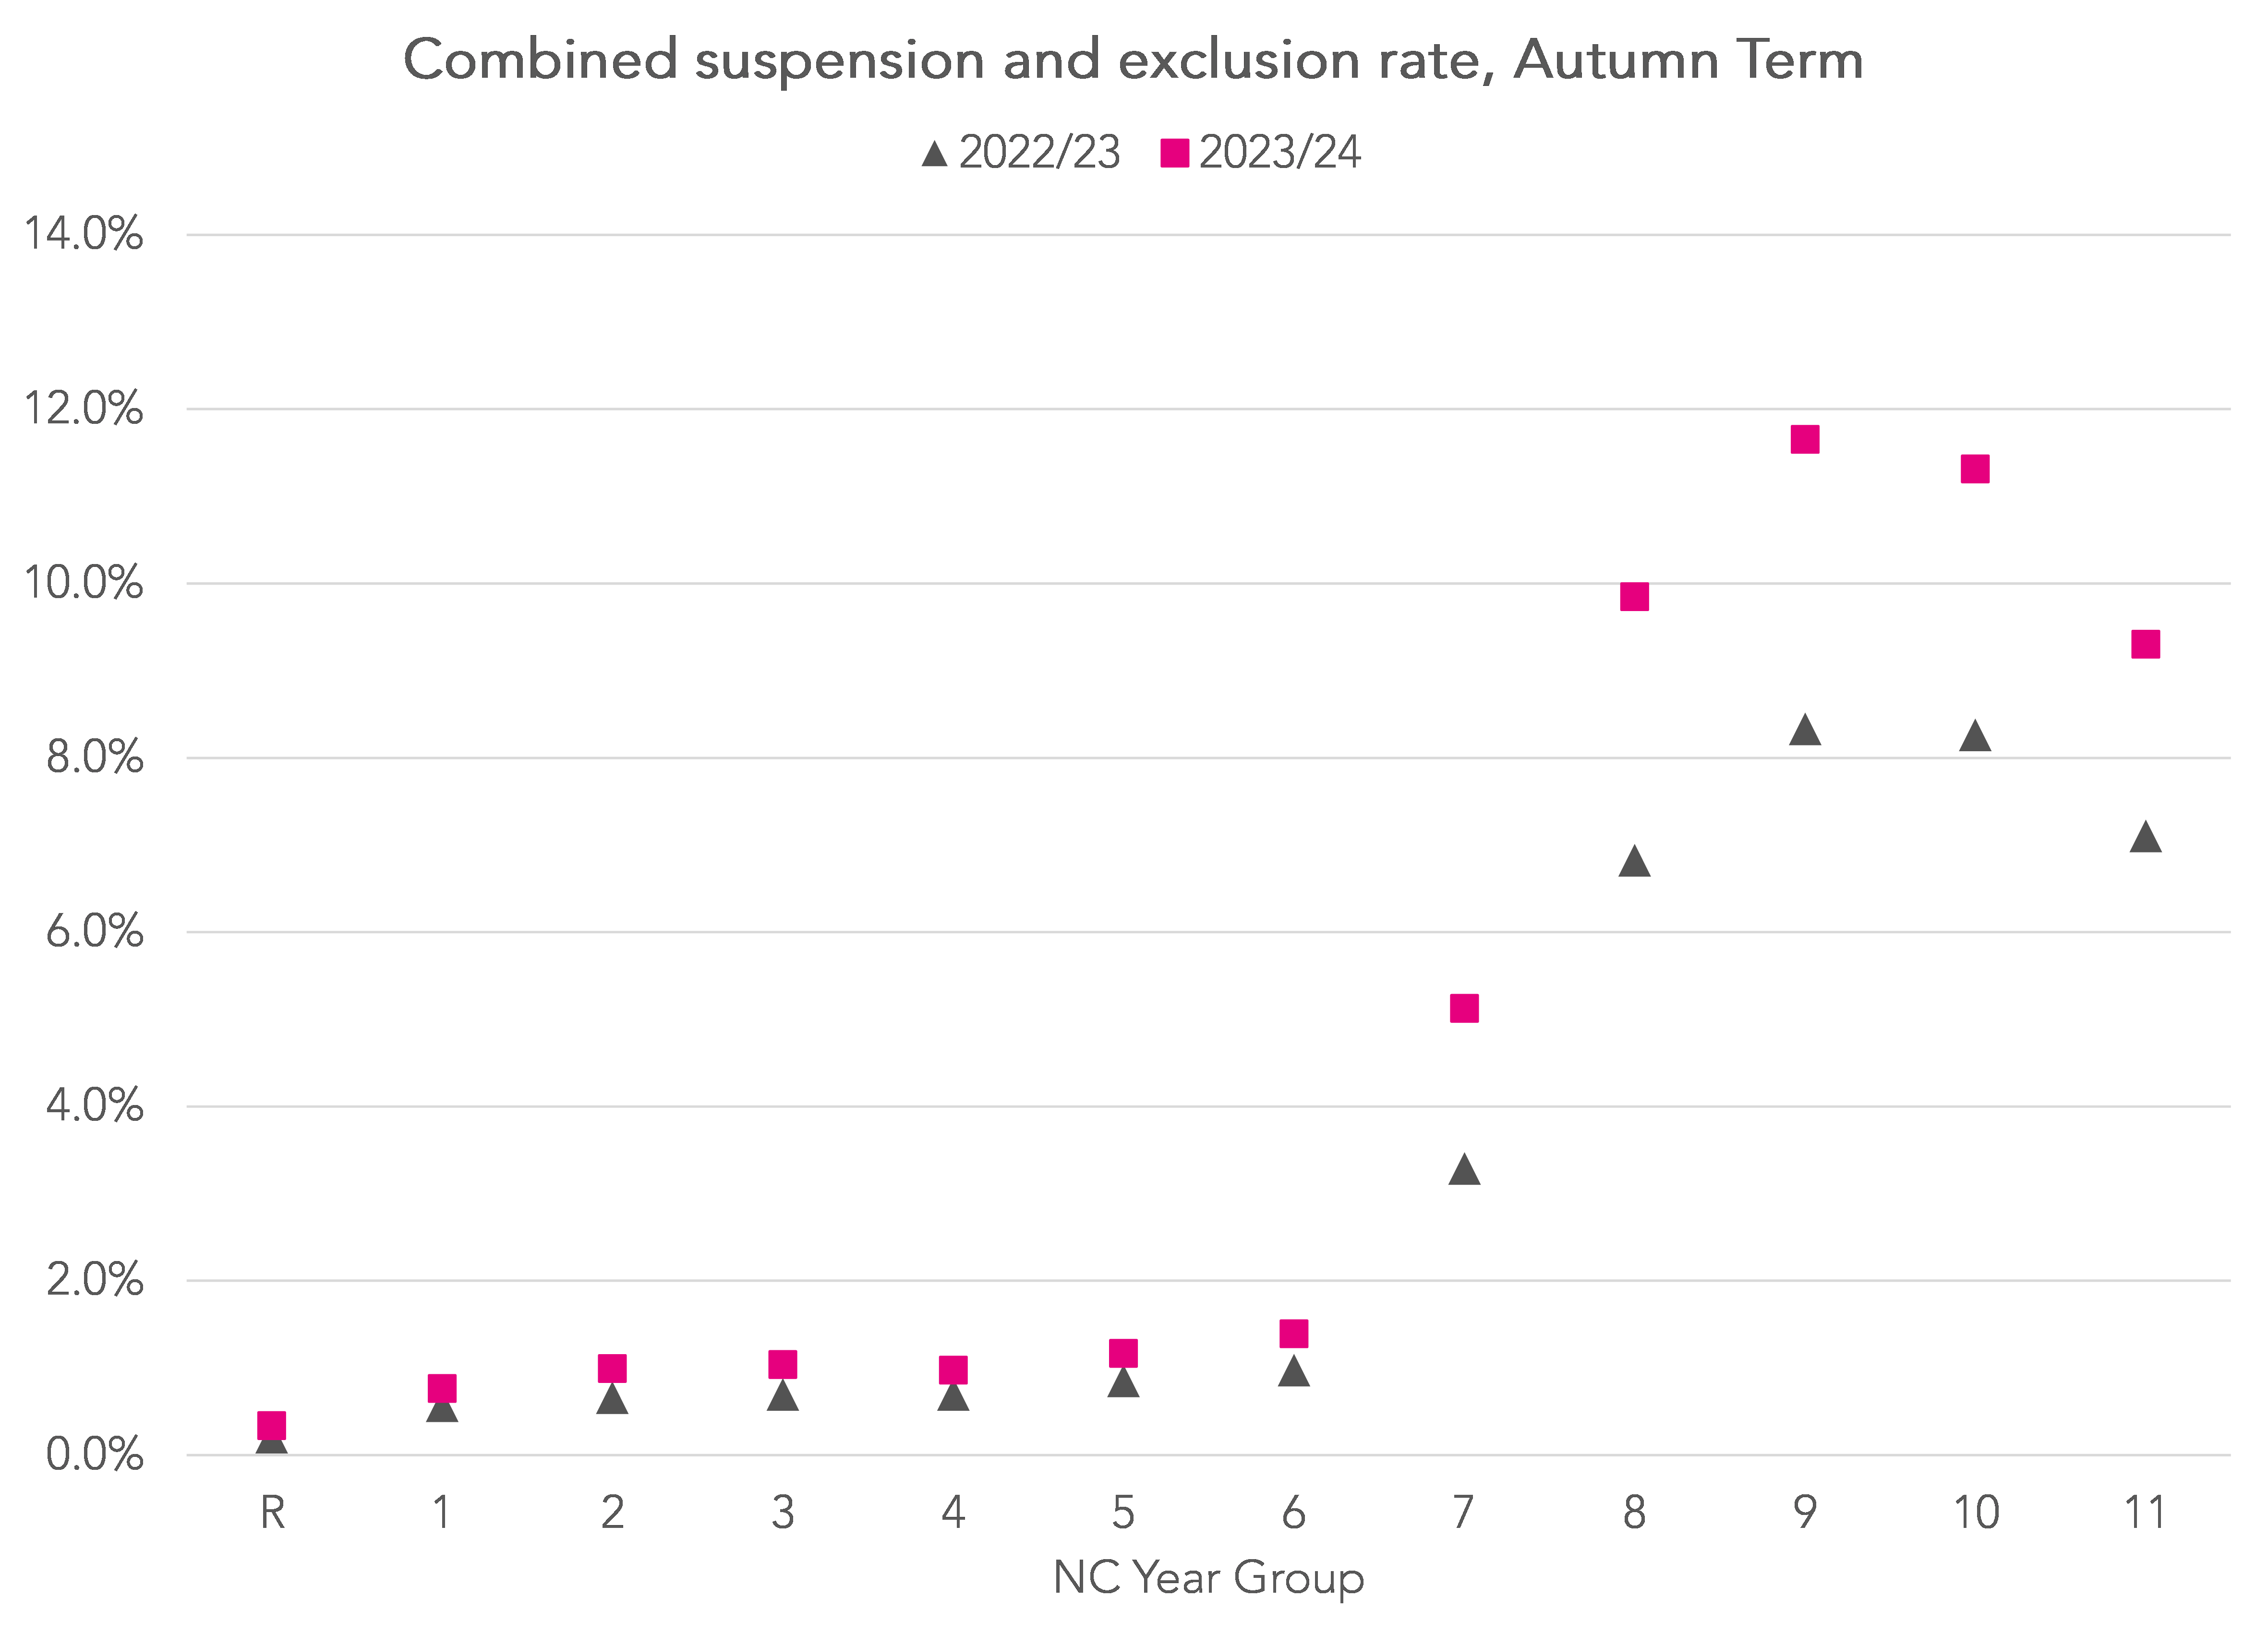
For example, the suspension/ exclusion rate for Year 9 in 2022/23 stood at 8.3%. In 2023/24 it increased to 11.7%, an increase of 3.4% percentage points or a 40% increase in suspensions.
For Year 7 pupils, there was a smaller absolute increase (from a lower base) of 1.8 percentage points but a larger relative increase – a 55% increase in suspensions.
We see a similar picture if we summarise the percentage of pupils who are suspended or excluded at least once.

Whereas in the previous chart the highest rate was among Year 9 pupils, this time the highest rate is among Year 10 pupils.
Among Year 9 pupils, 5.4% were excluded or suspended at least once this year compared to 4.3% last year, an absolute increase of 1.1 percentage points and a relative increase of 25%.
This relative increase is lower than that shown in the previous chart, which would tend to suggest a higher number of exclusions/ suspensions per pupil.
Summing up
Published DfE statistics for the Autumn term 2022/23 showed an increase in exclusions and suspensions compared to the previous year.
Analysis of attendance registers for the Autumn term 2023/24 suggests a further large increase. Increases in suspensions and exclusions of 6 days or more will put additional pressure on places in alternative provision.
Eventually, DfE will publish official statistics for the Autumn term. Until then, our calculations are very much provisional.
It is always disconcerting to see a large increase in a regularly measured outcome. We know that our figures for 2022/23 were very close to those ultimately published by DfE and we have adopted the same methodology this year.
But it is always possible that some undiscovered gremlin has affected our calculations for this year and the increase is not as sharp as we are suggesting here. We will issue a correction should this prove to be the case.
Want to stay up-to-date with the latest research from FFT Education Datalab? Sign up to Datalab’s mailing list to get notifications about new blogposts, or to receive the team’s half-termly newsletter.


Leave A Comment