Last week the Department for Education unveiled a raft of new measures related to attendance to be introduced at the start of the next academic year. Schools Week published a handy round-up of the key points.
Some of these could be quite useful. A new attendance code (C2) for pupils on part-time timetables would produce better data on its prevalence (we once had a go at estimating it). Schools must also record the nature of the educational provision received by pupils who are educated off site (attendance code B).
But the announcements that have attracted most attention are those relating to penalty notices (fines) for absence.
Firstly, the fine has increased from £60 to £80. A second fine, if issued for further unauthorised absence, will be charged at £160.
Secondly, a new national fine threshold has been introduced. This is 10 (or more) sessions of unauthorised absence within a rolling 10 week period.
We thought we’d take a look at some data to see how many pupils are at risk of triggering this threshold (though it doesn’t necessarily mean fines will be issued as a result).
The answer is quite a few.
Data
We use data from almost 10,000 schools that subscribe to FFT Attendance Tracker for the 2022/23 school year.
For each pupil in Reception to Year 11, we calculate the number of sessions of unauthorised absence each week.
We then sum the number of these absences over each 10 week period. We don’t consider periods that overlap with either the previous or following academic year although DfE proposals do so. Consequently, we will be under-estimating the number who would have been risk had the proposals been in place in 2022/23.
The measures we show below are the numbers of pupils with at least 10 unauthorised absences over any 10 week period (ignoring holidays). Some pupils trigger this threshold more than once (i.e. have more than one non-overlapping 10 week period in which they were absent for unauthorised reasons for at least 10 sessions). We show data for pupils who fall below the threshold a) at least once and b) at least twice during 2022/23.
Pupils at risk by year group
In the chart below, we show the percentage of pupils who would have fallen below the new threshold in 2022/23 by year group.
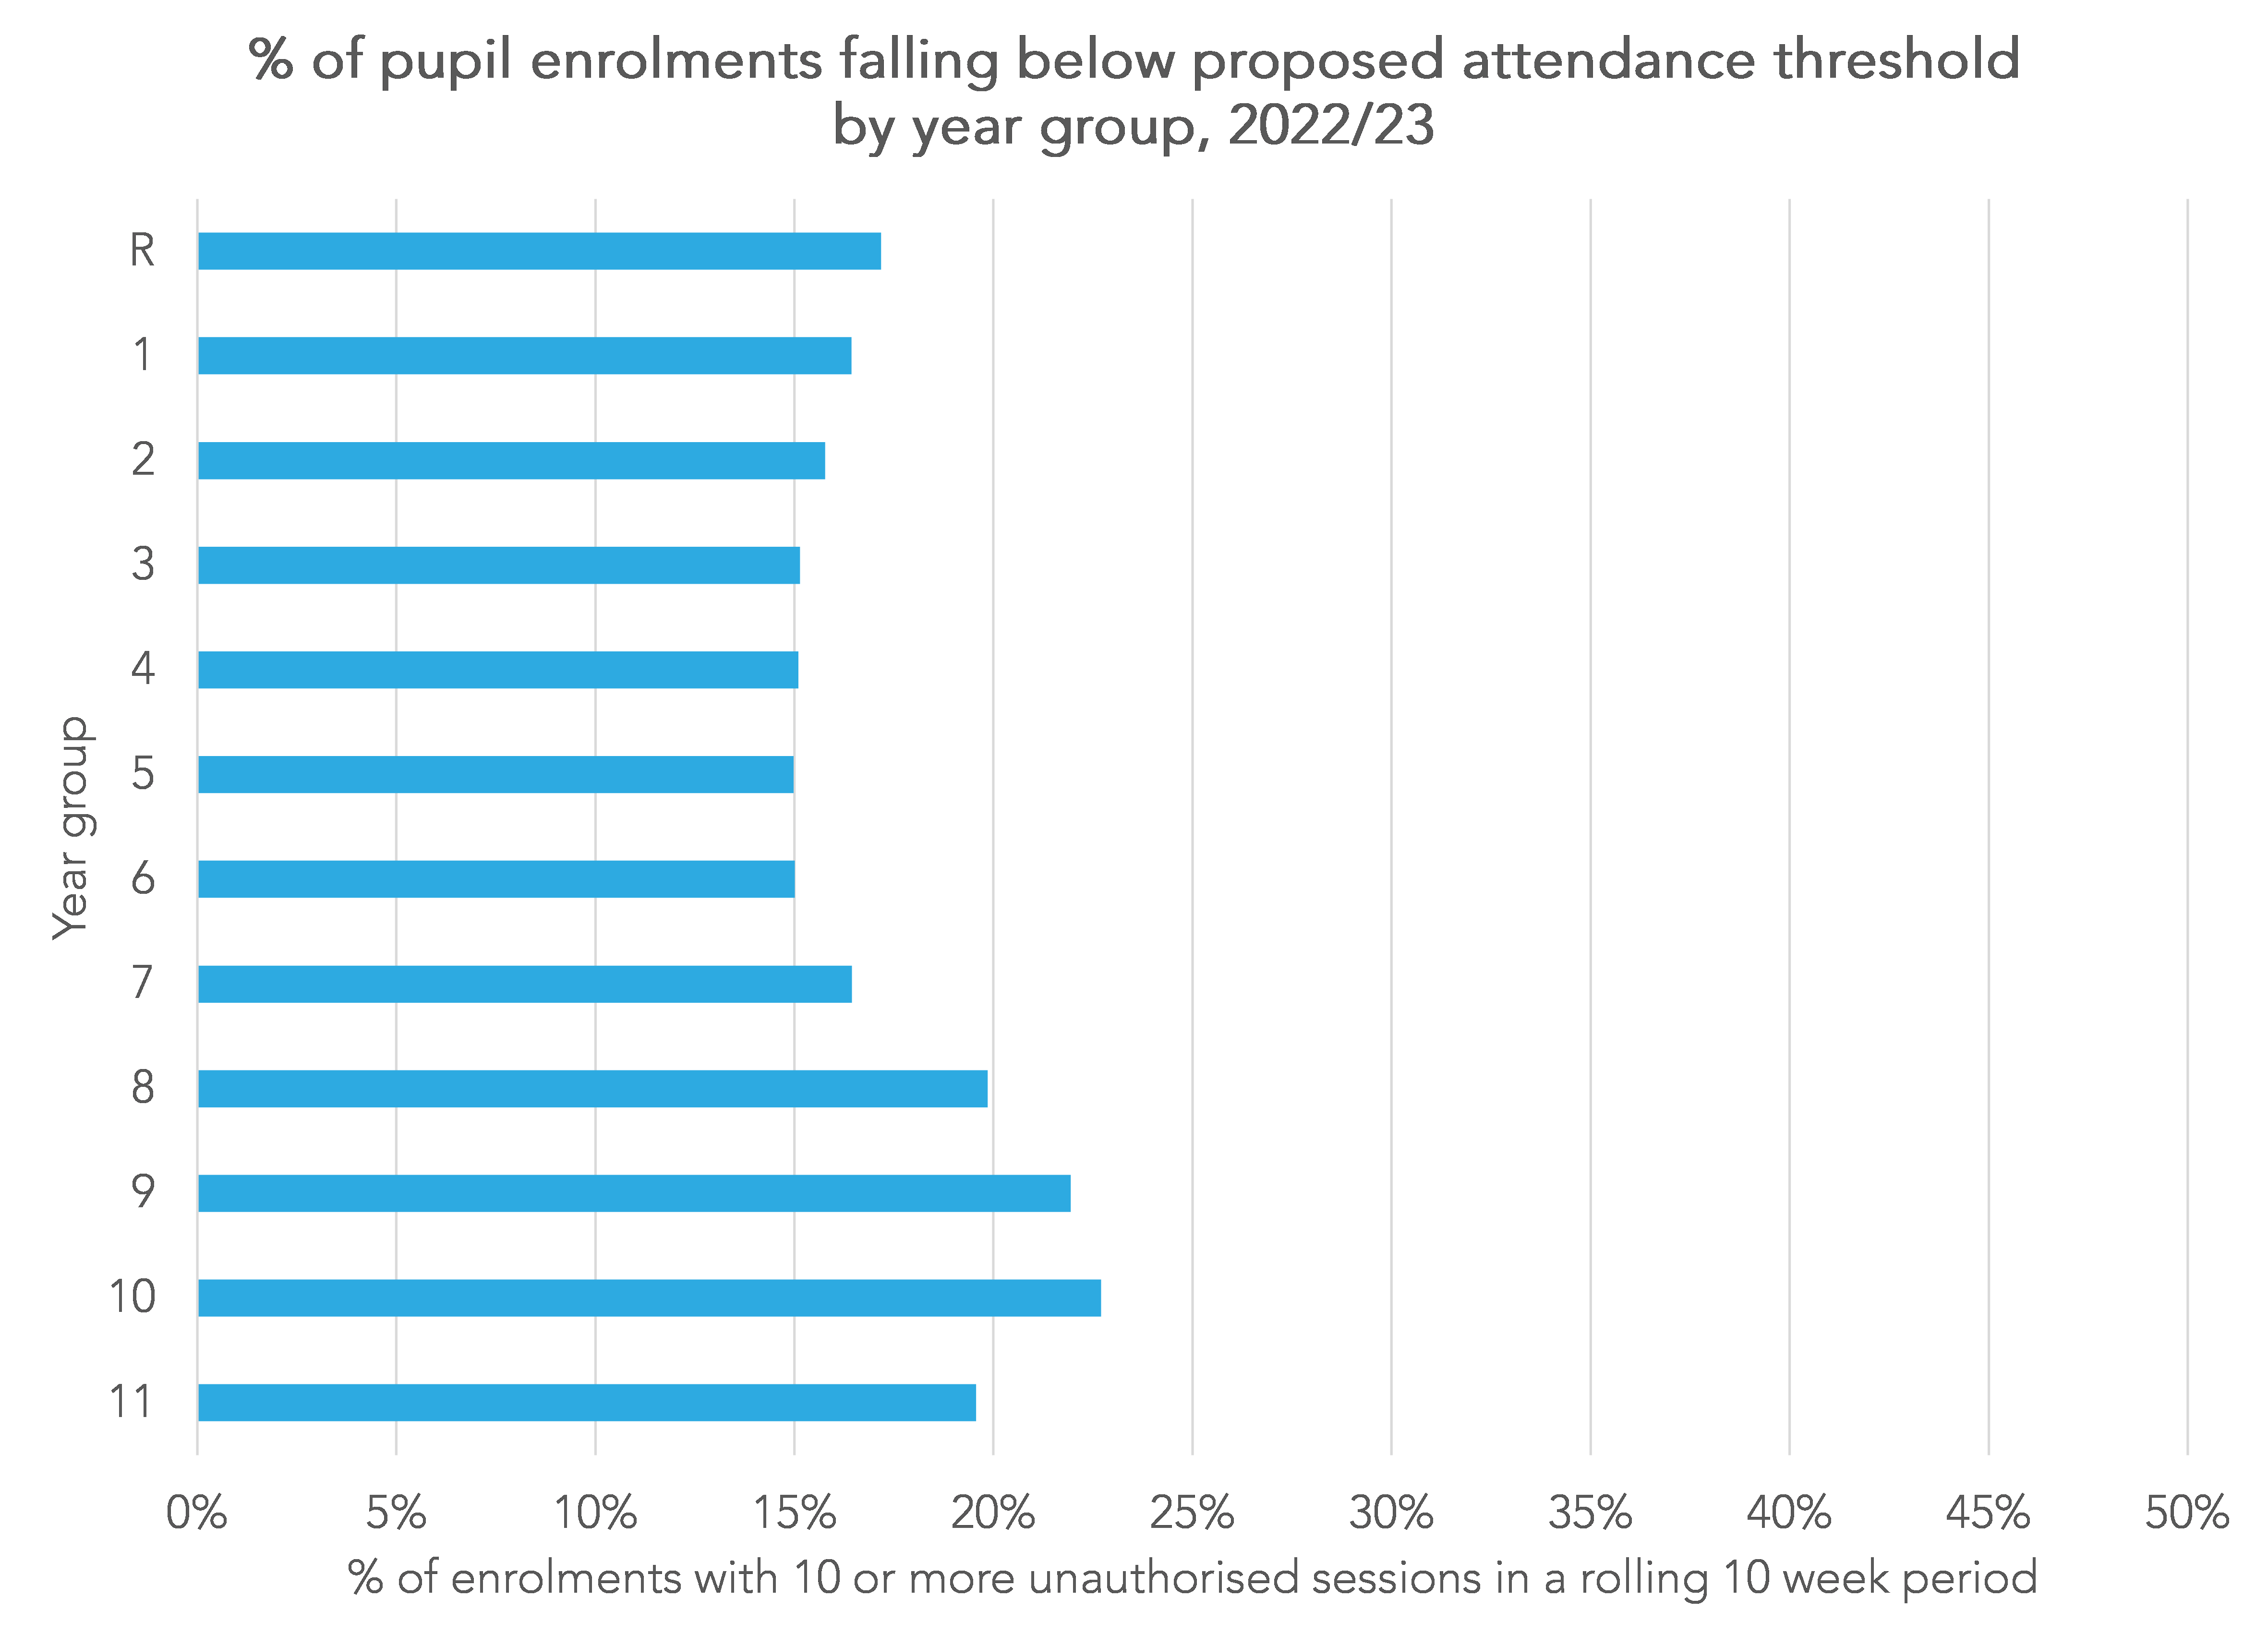
Figures range from 15% for pupils in Years 3 to 6 up to 23% of Year 10 pupils.
In fact, most of the Year 10 pupils who fell below the threshold at least once fell below the threshold more than once.
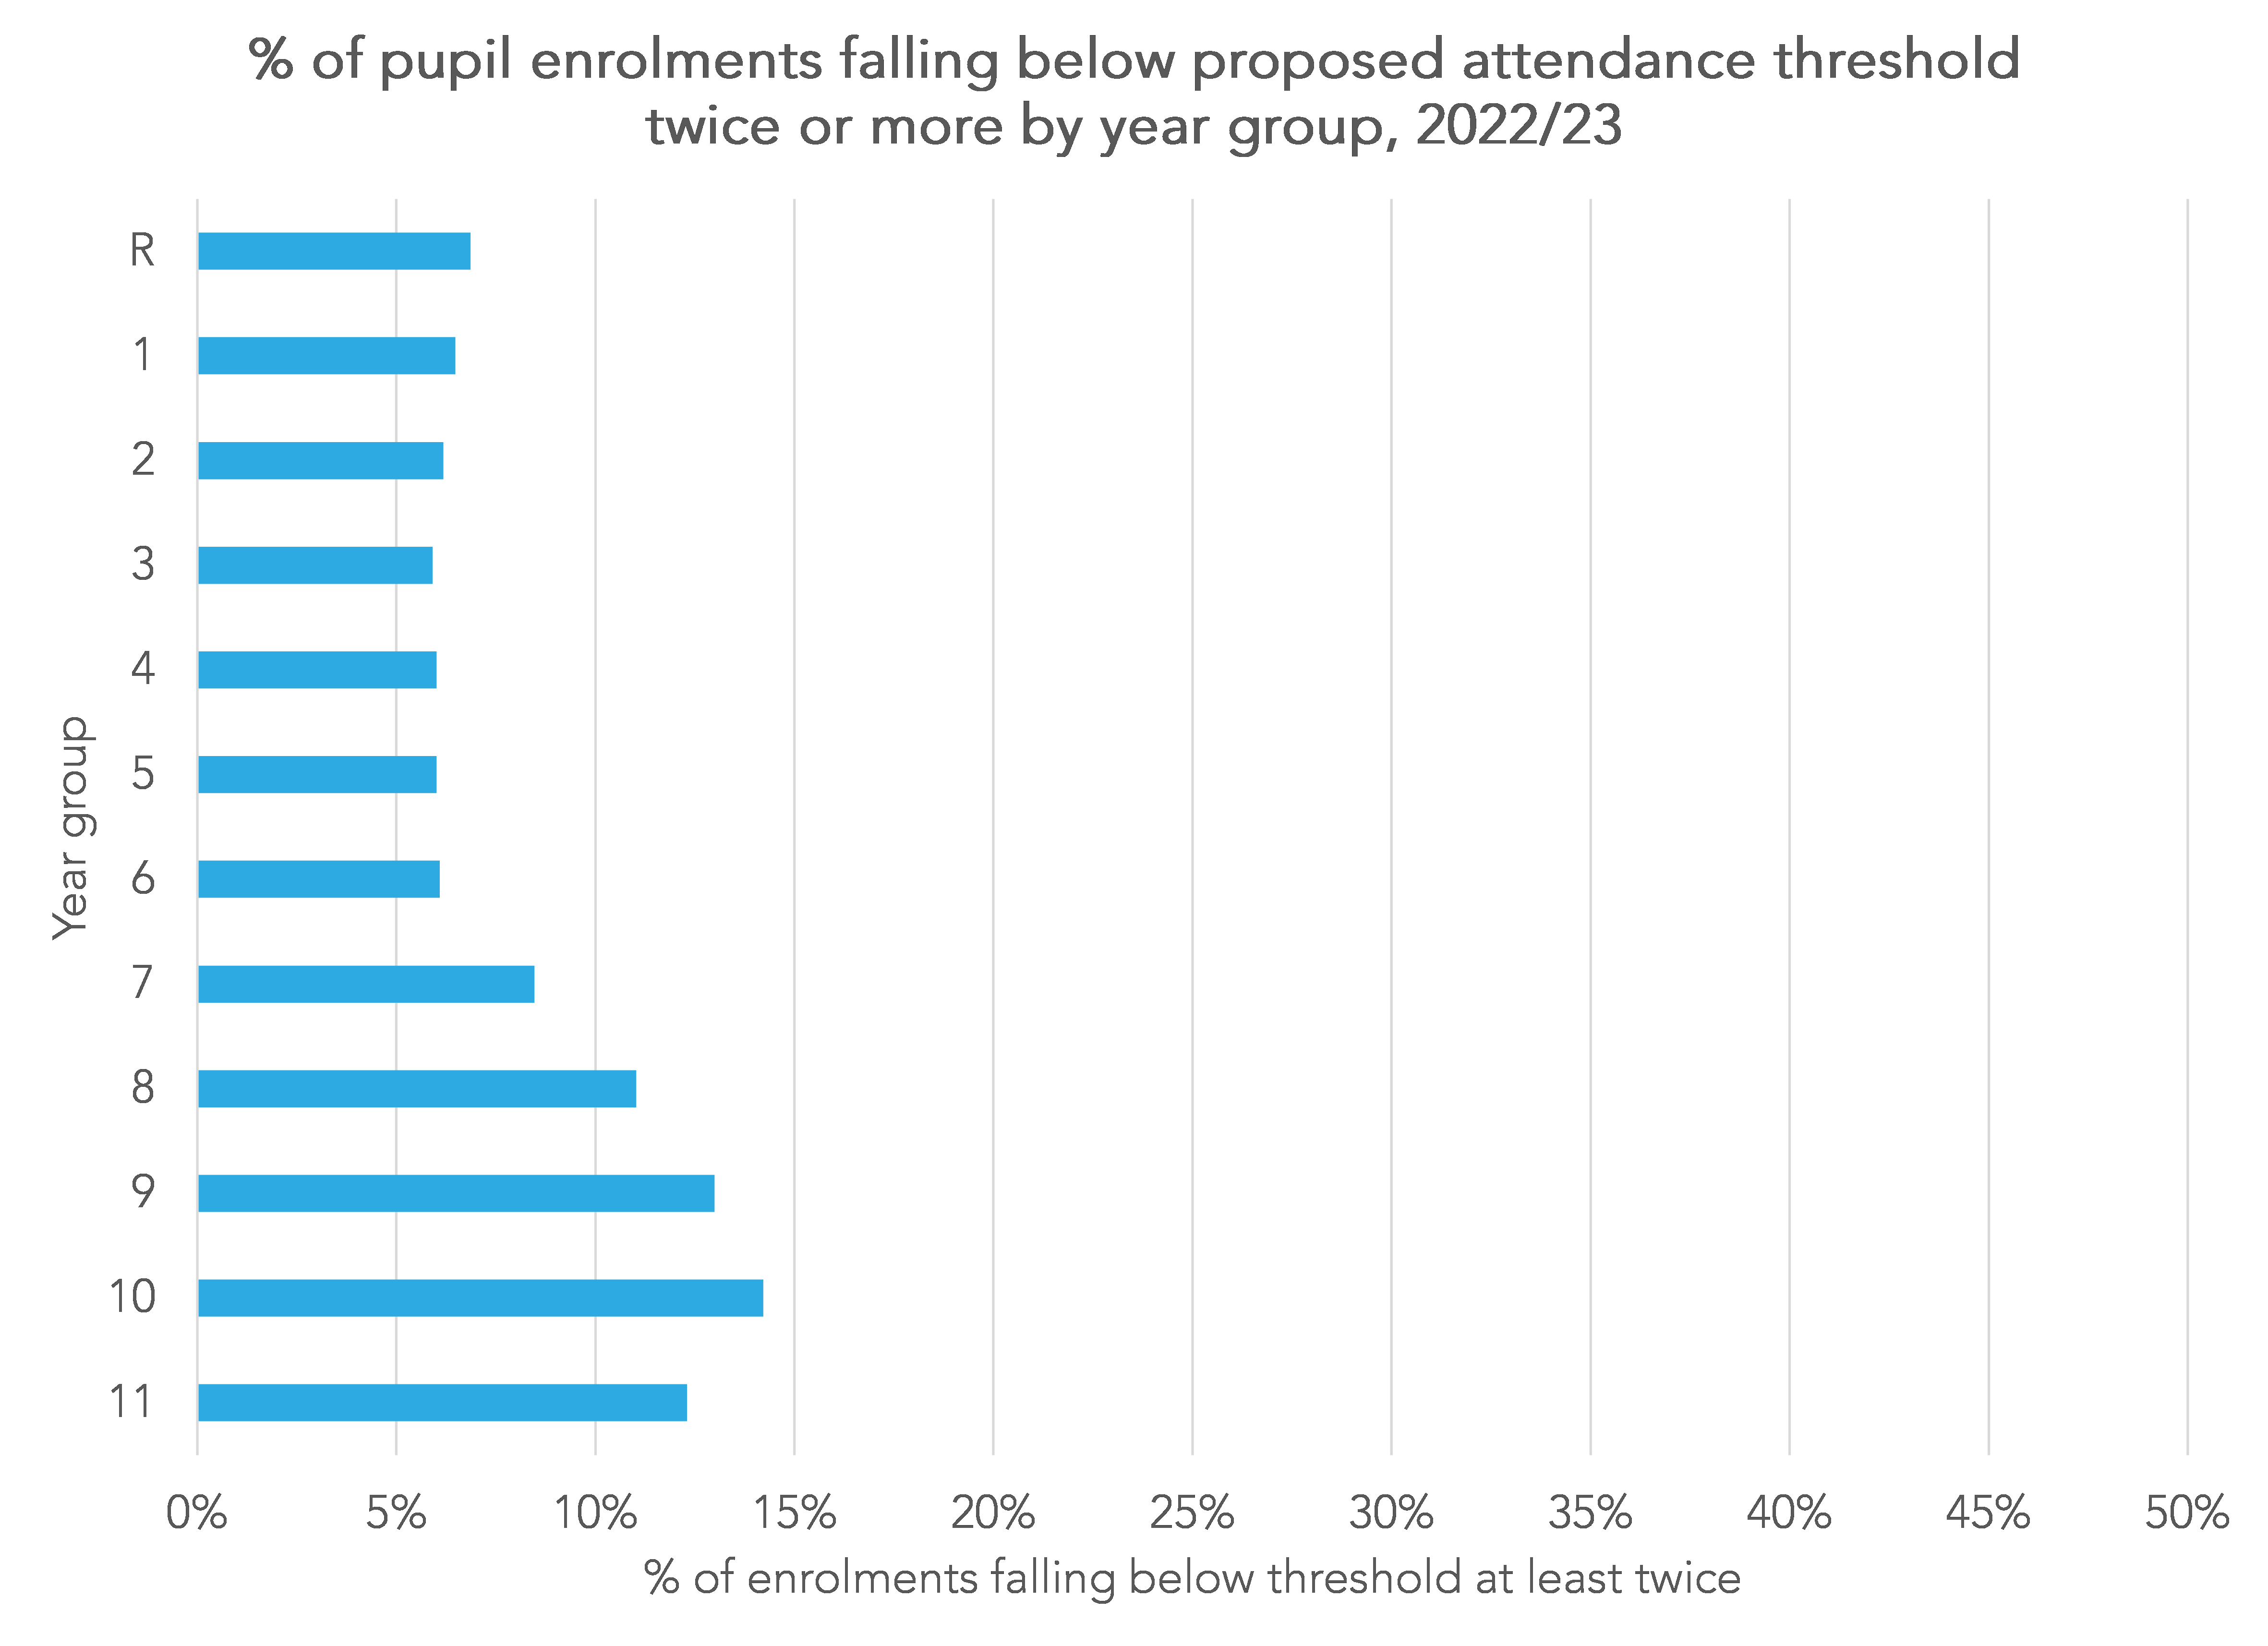
Figures for pupils who fell below the threshold more than once range from 6% in Years 3 to 6 up to 14% of Year 10 pupils.
Disadvantage
We repeat the analysis, this time breaking the figures down according to whether pupils are classified as disadvantaged (eligible for free school meals in the past 6 years) or not.
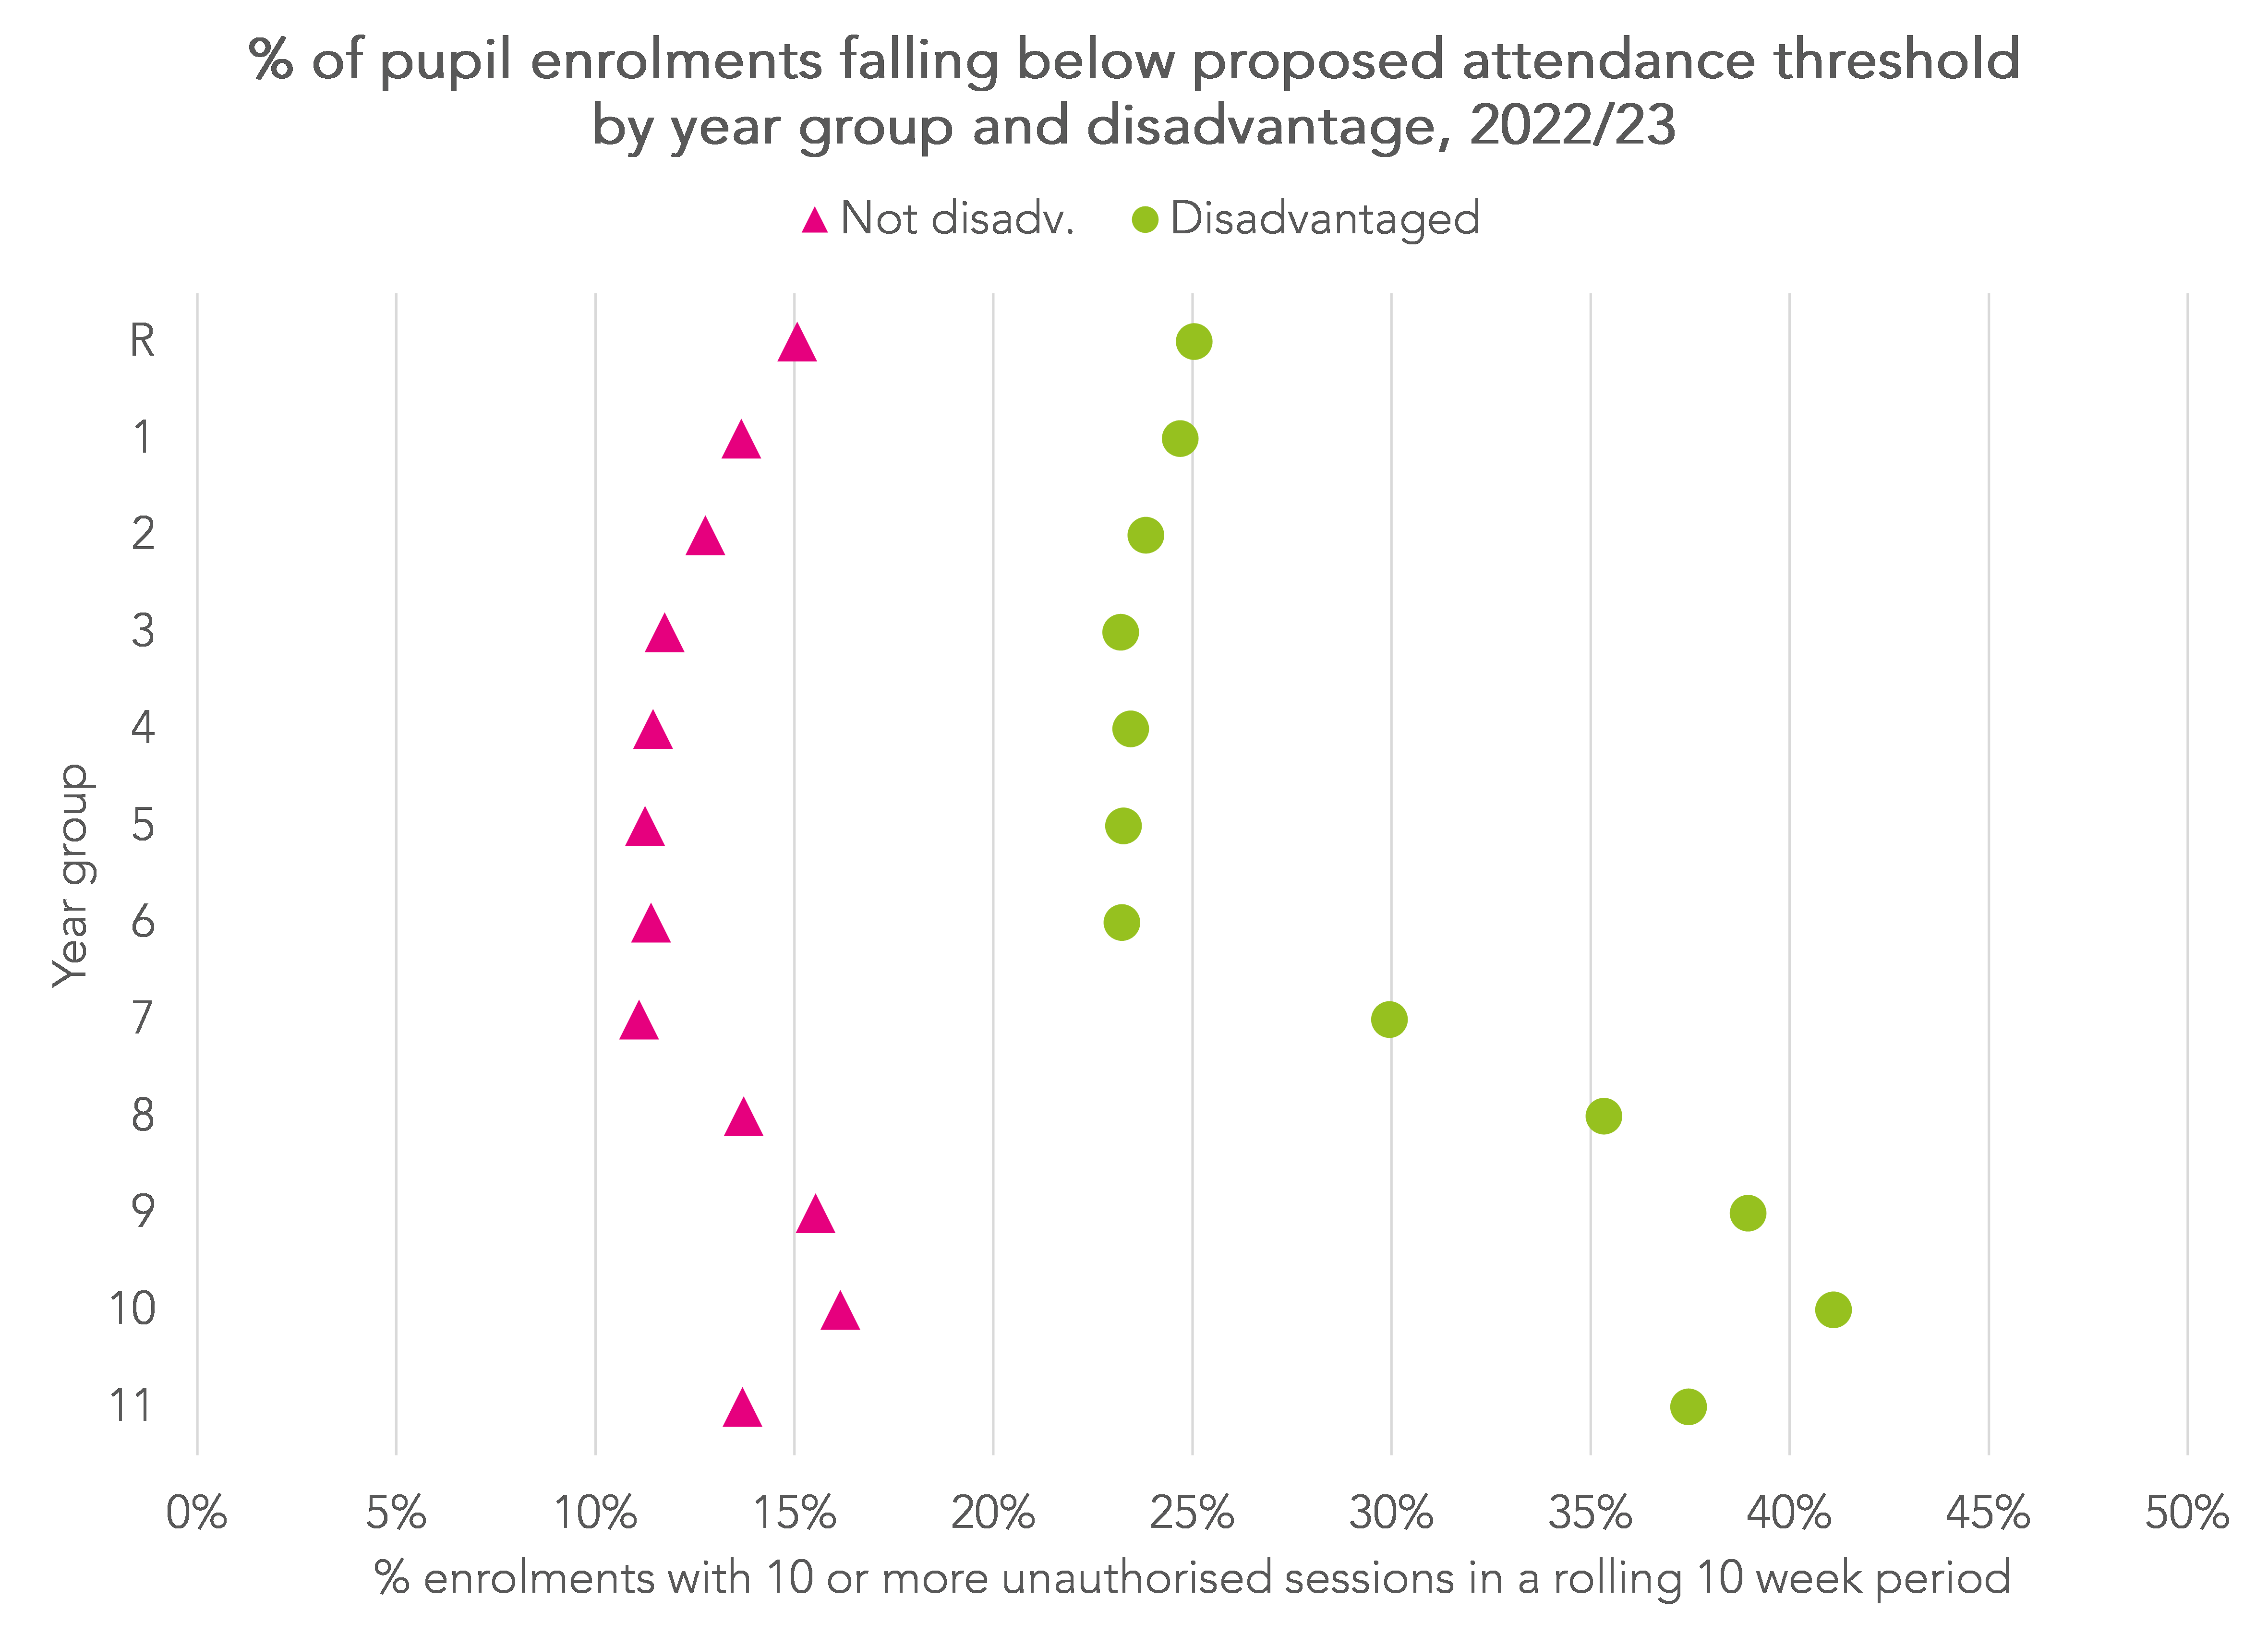
This reveals some stark differences, particularly for secondary age pupils.
Over 40% of disadvantaged pupils in Year 10 would have been at risk of being fined had the proposals been in place in 2022/23. This compares to 16% of their peers.
Special educational needs
Finally, we examine how prevalence varies by year group and special educational needs (SEN).
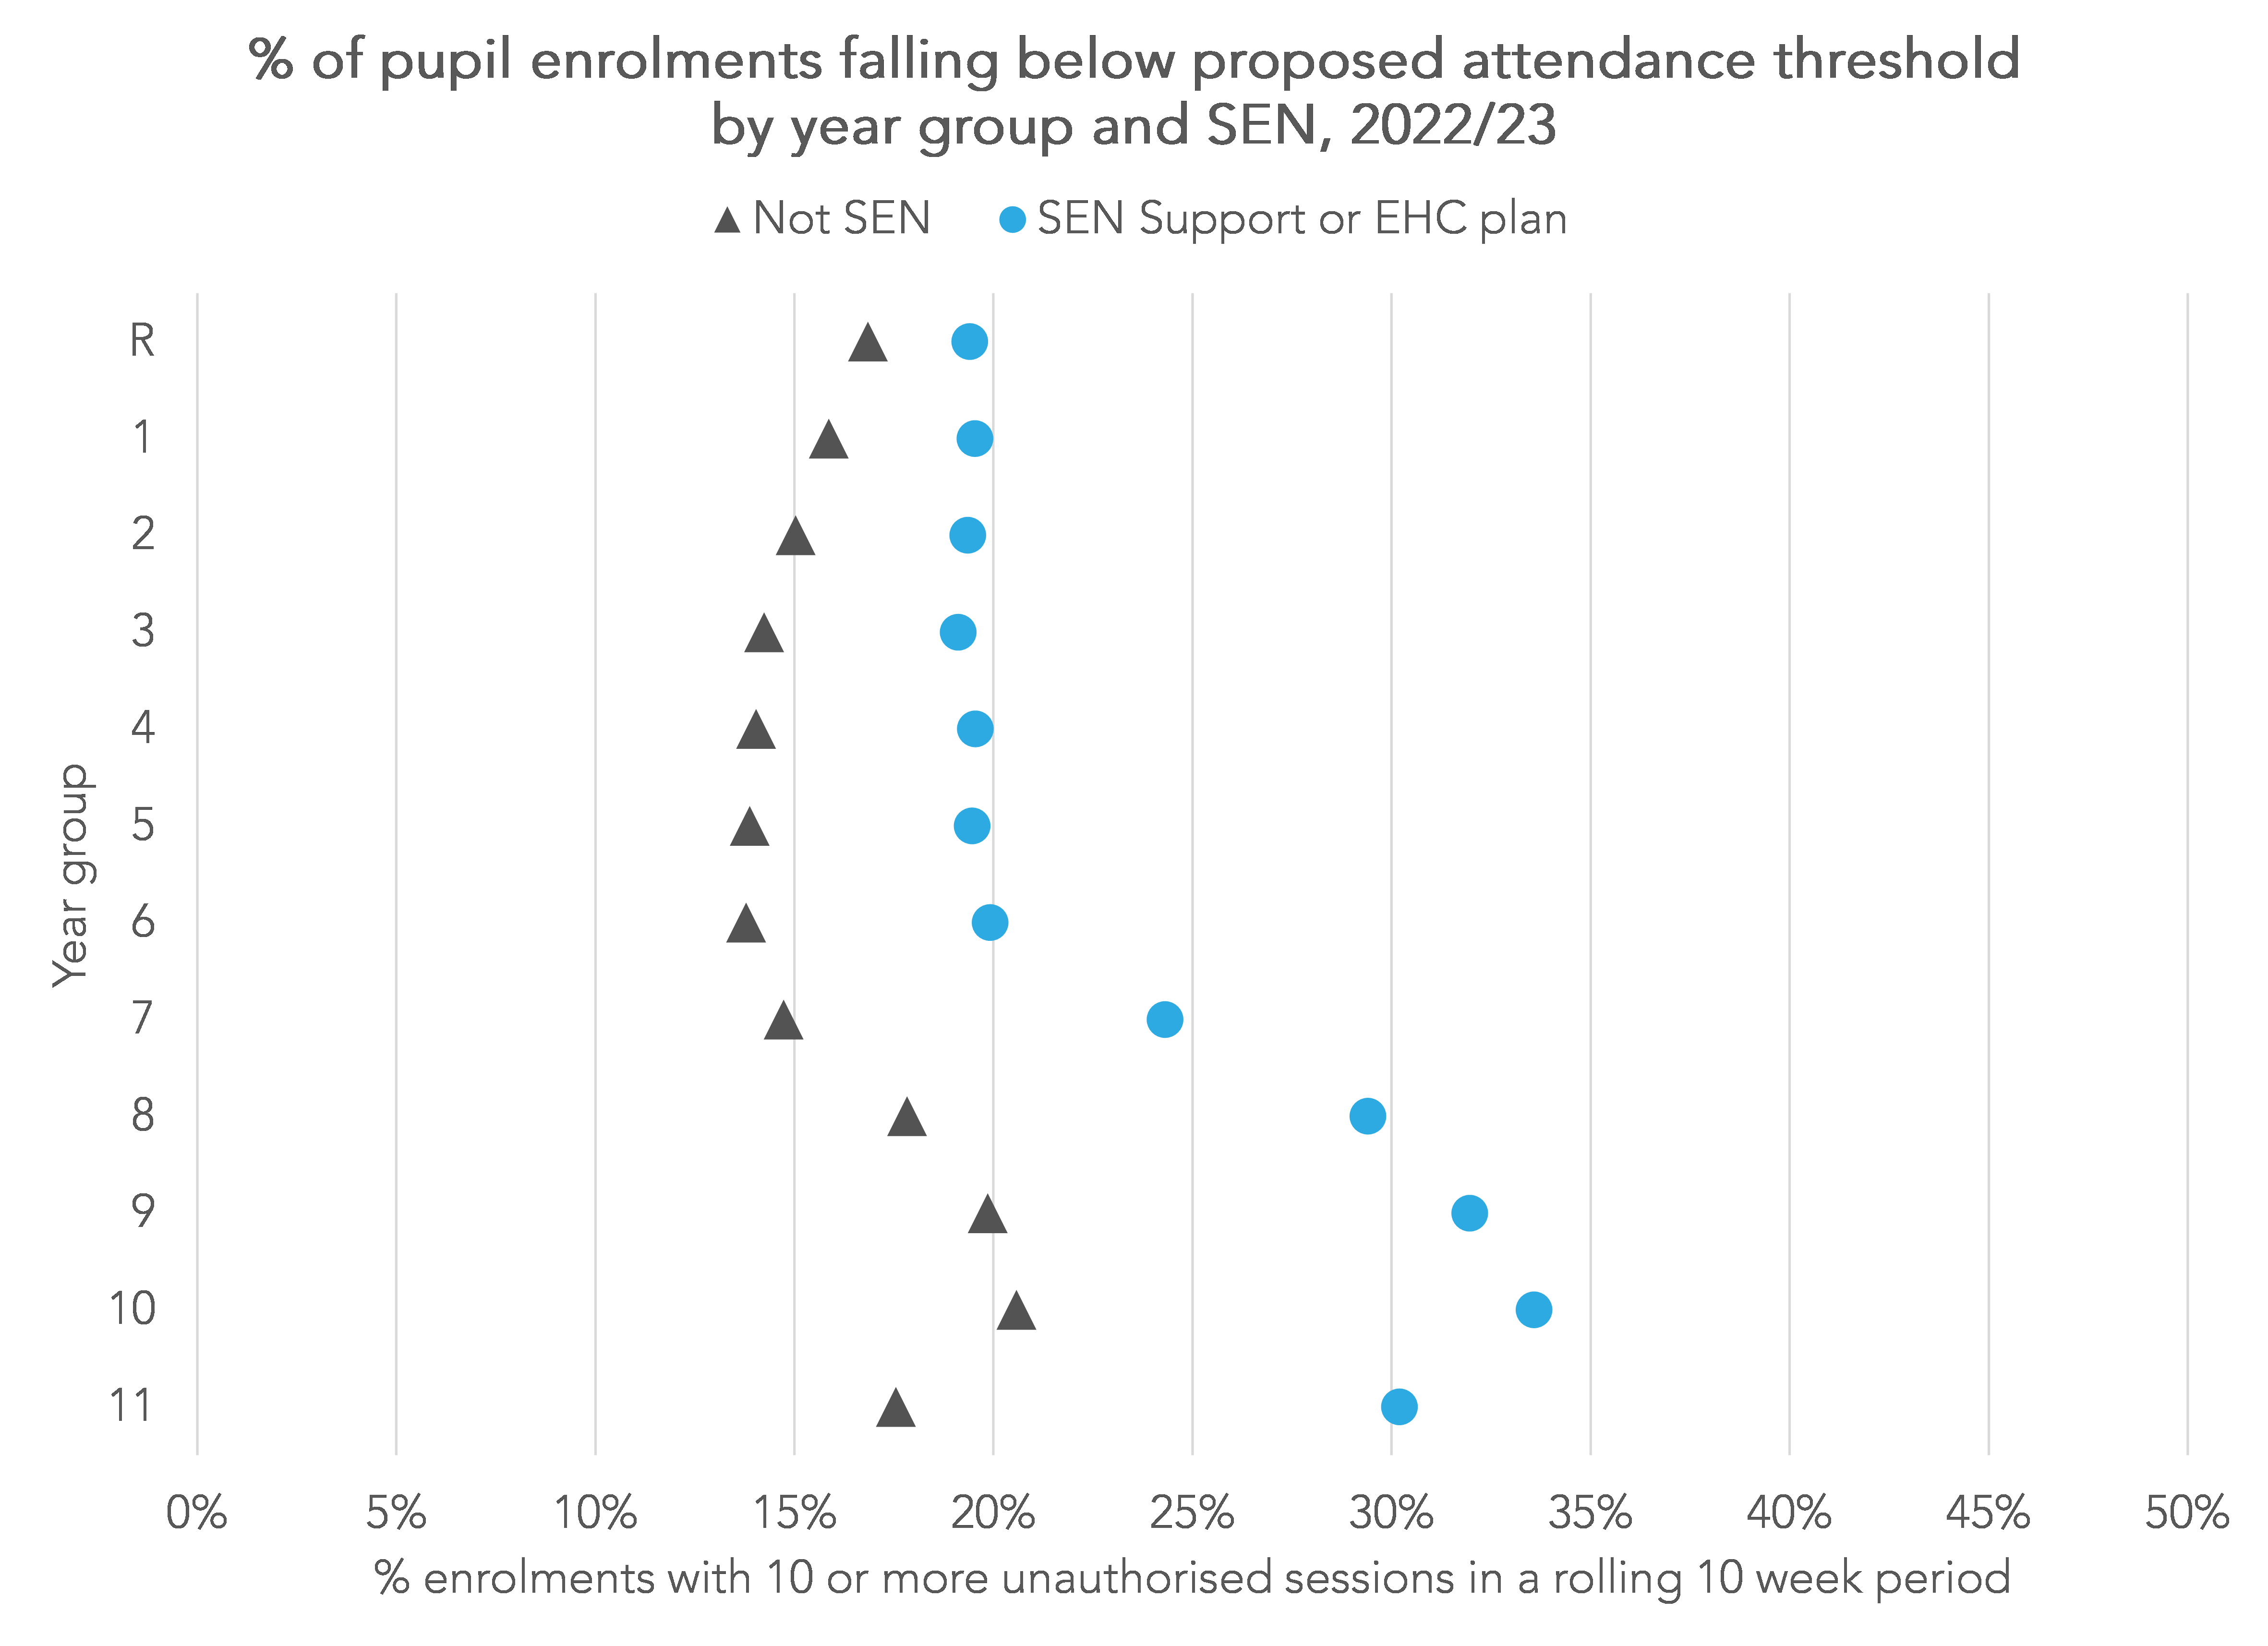
We have grouped together pupils with SEN met by SEN support and those with Education, Health and Care (EHC) plans. There are only slight differences between these two groups.
Similar to disadvantage, although not quite as starkly, pupils with SEN are disproportionately more likely to trigger the threshold.
Summing up
So if data for 2022/23 is any guide, around 1 in every 5 pupils is at risk of falling below the proposed new absence threshold. This risk is higher for pupils in secondary schools than those in primary.
Disadvantaged pupils and those with special educational needs are at greater risk than other pupils.
It won’t be the case that fines are issued in every case: the guidance does give discretion to schools and local authorities to do what they think is best.
It may also be the case that schools become ever more vigilant in chasing up reasons for absence to reduce the risk of having to issue fines (or being under pressure to do so).
What we need to know is whether disproportionality occurs in practice. However, this will involve DfE changing the way it collects parental responsibility measures data to link the issue of penalty notices to the pupils to which they relate. This would enable the production of statistics that show whether disadvantaged pupils and those with special educational needs are disproportionately affected by the policy.
Want to stay up-to-date with the latest research from FFT Education Datalab? Sign up to Datalab’s mailing list to get notifications about new blogposts, or to receive the team’s half-termly newsletter.


There are some positives from this
In so much that schools may need to be more accountable, however I think that all off this is a smoke screen to cover up the government policy of privatising state schools through academies and Trusts who seem to think that they can provide education in a boot camp style and that those kids that don’t meet their expectations are heavily penalised . Would adults put with this? What’s wrong with listening and supporting to achieve positive outcomes? The most successful schools put children at the centre of everything that they do and think outside the box. Head teachers of these schools possess exceptional business acumen and create cultures and learning environments that value every child .this doesn’t happen in our Trust. In fact the regional advisory board recognised that the Trust governance lacks knowledge and experience in secondary schools proven by a persistence absence of 51.6% in our local secondary schools in the Trust and created by a Trust that employed the wife as head teacher and the husband as her improvement lead and both of whom reported to the CEO . Charity Law makes it clear that conflicts of interest should be avoided , but despite being challenged, it was justified through their staff code of conduct via a very biased chair of governors . February this year saw an Ofsted report which requires improvement for education and leadership and the Trust responded by blaming Ofsted inspector behaviour! A really stupid thing to do given the court case against them and in the public domain!
Interesting that the gap is bigger for disadvantaged than for SEND. My opinions on the why might be rather controversial!