Back in December 2023 we published a report setting out a range of Key Stage 4 attainment indicators that we thought were more suitable for special and alternative provision schools than those currently available in Department for Education performance tables. This included Attainment 5 and Progress 5.
In that report we used data for the 2021/22 academic year. Since then, we have updated our analysis with 2022/23 data.
We are also making available reports based on these measures for special and AP schools in our system, Aspire. For schools with an Aspire subscription, these can be found within the special reports section of the site. Schools without an active subscription can get in touch with us at support@fft.org.uk and we will send you the reports.
We have also published updated data for 2023 for AP schools relating to re-integration, post-16 destinations and absence.
Data
The data we use comes from the National Pupil Database (NPD). In particular we focus on results in GCSEs and other qualifications taken at the end of Key Stage 4. This data is collected from awarding bodies by the Department for Education in order to publish school performance tables.
However, not all qualifications taken by students are counted. Consequently, the first stage of our analysis is to count all qualifications in performance measures. In the report we show how we have counted qualifications that are not currently included in published measures, such as Functional Skills.
We then create the following set of measures:
- Percentage of pupils achieving the basics (passes in English/literacy and maths/numeracy)
- At Level 2 or above (equivalent to GCSE grades 9-4)
- At Level 1 or above (equivalent to GCSE grades 3-1 or above)
- At Entry level or above
- Attainment 5 (A5)
- Score in English/ literacy
- Score in Maths/ numeracy
- Total score in any other 3 subjects
- Total A5 score (sum of the 3 “buckets” above)
- Entries
- % of pupils entering 1 or more qualifications
- % of pupils entering 1 or more qualifications in each of the 3 A5 “buckets”
- % of pupils entered for 5 qualifications in A5s
The report sets out how we have defined these measures in more detail.
Summary measures for pupils in AP and special schools are presented below.
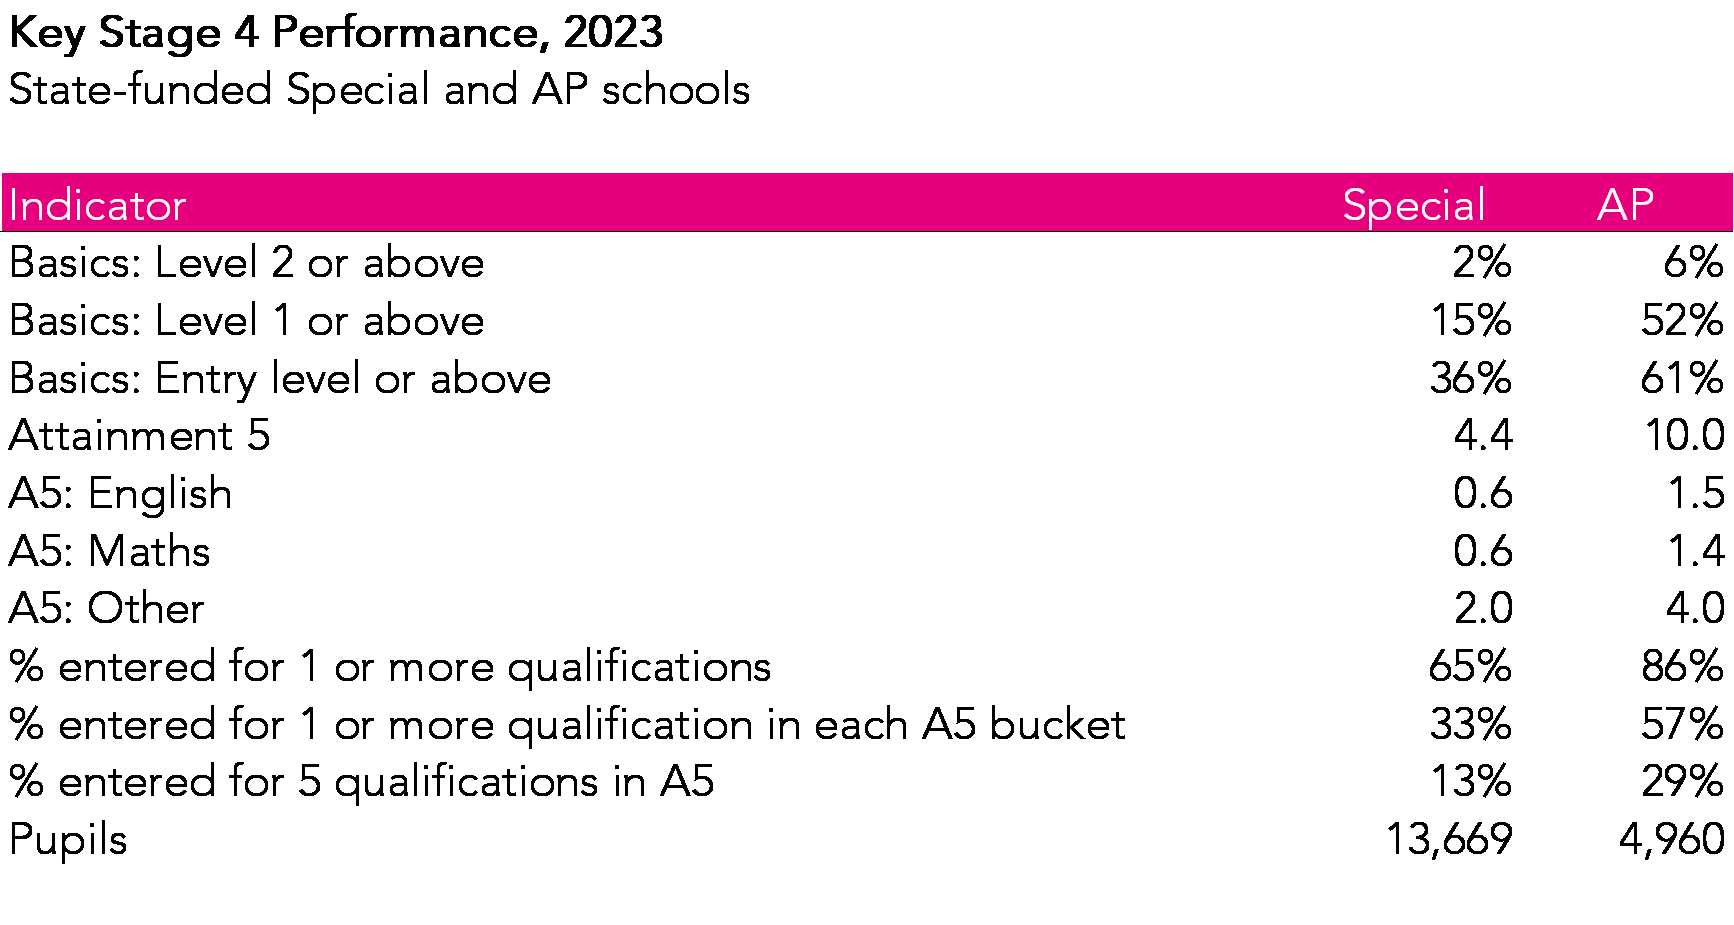
52% of pupils in AP schools and 15% of pupils in special schools achieved the basics at Level 1 in 2023. The average Attainment 5 score was 10.0 in AP schools and 4.4 in special schools.
86% of pupils in AP schools and 65% of pupils in special schools were entered for at least one qualification. This compares with 75% and 28% respectively according to performance tables.
Limitations
Firstly, some special schools may not enter pupils in qualifications. This may occur, for instance, if there are no suitable qualifications available given the pupils’ needs.
Secondly, the Progress 5 measure uses Key Stage 2 results as a baseline measure. This may not reflect pupils’ needs at the time they enter a special/ AP school.
The aim of the exercise is to make best use of the available data. More suitable measures may ultimately be feasible but would require additional data collection.
Progress 5 in 2025
Due to the cancellation of Key Stage 2 tests in summer 2020 as a result of the Covid-19 pandemic, we will not be able to calculate Progress 5 in summer 2025.
However, we will still produce the other attainment measures.
Want to stay up-to-date with the latest research from FFT Education Datalab? Sign up to Datalab’s mailing list to get notifications about new blogposts, or to receive the team’s half-termly newsletter.

Such a fantastic school performance measure for special schools! Thanks for all your work with this Dave!
Thanks Darren- that’s great to hear!
It’s difficult to apply a blanket measure across special schools and/or APs. Each one is unique and often very diverse within each year group. The data doesn’t represent the proportions of pupils with specific needs – what are the percentages of primary needs such as comparing schools with mainly ASD, SEMH etc? That’s before you start looking at the combinations of other needs!!
KS2 data is irrelevent – either the pupil was below the standard at primary, or may have had a major life event which affected their ability to learn. I have worked with pupils where getting them into a classroom and sitting on a chair was a success – this won’t show in performance tables. You can measure the pupils who sit just below mainstream, but most pupils in special schools aren’t as easy to measure.
How worthwhile is it to develop global measures which still won’t apply to a significant proportion of the cohort?
It would be so much better to have an open individual view of each school and celebrate the successes of each individual.
I would suggest a separate EIF in which inspectors are expected to understand the context of the school and it’s pupils before reporting that they are all under-achieving compared to National averages.
Hi Ian. Thanks for the comment. I agree with much of what you say. However, what I would say is that the measures of attainment and entry we have created are better for special and AP schools than those that currently exist. More is needed to compare like-with-like absolutely but I would say the measures we’ve created are a necessary first step.
I certainly agree with Dave’s response above – it’s good to see that someone at least is mindful that special and AP schools teach young people who make progress. This feels like the step-change which happened when we abandoned “W” and actually began to describe progress for young people whose advances or enrichments are often small-step, or quirky, or “sideways”. Great work DataLab!