FFT Aspire Secondary Results Service
We will be running our increasingly popular KS4 results service on the 21st August and will be calculating a measure of CAT4 to Key Stage 4 progress. For more information, visit our Early Results Service for Secondary Schools page.
There will be no Progress 8 data for secondary schools this year.
For some this will come as something of a relief. As is well-established, schools serving more disadvantaged intakes tend to achieve lower Progress 8 scores than other schools.
However, as we show here, the gap between the least-disadvantaged and most-disadvantaged is even greater based on raw attainment alone.
So in the absence of Progress 8, what options are there for proxy measures?
Proxies of Progress 8
We see two options:
- Use another measure of prior attainment in place of Key Stage 2 to calculate an Attainment 8 estimate
- Year 7 CAT4 tests
- Key Stage 1 teacher assessments
- Use the school’s Attainment 8 estimate from last year
We plan to include a measure of CAT4 to Key Stage 4 progress in FFT Aspire in the summer. We will write more about that later in the year.
We have written before about the possibility of using Key Stage 1 to calculate a Progress measure. In short, it’s not great but not as bad as you might think.
Alternatively, the school’s Attainment 8 estimate from 2024 could be used to calculate a proxy benchmark against which the school’s actual Attainment 8 score from 2025 could be compared.
We now look at these two latter measures in a bit more depth.
Key Stage 1 to Key Stage 4
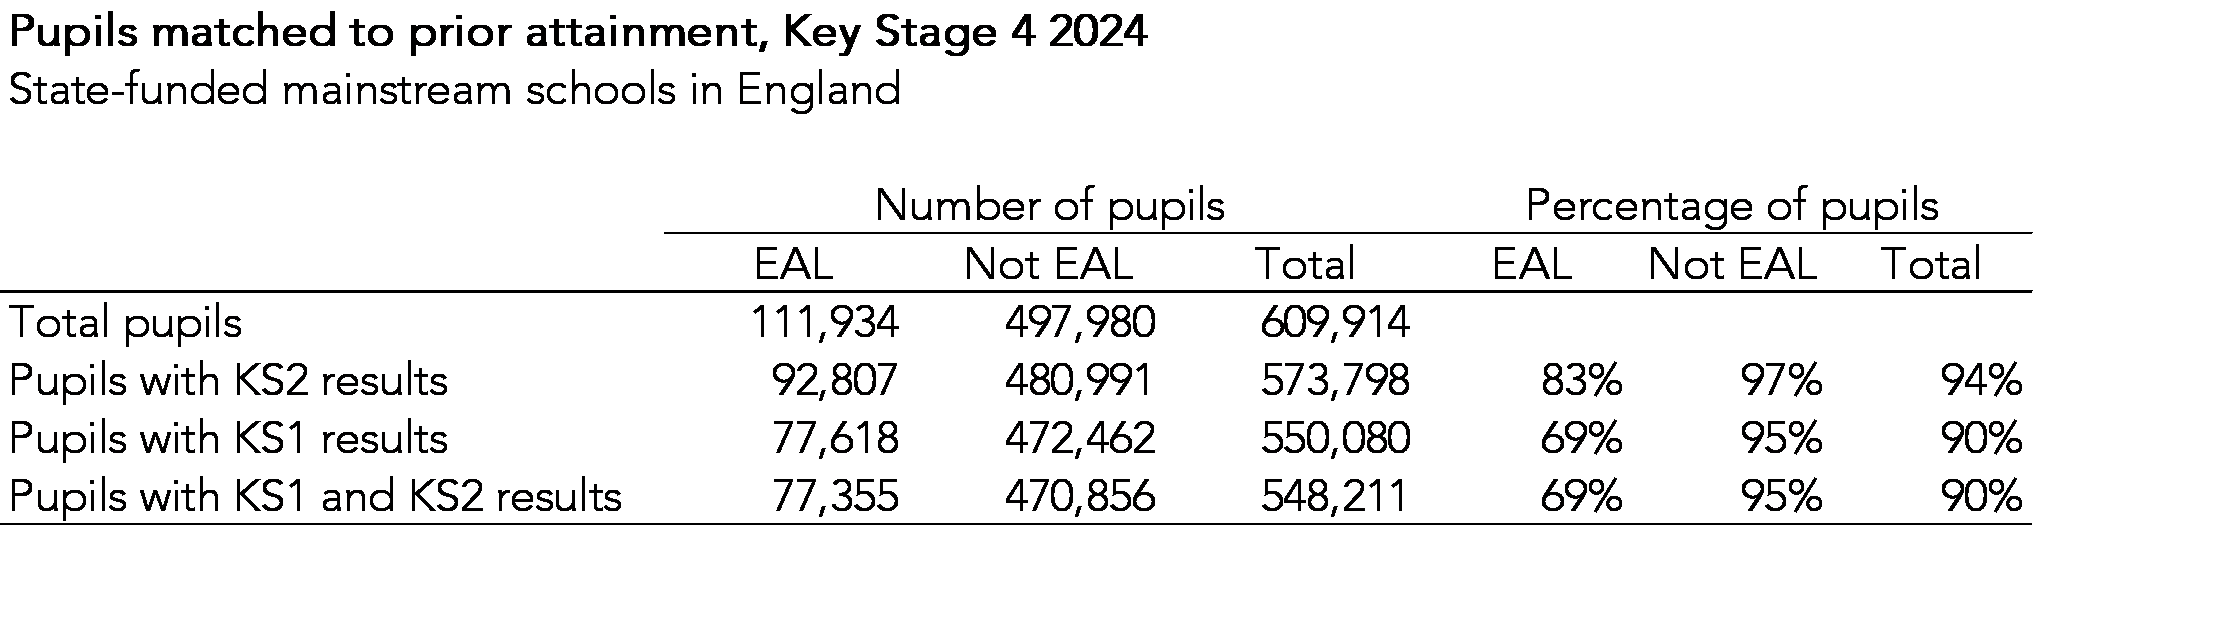
First of all, we match pupils who completed Key Stage 4 in 2024 to their KS1 average point score (APS). Most pupils would have completed KS1 in 2015, the last cohort to have been assessed using the old National Curriculum levels.
As the table below shows, 90% of all pupils who completed Key Stage 4 in 2024 are matched to Key Stage 1. This compares to 94% of pupils matched to Key Stage 2 (the group included in Progress 8). However, these figures are much lower (69% and 83% respectively) for pupils with English as an additional language (EAL)[1].
 We then create a progress measure similar to Progress 8.
Firstly, we allocate pupils to prior attainment groups based on their KS1 APS.
Then, for each group, we calculate the national average Attainment 8 score in 2024. These can be seen in the annex. We use these values to calculate an estimated (or benchmark) Attainment 8 score for each pupil.
Finally, for pupils with KS1 results, we calculate the difference between their actual Attainment 8 score and their estimated score.
A school’s KS1 to KS4 value added score is the average (mean) of these differences.
Last year’s Attainment 8 estimate
Progress 8 is calculated by comparing pupils’ actual Attainment 8 scores to estimates.
The estimates are national average Attainment 8 scores achieved by all pupils nationally with the same level of prior attainment as measured by mean Key Stage 2 scaled scores in reading and maths. These values (for 2024) can be seen in Table 40 of the Department for Education’s Secondary School Accountability Guidance.
Sign up to our newsletter
If you enjoy our content, why not sign up now to get notified when we publish a new post, or to receive our half termly newsletter?
For the purposes of this illustration, we calculate the average Attainment 8 estimate for pupils at each state-funded mainstream school in 2023.
We then calculate the average (mean) of actual Attainment 8 scores from 2024 for pupils with Key Stage 2 results at each state-funded mainstream school in 2024.
The difference between these two values then gives us a proxy Progress 8 measure.
This proxy assumes that the prior attainment of pupils at a school does not change much from year to year, and that there is no national improvement (or deterioration) in national Key Stage 4 results with respect to prior attainment. Both assumptions will be untestable this Summer.
To replicate this measure in 2025, schools would need to exclude from the calculation of Attainment 8 any pupils who did not complete Year 6 in England.
Results
For 2024 we now have 3 school-level measures:
- Progress 8
- Key Stage 1 to Key Stage 4 value added (KS1-KS4 VA)
- Progress 8 based on last year’s estimate
We show the correlation between these measures in the table below.
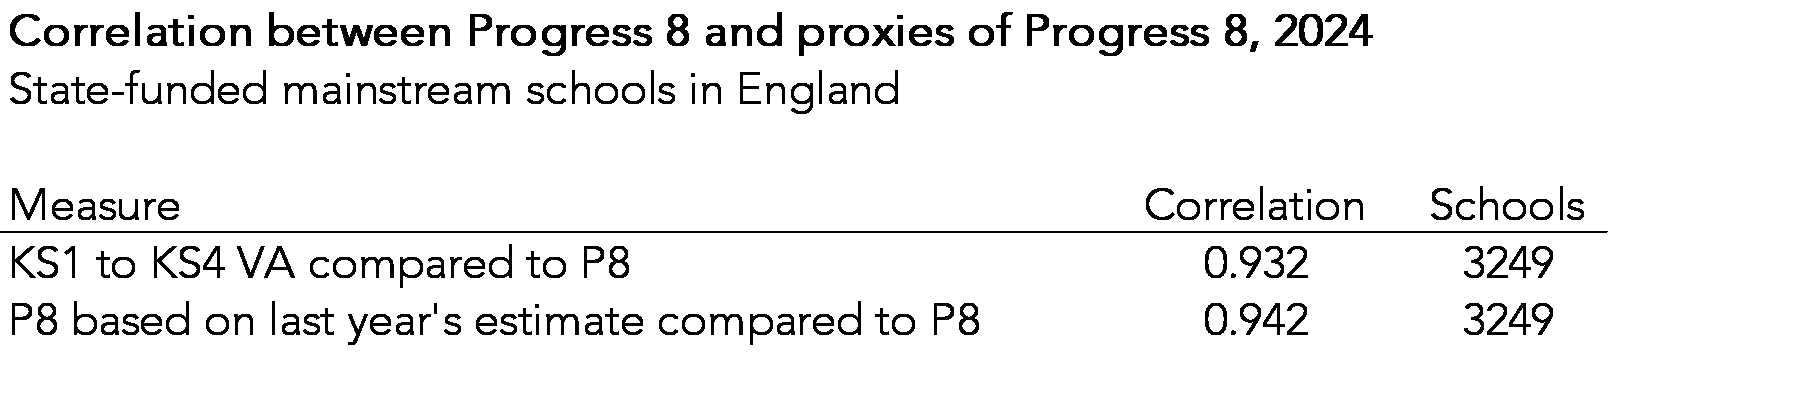
Progress 8 is strongly correlated with both KS1-KS4 VA and with the proxy based on last year’s estimate. The correlation is slightly higher for the latter.
Next, we look at the differences between Progress 8 and the two proxies at school level.
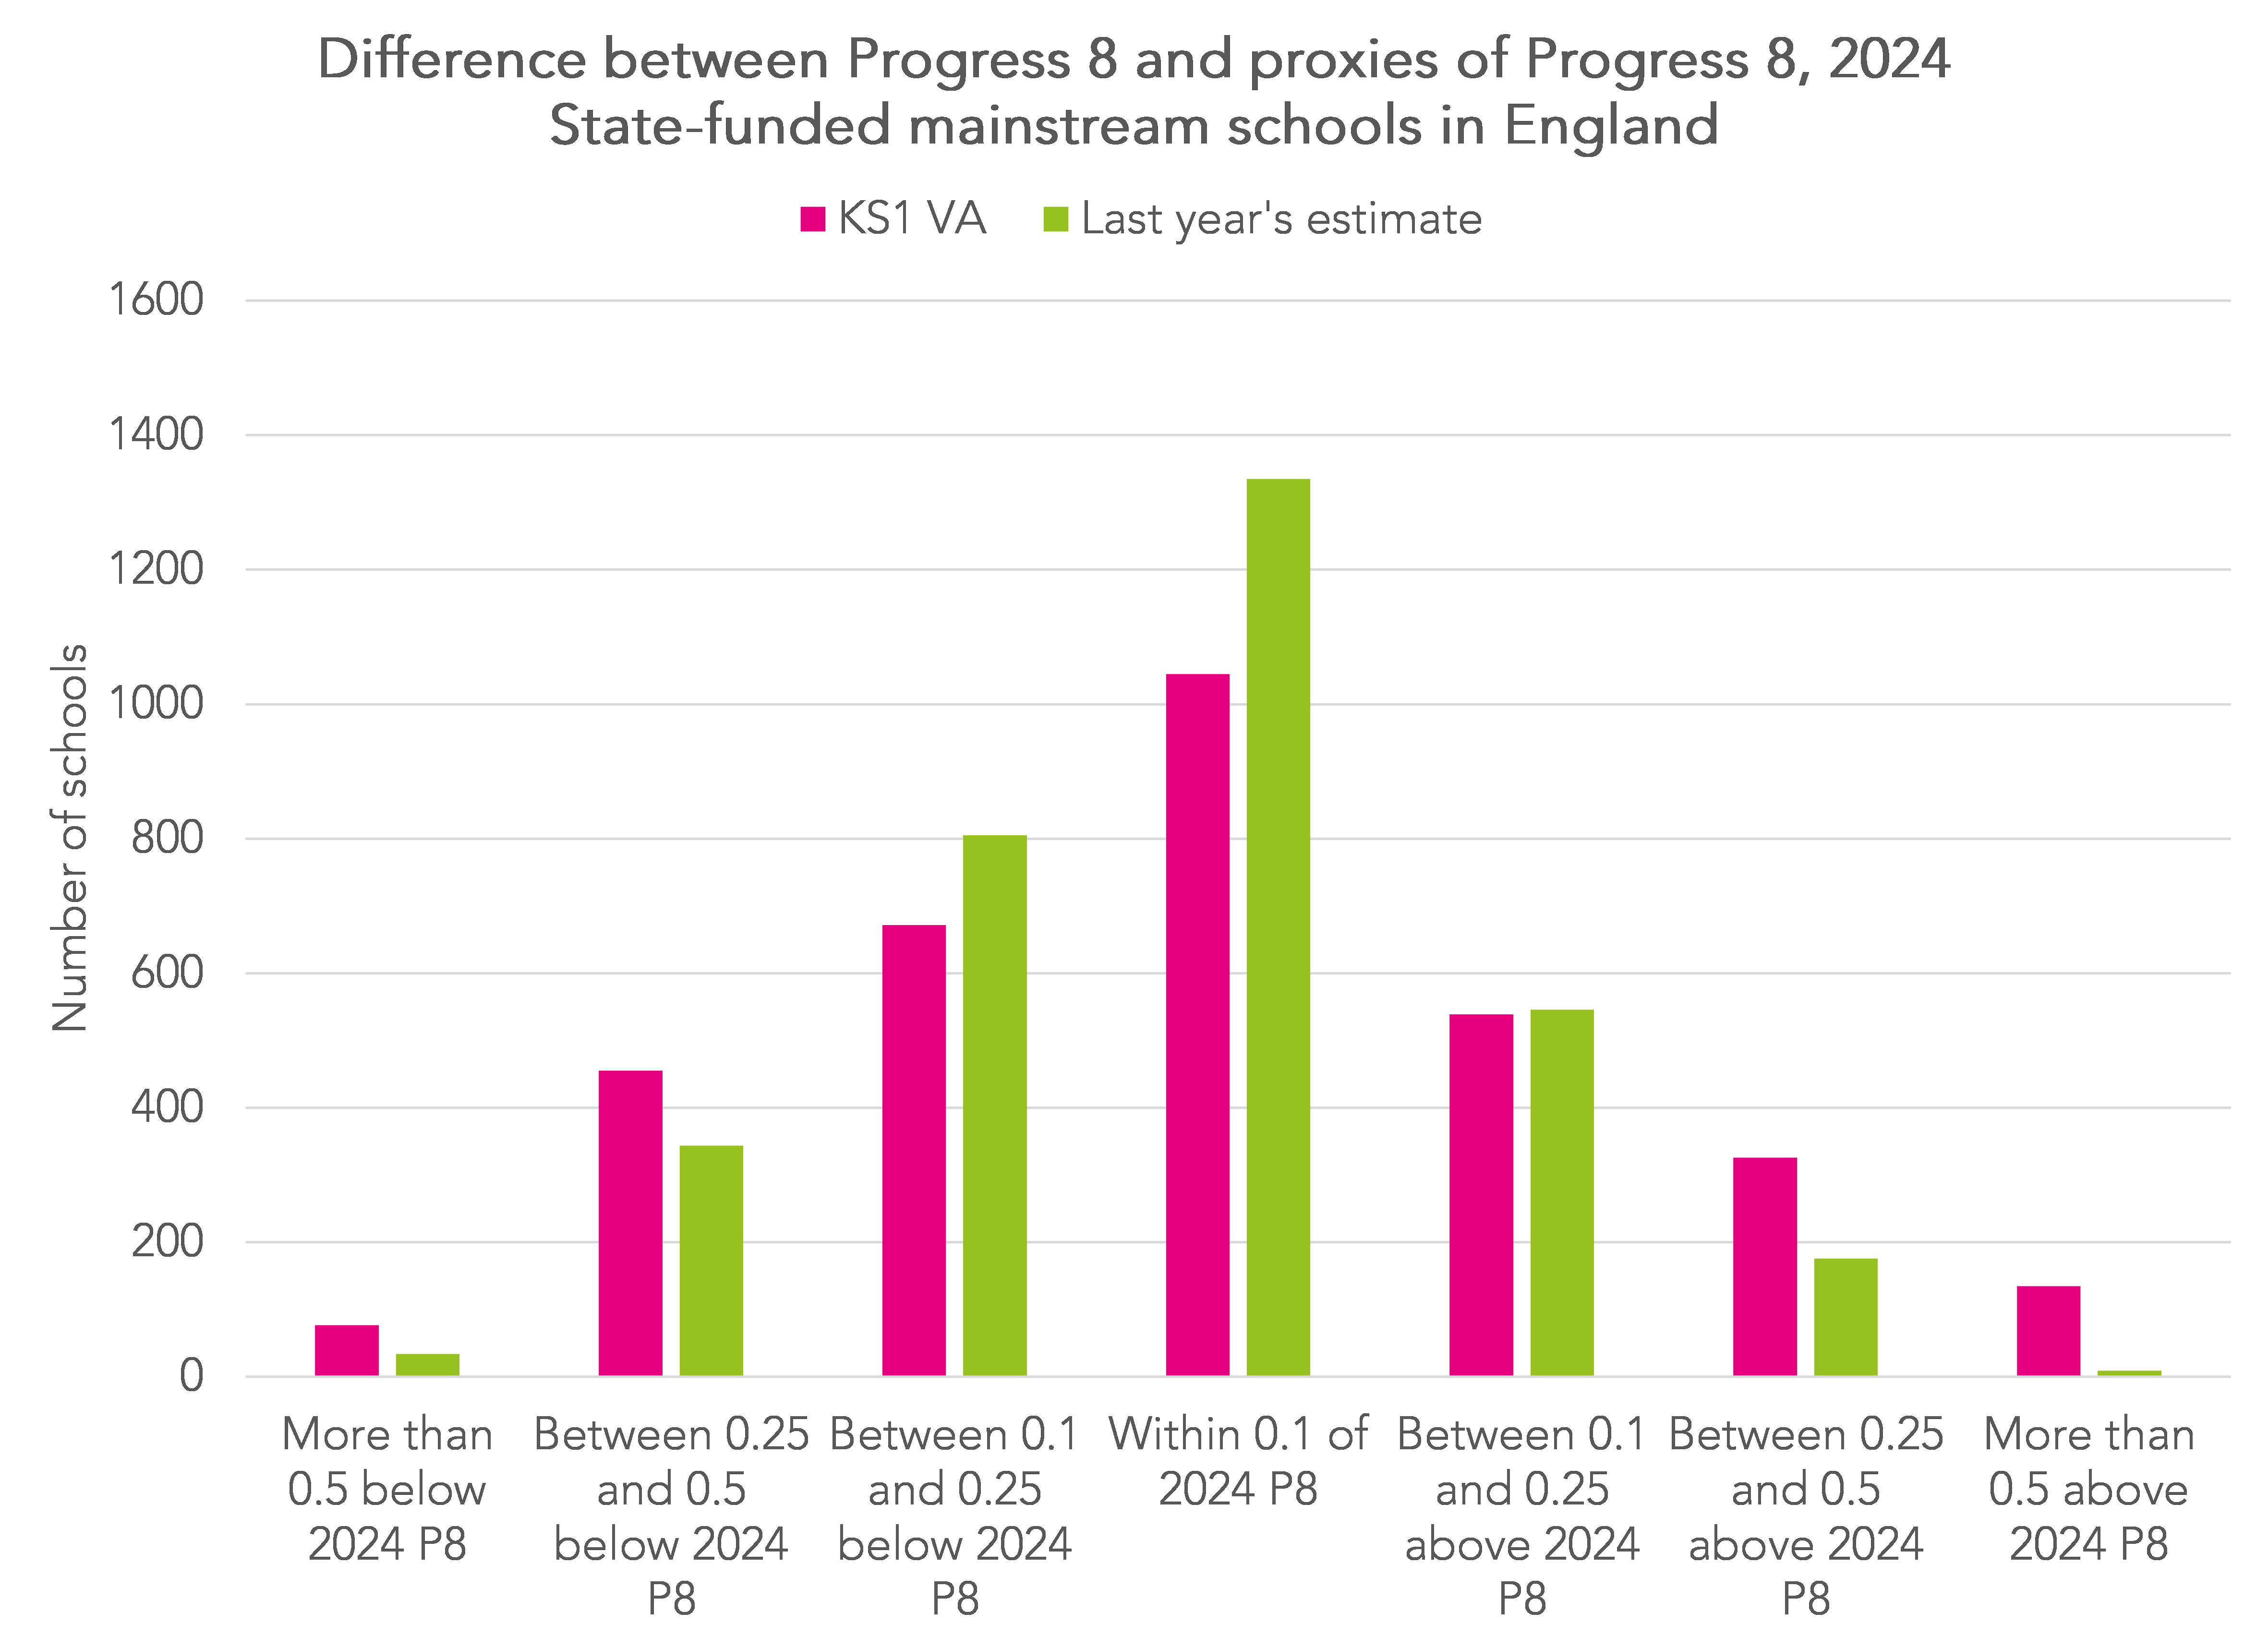
1,335 schools (41%) recorded a proxy score based on last year’s estimate within 0.1 points (around a tenth of a grade in one subject) of their actual Progress 8 score.
This means that differences are greater than 0.1 at 59% of schools. In fact, 36% of schools ended up with a lower proxy score than their actual score and only 22% ended up with a higher score. This reflects changes in prior attainment (both nationally and at school level) and also in Key Stage 4 attainment with respect to prior attainment nationally.
There is more variability between Progress 8 and KS1-KS4 than between Progress 8 and the proxy based on last year’s estimate. 1,045 schools (32%) see a change of less than 0.1 points in either direction. However, the numbers of schools with differences of more than 0.1 points are more evenly balanced for the KS1-KS4 proxy than the proxy based on last year’s estimate.
School-level differences between Progress 8 and the proxy measures vary across regions.
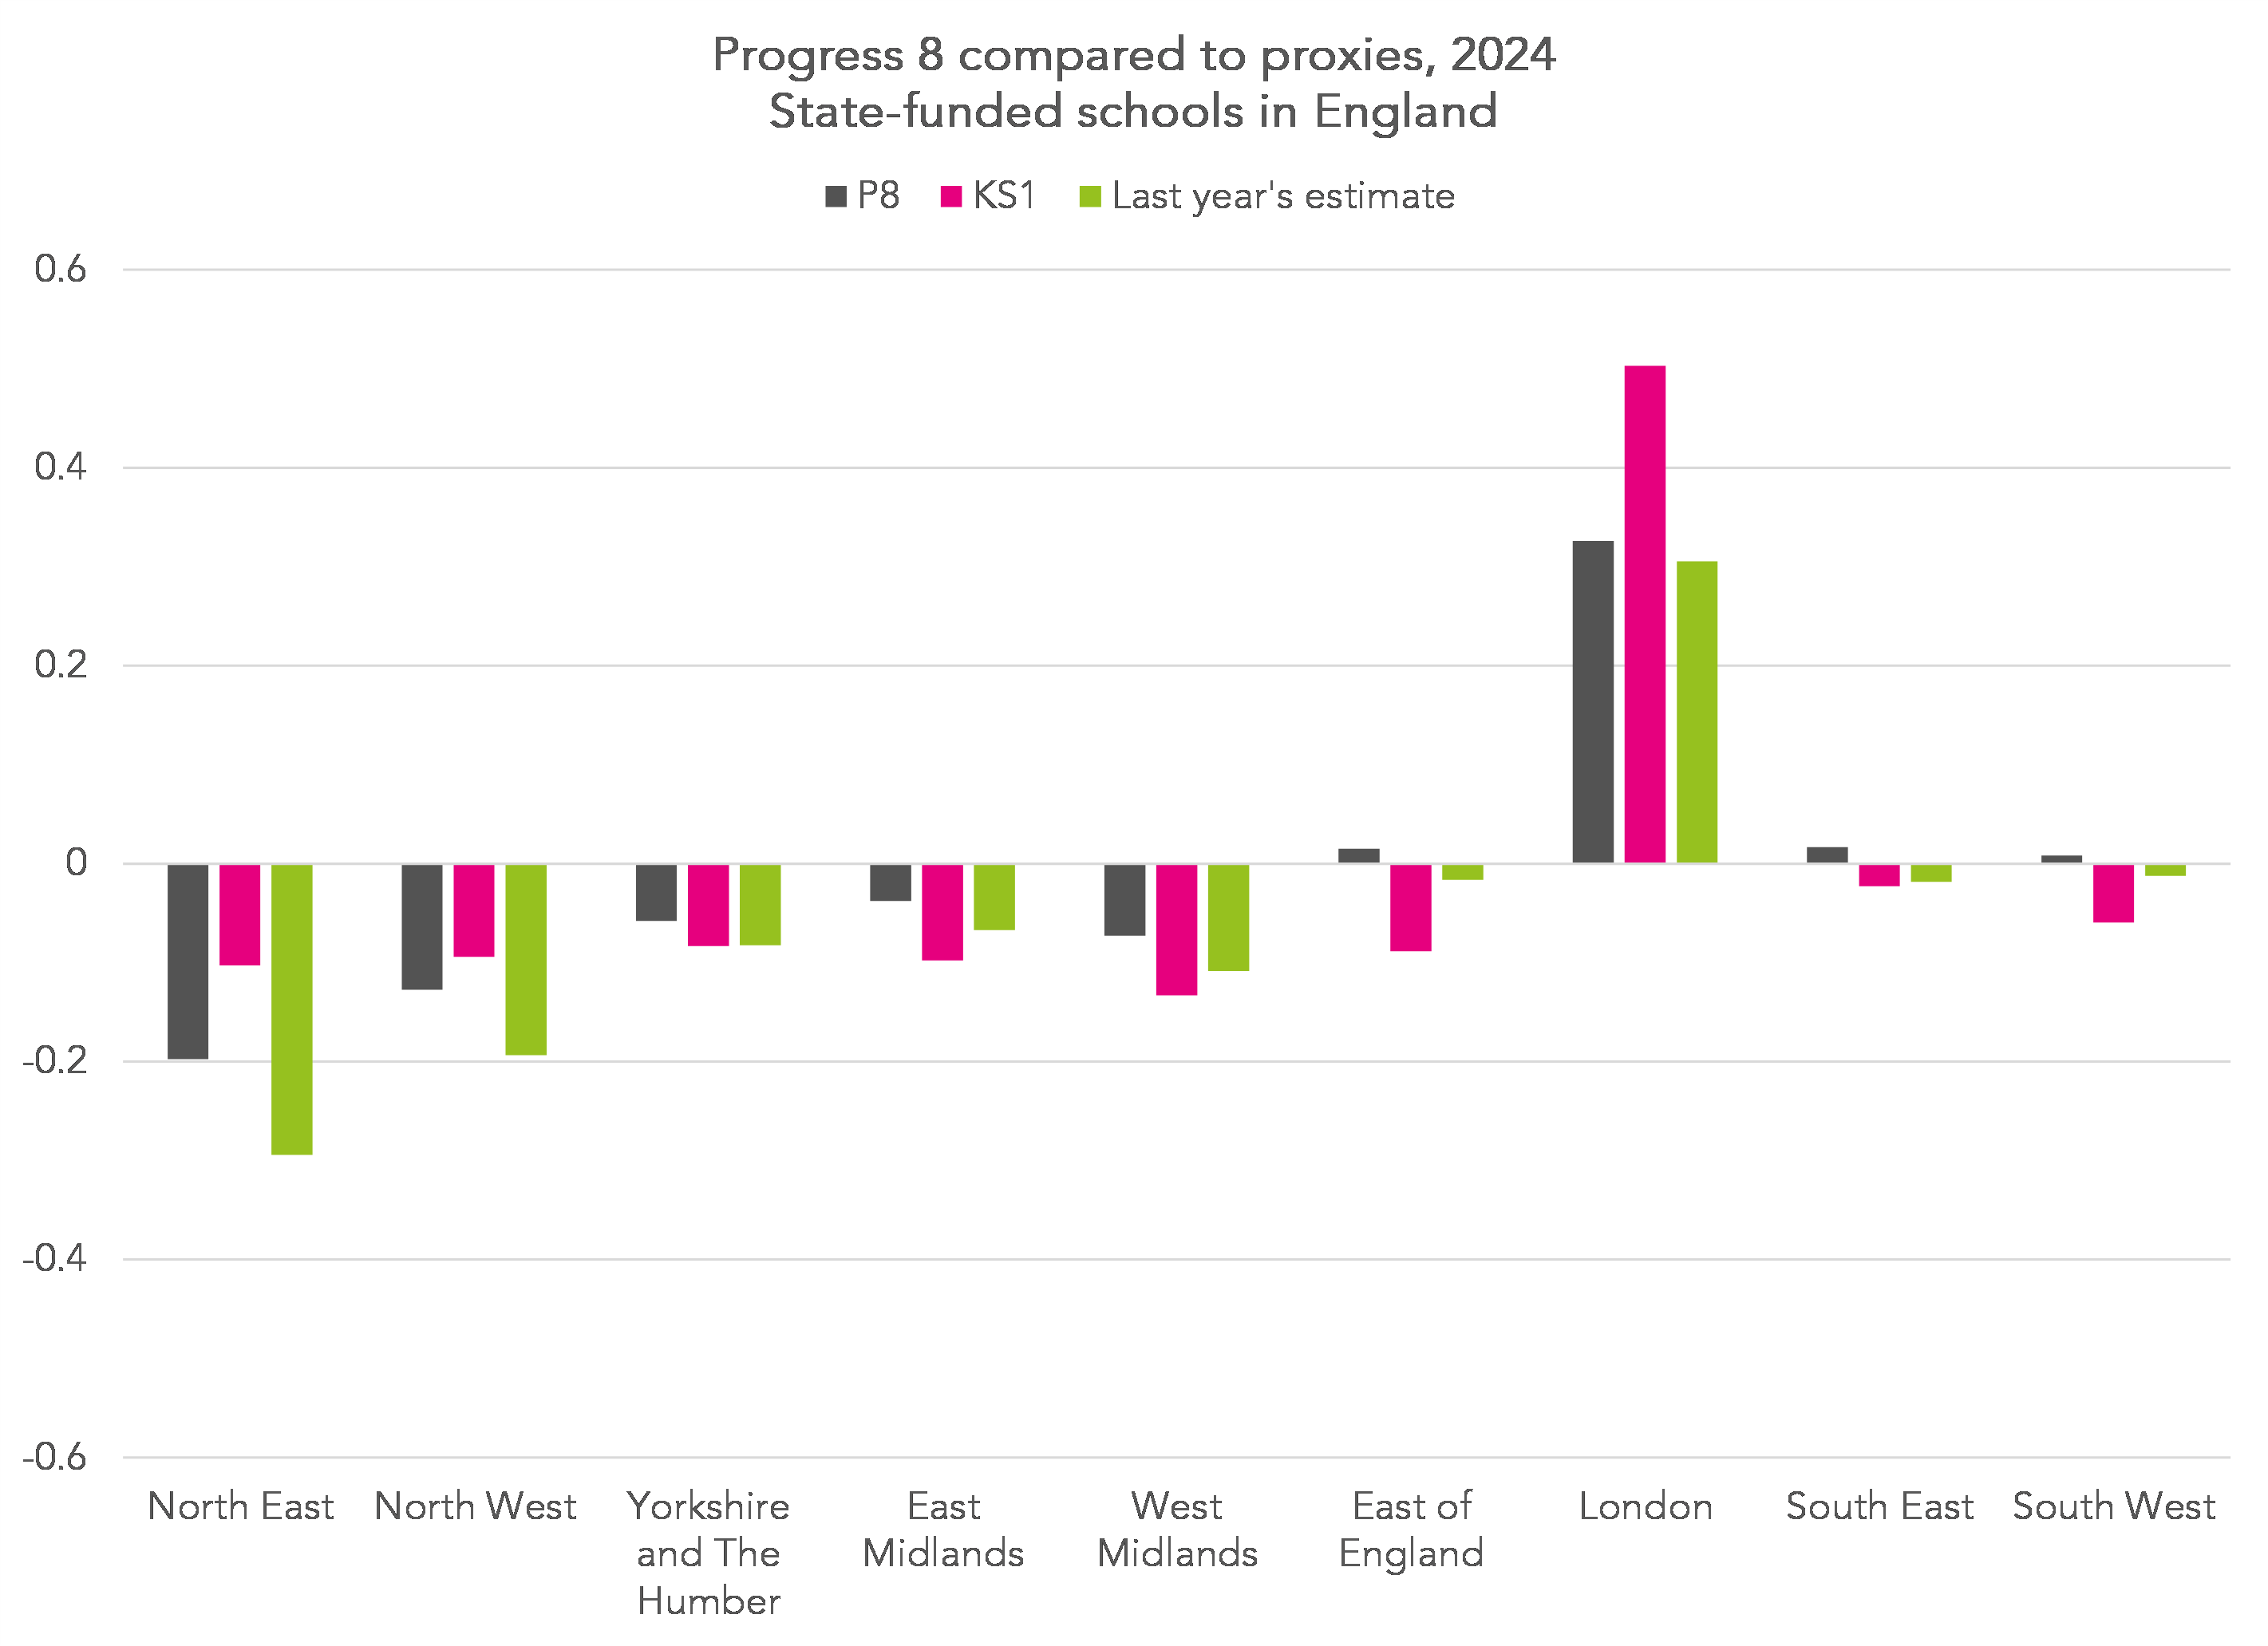
Schools in London, which tend to achieve higher Progress 8 scores, see their advantage increase even more under the KS1-KS4 VA measure. In 2024, schools in London achieved a Progress 8 score of +0.32 (around a third of a grade per subject) on average. Under KS1-KS4 VA this increases to +0.5 (around half a grade per subject).
Schools in both the North East and North West tended to achieve scores on the proxy measure based on last year’s estimate that were lower than Progress 8.
Differences between Progress 8 and KS1-KS4 VA are largely driven by pupil characteristics.
In the chart below, we show the mean score for both measures split by gender, disadvantage (FSM6) and English as an additional language (EAL).
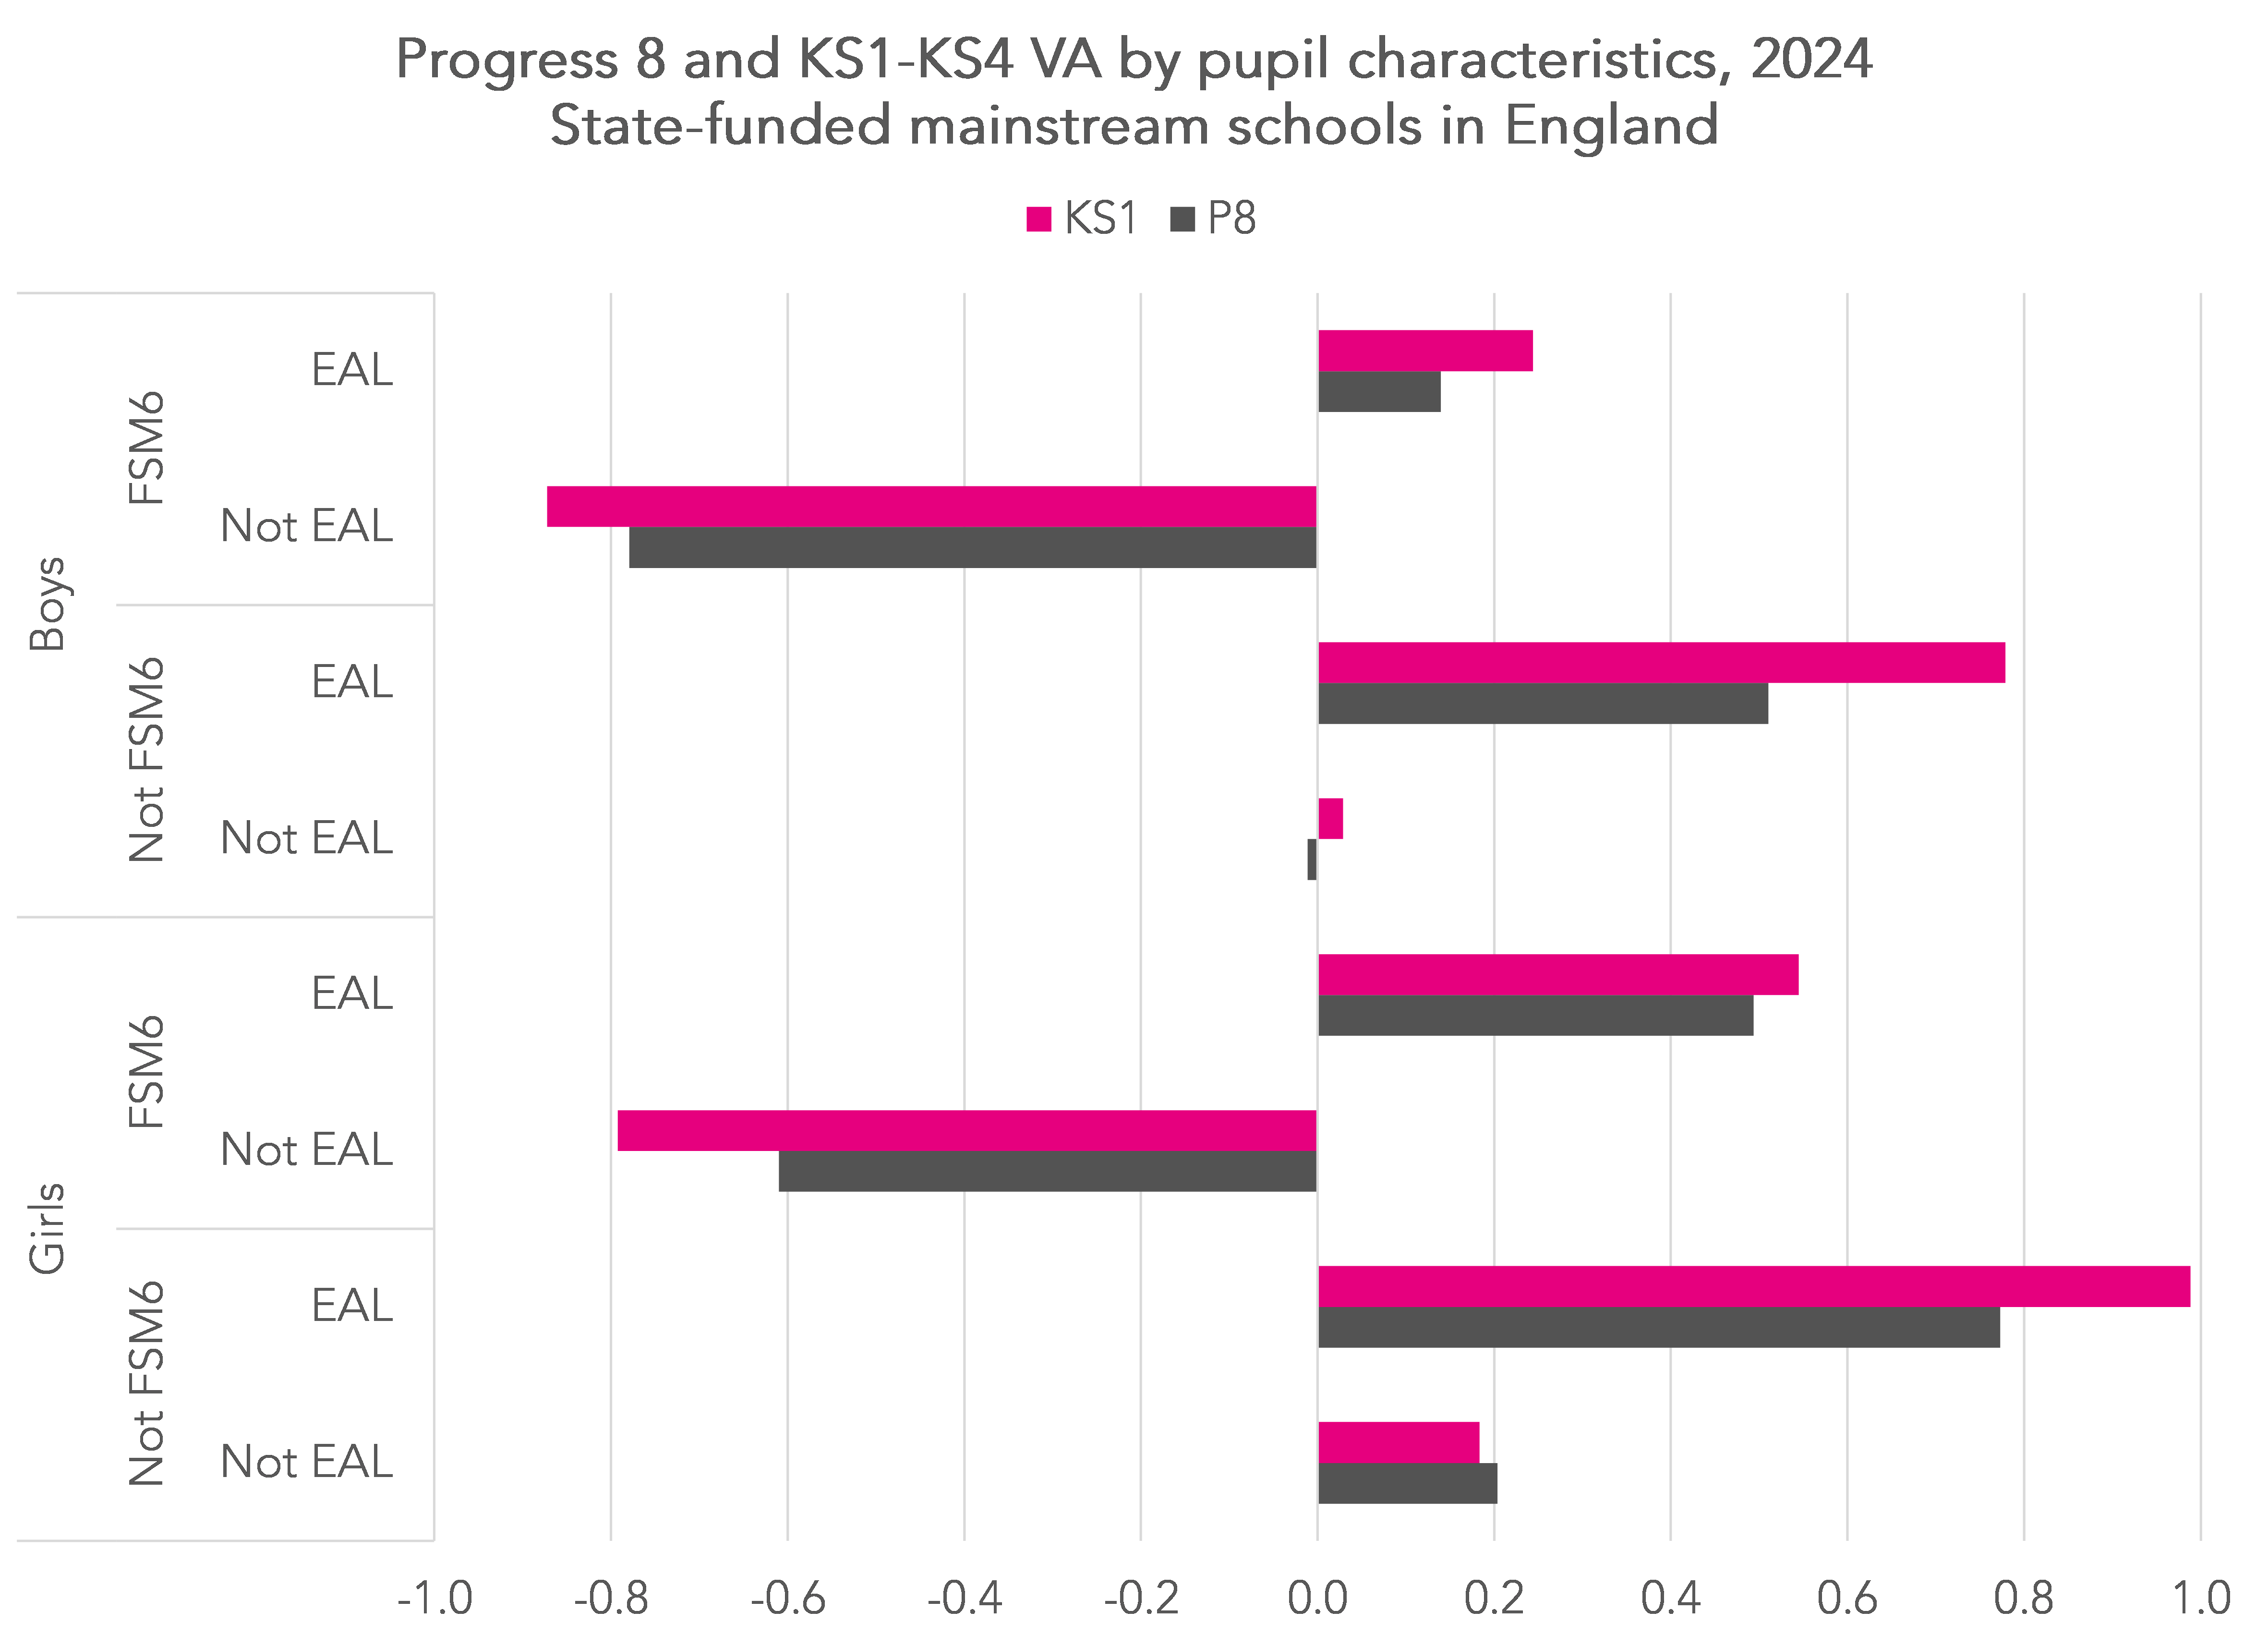
Pupils who speak English as an additional language, especially those who are not disadvantaged, tend to achieve higher Progress 8 scores. These are even higher based on KS1-KS4 VA.
By contrast, disadvantaged pupils who aren’t recorded as having English as an additional language tend to achieve lower Progress 8 scores and these are even lower based on KS1-KS4 VA.
Meanwhile, schools with cohorts that have lower prior attainment than their preceding cohort tend to achieve lower proxy scores based on last year’s estimate compared to actual Progress 8 scores.
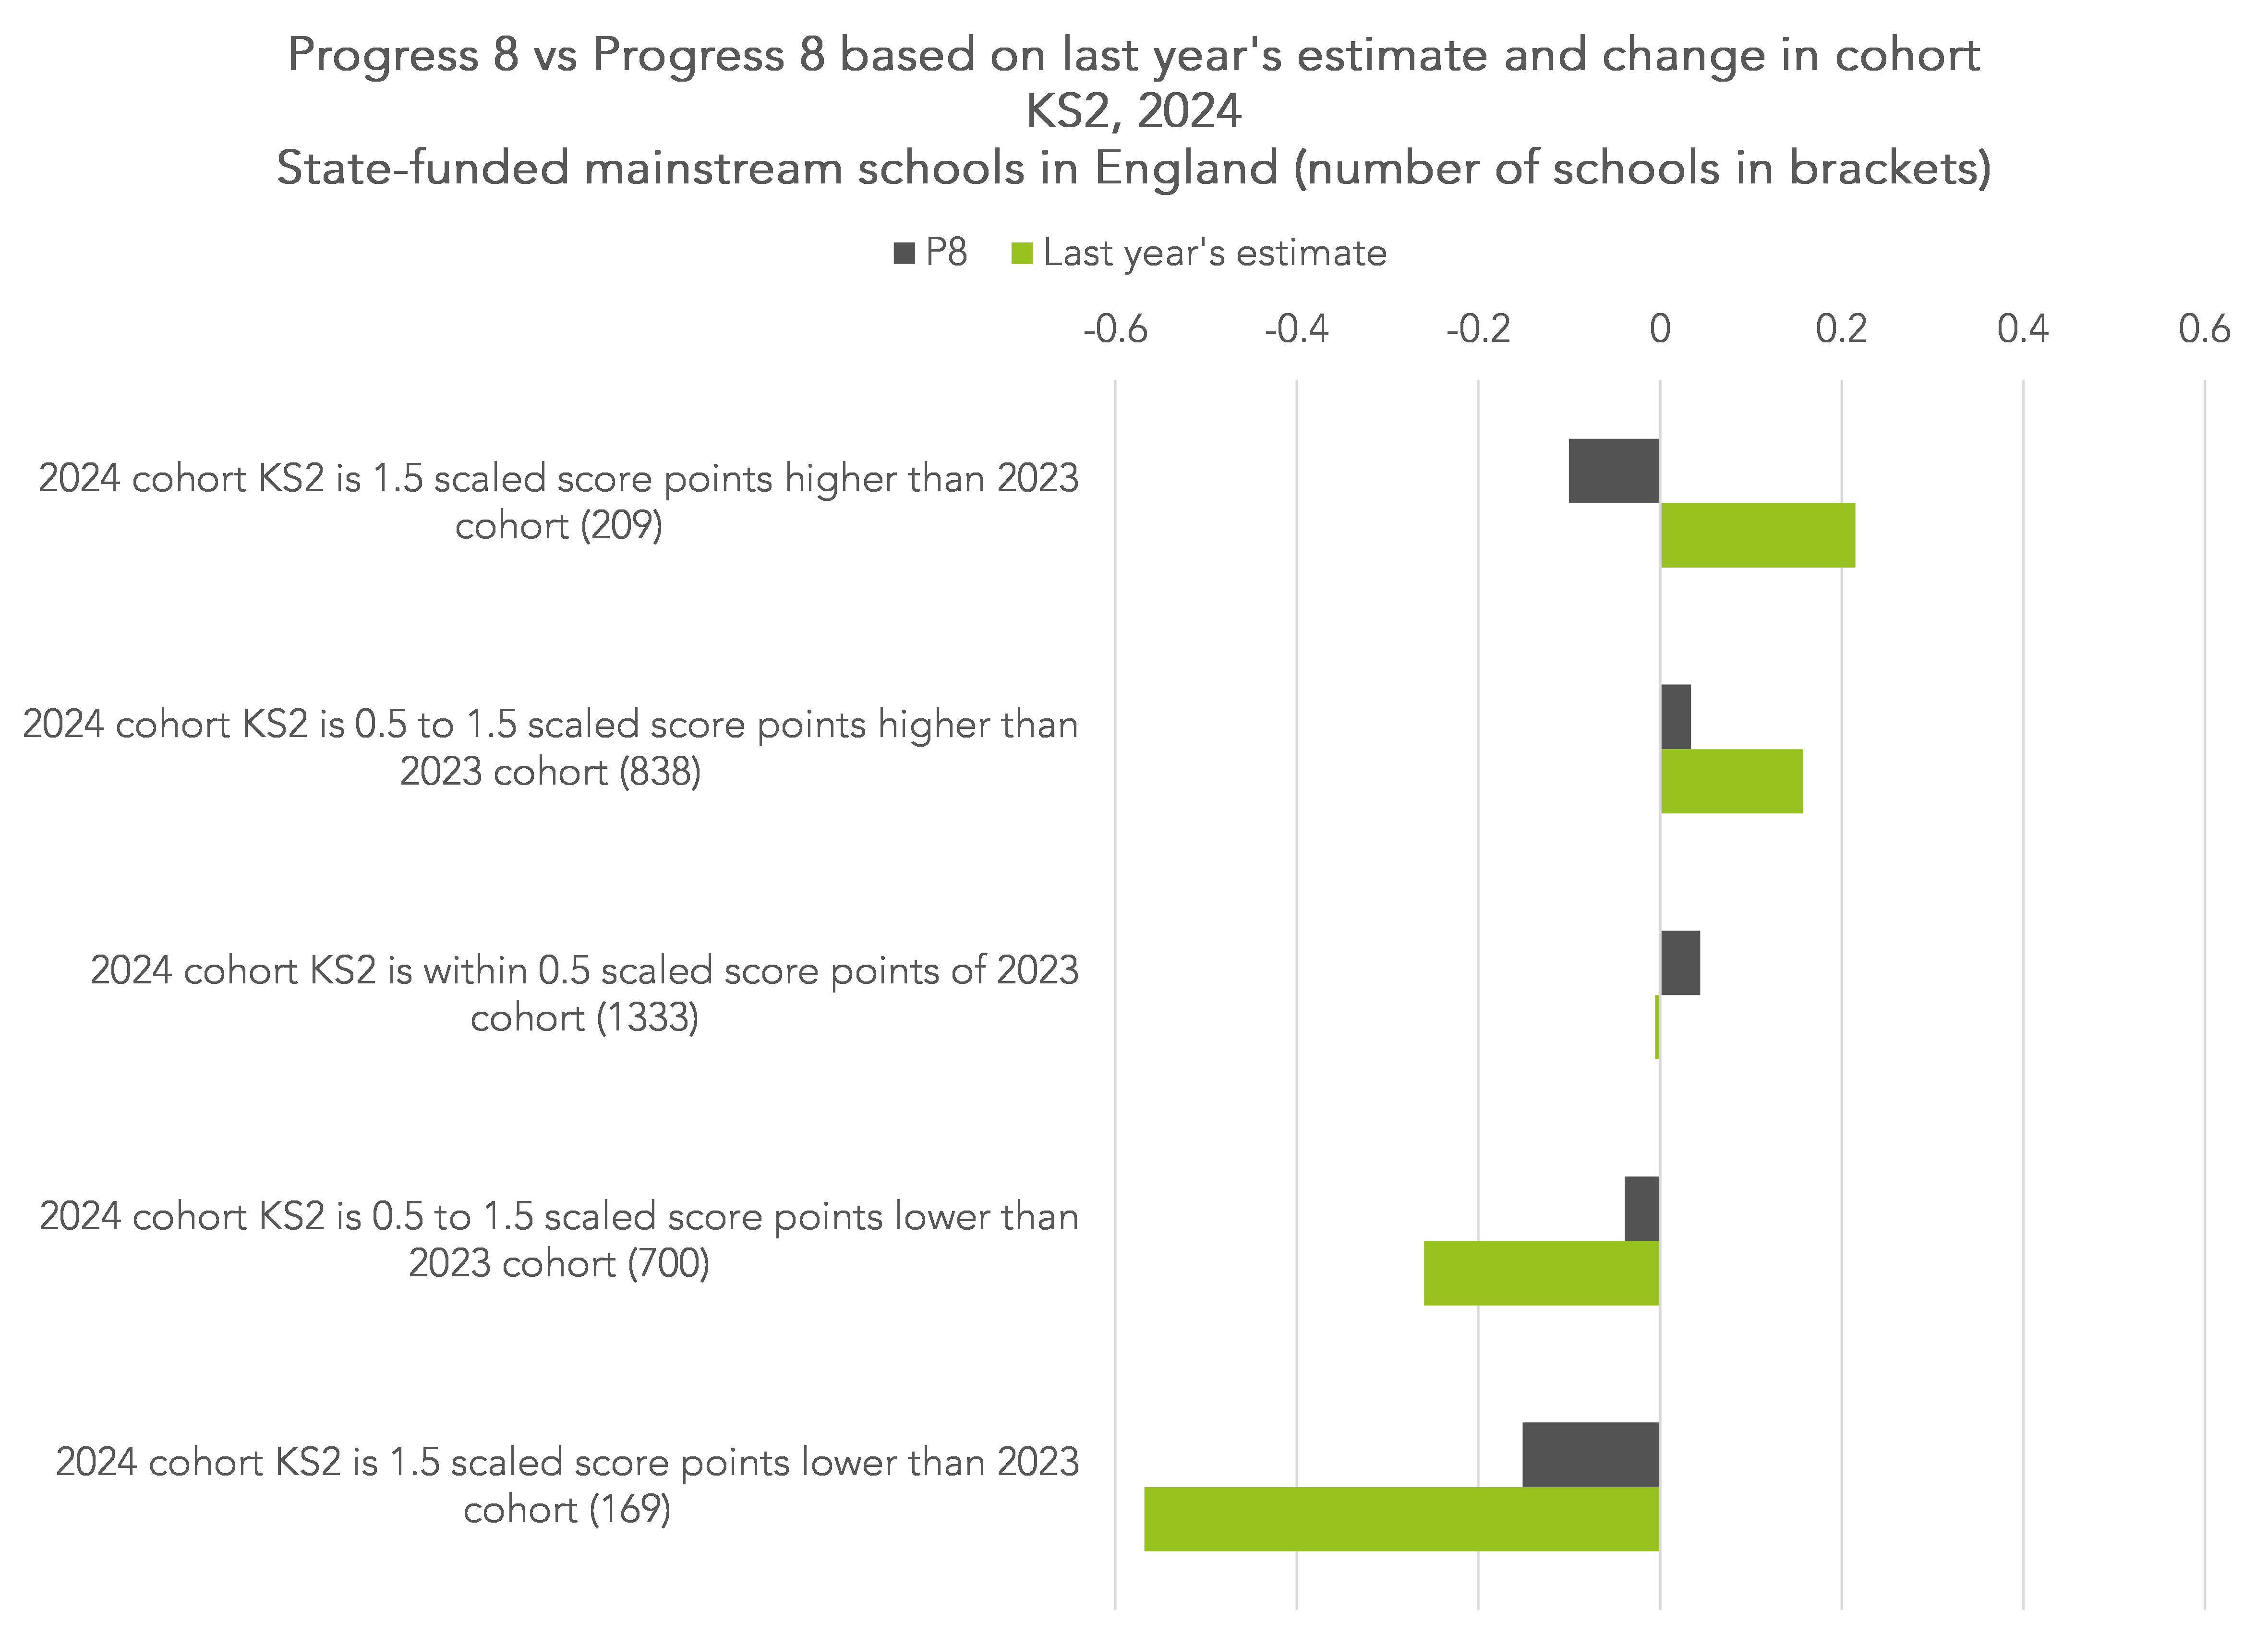
By contrast, schools with cohorts that have higher prior attainment than their preceding cohort tend to achieve higher proxy scores based on last year’s estimate compared to actual Progress 8 scores.
Schools with smaller cohorts will tend to have more variable cohorts. In the chart above, schools represented in the top and bottom sets of bars have around 150 pupils on average. This compares to 183 pupils for those in the middle set.
Summing up
In this article, we have looked at two proxies of Progress 8, one which uses pupils’ Key Stage 1 teacher assessments (rather than Key Stage 2 tests) as a baseline measure, and one which uses each school’s Attainment 8 estimate from the previous year as a benchmark.
We will also plan to calculate another proxy using pupils’ scores in Year 7 CAT4 tests in FFT Aspire in the summer.
All of these proxies will produce scores that look like Progress 8.
For many schools, each of the proxies will result in school-level scores very similar to those that would have occurred if Progress 8 could have been calculated.
But for some schools, particularly smaller schools and those with above average percentages of disadvantaged and/ or EAL pupils, they won’t.
If, for a given school, a proxy score this summer differs to the published Progress 8 score from last summer, you wouldn’t necessarily know if this was due to a change in the rate of progress, a methodological quirk or a bit of both.
Maybe calculating all three measures and using triangulation would help. If all three measures point in the same direction you would have a firmer basis for action.
Either way, with all of the proxies, caveat emptor.
- Strictly speaking, pupils with a first language other than English
Want to stay up-to-date with the latest research from FFT Education Datalab? Sign up to Datalab’s mailing list to get notifications about new blogposts, or to receive the team’s half-termly newsletter.


Can a secondary school access their students’ KS1 data? If so, how? Thanks!
Hi Tim. We’ll see if we can make this available via Aspire later in the year.
Hi Both,
You can access KS1 data by using Get Information About Pupils.
A fantastic resource for pupil level data!
Hi,
I might be reading this wrong but from the P8 and proxy bar chart and text before and after… The section after…
“By contrast, schools with cohorts that have higher prior attainment than their preceding cohort tend to achieve lower proxy scores based on last year’s estimate compared to actual Progress 8 scores.”
Should this not be “tend to achieve higher proxy scores”
Or for both schools with a marked increase in LPA or HPA a slightly lower statistical assurance (higher variance) from the proxy measures than from P8.
Hi Robin. Yes, you’re quite right. I’ve corrected it now. Thanks for letting us know.
very interesting, as ever, thank you. Could the National Reference Test for maths be used to adjust the proxy values, for that one subject?
Hi Matt. Thanks! Not sure I grasp the idea though. Only a small number of the cohort will have done the NRT. Or am I missing something?